Two-phase galaxy evolution: the cosmic star-formation histories of spheroids and discs
Abstract
From two very simple axioms: (1) that AGN activity traces spheroid formation, and (2) that the cosmic star-formation history is dominated by spheroid formation at high redshift, we derive simple expressions for the star-formation histories of spheroids and discs, and their implied metal enrichment histories.
Adopting a Baldry-Glazebrook initial mass function we use these relations and apply pegase.2 to predict the cosmic spectral energy distributions (CSEDs) of spheroids and discs. The model predictions compare favourably to the dust-corrected CSED recently reported by the Galaxy And Mass Assembly (GAMA) team from the FUV through to the band. The model also provides a reasonable fit to the total stellar mass contained within spheroid and disc structures as recently reported by the Millennium Galaxy Catalogue team. Three interesting inferences can be made following our axioms: (1) there is a transition redshift at at which point the Universe switches from what we refer to as “hot mode evolution” (i.e., spheroid formation/growth via mergers and/or collapse) to what we term “cold mode evolution” (i.e., disc formation/growth via gas infall and minor mergers); (2) there is little or no need for any pre-enrichment prior to the main phase of star-formation; (3) in the present Universe mass-loss is fairly evenly balanced with star-formation holding the integrated stellar mass density close to a constant value.
The model provides a simple prediction of the energy output from spheroid and disc projenitors, the build-up of spheroid and disc mass, and the mean metallicity enrichment of the Universe.
keywords:
galaxies: formation — galaxies: evolution — galaxies: bulges — galaxies: ellipticals — galaxies: star formation — galaxies: spiral1 Introduction
The vast majority of galaxies can be adequately described as consisting of a compact smooth spheroidal component containing a predominantly pressure-supported old [/Fe]-enhanced stellar population, and/or an extended flattened star-forming disc component containing intermediate and young stars with a wide range in metallicities, having smooth rotation and embedded in an extensive gaseous cold gas disc. Exceptions exist, most notably the dwarf populations which, while dominant in terms of number density, actually contribute only a modest amount to the baryon budget at the present time ( per cent; Driver 1999; Geller et al. 2012). This dichotomy of galaxies into spheroids and discs has been known for over a hundred years stretching back to even before the confirmation that galaxies are external systems (e.g., Hubble 1926, 1936; Zwicky 1957 and references therein). To some extent this dichotomy has been recently “rediscovered”, through the statistical studies of large populations as a galaxy bimodality (Strateva et al. 2001; Baldry et al. 2004). Driver et al. (2006) argued that this bimodality is better interpreted in terms of the earlier bulge-disc dichotomy and advocated routine structural decomposition as vital (e.g., Allen et al. 2006; Simard et al. 2011; Lackner & Gunn 2012) to directly trace the independent evolutionary histories of the spheroidal and disc components.
Numerical models of galaxy formation struggle to produce realistic galaxy systems with a tendency to form overly cuspy cores and difficulty in maintaining extended disc structures with a high axis ratio (White & Navarro 1993; Navarro & Steinmetz 2000; Abadi et al. 2003; House et al. 2011). Both problems are likely to be connected to the different fundamental properties of the dark matter and the baryons, and in particular their ability to experience pressure and their ability to dissipate energy. In the core regions the gravitational coupling of the baryons with the dark-matter may allow it to exhibit a pseudo-pressure, whereas in the outer-regions the ability of the baryons to dissipate energy on a timescale which is faster than the free-fall timescale may allow for the formation of a thin rotating baryonic disk. This picture while simple to articulate has proven extremely hard to simulate, with the need to partition and redistribute the angular momentum in a quite specific manner to result in galaxies with realistic appearances. In particular merger events are extremely disruptive to this process, imparting both energy and angular momentum to the baryonic disc, which is easily disrupted or ’plumped up’ (see Barnes & Hernquist 1992 for extensive discussion and early references on this topic, also Hopkins et al. 2009 for updated simulations on the survivability of discs during merger events). In general the greater the merger-rate the more bulge-dominated the final galaxy population appears.
More contemporary hydrodynamical simulations (e.g., Governato et al. 2010; Agertz, Romain & Moore 2011; Scannapieco et al. 2011; Domenech-Moral et al. 2012) are now starting to show significant success at producing realistic “looking” bulge-disc systems by incorporating a greater level of cold gas infall than previously assumed, as argued earlier by Keres et al. (2005) and Dekel et al. (2009). These focused hydrodynamical studies, however, are inevitably extracted from numerical simulations with particularly quiescent merger histories, suggesting such systems should be the exception rather than the norm. Hence, while numerical simulations of the development of the dark matter haloes find a continual process of halo merging, it appears that the baryons and what we identify as galaxies (baryonic condensates), might not develop in the same way. Martig & Bournaud (2009) argued that feedback from low and intermediate mass stars can contribute significantly to the redistribution of mass from the bulge to the disc through extensive (or even excessive) mass-loss. This baryonic outflow could help alleviate the problem of excessive bulge-formation by allowing some fraction of the collapsed stellar mass (up to per cent), to return to the halo and contribute to the later growth of a disc — thereby coupling bulge and disc growth. However this mechanism also relies on a fairly quiescent merger history during later times, and does not easily explain the broad diversity of bulge-disc ratios seen. As an aside, simulations have also demonstrated that baryonic outflows from the core regions can help provide a plausible explanation to the core-cusp problem (Governato et al. 2012; Zolotov et al. 2012). Clearly feedback and infall are both crucial processes, whose motivation is as much driven by the requirement to produce realistic looking images as by fundamental physics, and which are both more effective if the merger rate is either low or at least confined to earlier epochs.
As argued in the opening paragraph, we advocate a more heuristic approach where we put aside the issue of dark-matter assembly and start by asking whether the dichotomy of galaxy structure is best explained by two distinct formation mechanisms. Following the earlier discussion and lessons learnt from the simulations, the obvious two mechanisms can loosely be termed as a hot and cold mode. In the hot mode spheroids are formed early and rapidly via dynamically hot (turbulent) processes (collapse, fragmentation, and merging). In the cold mode discs are formed more slowly, from an extended quiescent phase of cold gas infall regulated by internal feedback (i.e., supernova). This basic concept is of course not new (e.g., Larson 1976; Tinsley & Larson 1978) but has laid dormant for sometime overshadowed by the dominance of merger-driven evolution. However the revival is also being championed via a series of semi-analytic studies by Cook et al. (2009; 2010a; 2010b, see also Dekel et al. 2009) inspired by behaviour seen in numerical simulations in which an initial rapid hot merger phase is typically followed by a more quiescent phase of accretion (see also L’Huillier, Combes & Semelin 2012).
The two-phase model is both obvious (given the bulge-disc nature of galaxies) and controversial, as it marginalises the merger rate required for dark matter assembly to earlier epochs than simulations typically suggest. This low merger rate is arguably corroborated by the local studies of dynamically close pairs (in particular see Patton et al. 2002; De Propris et al. 2005, 2007, 2010) — although a correct derivation of the merger rates requires a robust understanding of the merger timescales, which are currently poorly constrained. Perhaps more compelling, however, is the result that only 40% of the present day stellar mass resides in spheroidal systems (Driver et al. 2008; Gadotti 2009; Tasca & White 2011). A key inference is then: If discs are destroyed/thickened during mergers, yet the majority of stellar mass resides in discs, the dominant formation mechanism cannot be merger-driven, but presumably the more quiescent process of cold gas accretion. This statement becomes more profound when one realises that the stellar mass in discs today only measures that unaffected by mergers, and that some of the stars currently in spheroidal systems may have originally formed within discs via cold accretion prior to a merger event. In some bulge formation scenarios, star-formation via merging is dispensed with altogether and replaced by the migration of massive star-formation clumps formed within deeply turbulent discs (e.g., Elmegreen, Bournaud & Elmegreen 2008). This potentially relegates the stellar-mass build-up driven by mergers to be in the 0—40 per cent range by mass. Clearly mergers do occur at all redshifts and similarly discs may form, be disrupted, and reform at any redshift. Recently L’Huillier, Combes & Semelin (2012) reported that 77 per cent of a galaxy’s mass is formed via gas accretion and 23 per cent via direct merging from simulations. Other empirical studies also seem to suggest that the bulk ( per cent) of the stellar mass is mostly assembled by , again marginalising the role of late time major mergers (e.g., Bundy et al. 2004; Brown et al. 2007, 2008).
Focused studies of nearby galaxies are also unveiling significant levels of gas accretion in some nearby systems (Sancisi et al. 2008) and studies of the very rapid evolution of galaxy sizes have argued (e.g., Graham et al. 2011) that the compact elliptical systems seen at intermediate redshift () by Daddi et al. (2005) and Trujillo et al. (2006) (see also Bruce et al. 2012) might represent the naked bulges of present day spiral systems.
In essence the two-phase model is an attempt to highlight, conceptually, the possibility of a distinct change in the primary galaxy formation mechanism occurring at some transition redshift from an era where the dominant mode is major mergers leading to spheroid formation, to an era where the dominant mode is accretion leading to disc formation.
At early cosmic epochs we see a prevalence of distinct phenomena, in particular highly asymmetrical morphology in massive/luminous systems (Driver et al. 1998; Conselice, Blackburn & Papovich. 2005; Ravindranath et al. 2006) and significantly increased AGN activity (Fan et al. 2001,2003; Croom et al. 2004; Richards et al. 2006). AGN activity is directly linked to the formation and growth of the associated super-massive black holes (SMBH; Hopkins et al. 2008a) which in turn is linked to spheroid formation via the well established SMBH-bulge relations (see, for example, the review by Ferrarese & Ford 2005 or the recent near-IR SMBH-bulge luminosity relation by Vika et al. 2012). Recent studies also argue, from more direct empirical evidence, that AGN activity is almost always coincident with massive star-formation and that the two-processes do indeed appear to occur hand-in-hand (e.g., Rafferty et al. 2011). This AGN-SMBH-bulge connection therefore implies a clear timescale for the formation of the spheroid systems (see also Pereira & Miranda 2011 for a similar argument, albeit applied in the opposite direction).
In Section 2 we describe the empirical data describing the cosmic spectral energy distribution (CSED) of spheroids and discs as recently reported by the Galaxy And Mass Assembly team (Driver et al. 2011, 2012). In Section 3 we take the above arguments to their natural conclusion and use the AGN-SMBH-Bulge connection to define the independent star-formation history of spheroids and assign the residual star-formation, implied by the cosmic star-formation history, to describe that of the discs. In Section 4 we use our star-formation histories to produce predictions of the CSED of spheroids and discs, and in Section 5 compare the predictions to the data.
Throughout we use =70 h km s-1 Mpc-3 and adopt and (Komatsu et al. 2011).
2 The cosmic spectral energy distribution
In Driver et al. (2012) we reported the empirical measurement of the cosmic spectral energy distribution (CSED) in the nearby Universe, corrected for dust attenuation, and spanning the wavelength range from 0.1 to 2.1 m, i.e., the regime over which direct stellar-light dominates. These data were derived from the combination of the GAMA spectroscopic survey, currently underway on the Anglo-Australian Telescope (Driver et al. 2011), coupled with reprocessed and aperture matched data from GALEX, SDSS, and UKIRT LAS (see Seibert et al., in prep. and Hill et al. 2010). Driver et al. (2012) also provided the CSED subdivided according to spheroid-dominated and disc-dominated systems. The division into spheroid and disc dominated was achieved via visual classification, as neither a simple colour nor Sérsic index division appears to cleanly separate the two populations (see also Kelvin et al., 2012, figure 20).
The sample originated from a common volume of (Mpc/h)3 over the redshift range . Although the GAMA survey currently contains about 180,000 galaxies with known redshifts, the adopted redshift range significantly reduces the sample size to around 10,000. It also simplifies and removes any luminosity bias arising from large scale clustering as the sample is pseudo-volume limited around the region — i.e., those galaxies which dominate the luminosity density measurements.
As the GAMA survey lies entirely within the Sloan Digital Sky Survey, the GAMA CSED was renormalised to the full SDSS survey area. This reduces the cosmic/sample variance from around 15 per cent to 5 per cent (using the formula for estimating cosmic variance given by eqn. 4 of Driver & Robotham 2010).
2.1 The CSED of spheroids and discs
The final CSED values we use here are the spheroid-dominated and attenuation corrected disc-dominated values taken directly from Table 7 of Driver et al. (2012).
As dust attenuation is such a crucial issue it is worth mentioning the genesis of the corrections used by the GAMA team. First, the dust correction is only applied to the disc-dominated data and the spheroid population is assumed dust free (e.g., Rowlands et al. 2012). Second, the corrections are based on the radiative transfer models of Tuffs et al. (2002) and Popescu et al. (2011) which have been fine-tuned to the multiwavelength (FUV–far-IR) data of NGC891, and incorporate three distinct dust components; an extended low opacity disc, a compact high opacity disc and dust clumps. This fiducial model is calibrated to the galaxy population at large by modifying the -band central face on opacity until the predicted variation of flux with inclination matches the trend of with inclination seen in the Millennium Galaxy Catalogue data (Driver et al. 2007). This calibrated model was then used to derive the combined face-on and inclination dependent correction for a population of galaxies averaged over all viewing angles and over a wavelength range of m (Driver et al. 2008). This photon escape fraction (varying from 24 per cent in the FUV to 89 per cent in the -band) was then used to correct the CSED of disc-dominated systems to the intrinsic CSED, which we use here.
The CSED of spheroid-dominated and disc-dominated galaxies, however, is not precisely what we require, as some proportion of the CSED flux in the disc-dominated class may be coming from the central bulges. Likewise, some proportion of the flux in the spheroid-dominated class may be due to faint discs. In order to assess how much of a problem this might be, we can compare the ratio of the -band luminosity densities of the spheroid-dominated to non-spheroid dominated samples, to the ratio of the stellar mass densities of bulge+elliptical systems to disc systems from Driver et al. (2007)111The Driver et al. (2007) study is based on bulge-disc decompositions of the Millennium Galaxy Catalogue data (Liske et al. 2003; Driver et al. 2005) described in full in Allen et al. (2006). This test assumes that the -band luminosity is a suitable single-band proxy for stellar mass. We find reasonable agreement (within per cent), suggesting that a comparable amount of flux needs to be redistributed in either direction. In detail, the -band luminosity densities are 1.2 and 2.2 ( h W Mpc-3) for the spheroid-dominated and non-spheroid-dominated populations respectively (taken from Table 7 of Driver et al. 2012). Meanwhile the stellar mass densities for spheroids (bulge+ellipticals) and discs are 2.9 and 4.7 (h M⊙ Mpc-3) respectively (taken from Table 1 of Driver et al. 2007). This gives agreement to per cent and suggests that for the moment we can adopt the following approximation:
elliptical+bulge CSED Spheroid-dominated CSED
disc CSED non-Spheroid dominated CSED
In due course all galaxies at in the GAMA survey will be decomposed into bulge and disc components to enable a direct derivation of the true spheroid and disc CSEDs.
3 The star-formation history of spheroids and discs
The local CSED should be a predictable quantity if the cosmic star-formation history (CSFH) is known, the initial mass function (IMF) is universal and known, and a plausible stellar evolution code applied. Of course this is not quite so simple and in particular the metallicity enrichment adopted will significantly modify the predicted CSED shape. Upcoming papers will explore these issues in more detail, but here we wish to construct a basic first-look model and focus on the viability of the hypothesis that galaxy formation progressed in two fairly distinct phases: rapid spheroid formation followed by more quiescent disc growth.
In order to construct a model of the present day spheroid and disc CSEDs we need not just the CSFH, but the CSFH sub-divided into spheroids and discs. These CSED predictions can then be compared to the data from Section 2.
The existence of various super-massive black-hole bulge relations (e.g., Ferrarese & Ford 2005), provides the obvious smoking gun, as it couples SMBH growth to bulge growth. This is because SMBHs are believed to grow via mergers, resulting in an active-galactic nucleus phase (Hopkins et al. 2006). The growth of spheroids is therefore, arguably, mirrored via the more readily observable AGN activity history. This logical connection, from a correlation to causality, is the key assumption underpinning our model and forms the first of our two axioms. In the recent study by Richards et al. (2006), the integrated AGN activity versus redshift was reported and, ignoring any significant lag (in either spheroid formation or AGN activity), can be used as a proxy in shape for the spheroid cosmic star-formation history.
The amplitude of the spheroid SFH can be set from comparison of the AGN activity shape to the global CSFH. For our second axiom we elect to maximise the spheroid CSFH by setting the amplitude as high as possible without exceeding the global CSFH (i.e., a maximal spheroid formation scenario). Conceptually then, the heart of the two-phase model can be defined empirically from two axioms:
1) AGN activity traces spheroid growth
2) Spheroid formation dominates at high-z
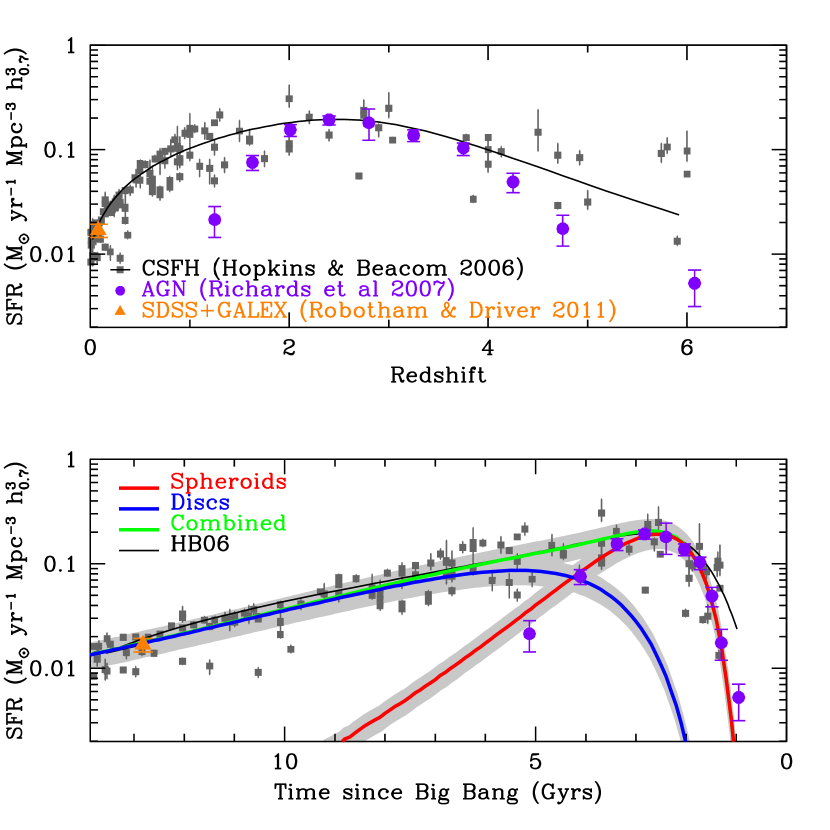
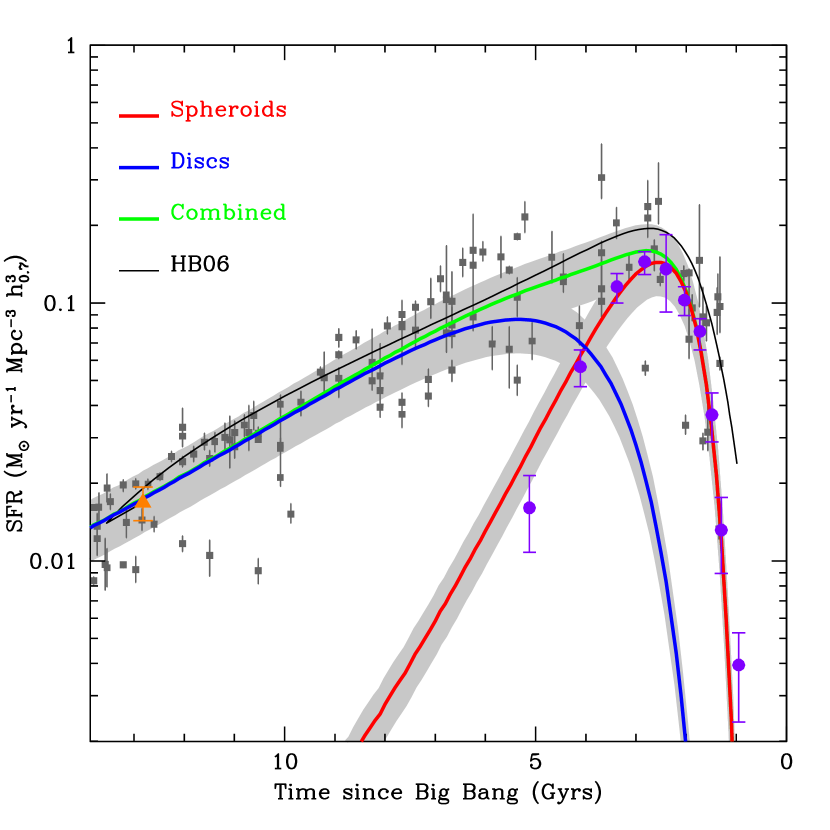
As the above two axioms are already constrained by empirical data, this provides a zero-parameter starting point for the two-phase model — bypassing the need for any initial conditions or detailed numerical simulations. Fig. 1 (upper) shows the fit (solid curve) to the cosmic star-formation history data (grey data points) taken from Hopkins & Beacom (2006; see their figure 2a and table 1 column 2). This adopts the parametric form defined by Cole et al. (2001) and where the UV data has been calibrated to a modified-Salpeter (1955) IMF. The data describing the AGN luminosity density are taken from Richards et al. (2006) and rescaled such that the peak of the AGN luminosity density lies on the CSFH curve (requiring an arbitrary multiplication by a factor of M⊙/yr-1L). Immediately noticeable is the apparent discrepancy/uncertainty at very high redshift. Particularly as the axioms above require that at the very highest redshift the CSFH and AGN activity curves should have the same form. To some extent the evident discrepancy simply reflects data uncertainty, as the dust corrections on the CSFH at high-z are poorly constrained with significant ongoing debate as to the true shape of the CSFH at the highest redshifts. For example, measurements of the star-formation history based on gamma-ray bursts (Yuksel et al. 2008; Kistler et al. 2009) often find higher star-formation rates. Likewise the incidence of dust-obscured AGN is an equally hotly debated topic (e.g., Polletta et al. 2006; Triester et al. 2010). Most recently Behroozi, Wechsler & Conroy (2012) argue that the compendium by Hopkins & Beacom (2006) potentially leads to an over-estimate of the cosmic star-formation history at very high redshifts as the pre-2006 UV luminosity densities may have been over-estimated and find a modified CSFH which agrees very well with the high-z AGN data (see their figure 2).
When presented as a function of time (Fig. 1, lower), it is clear that this discrepancy is not actually that significant, and the accumulated stellar mass able to be formed during this high-z interval is small compared to subsequent mass growth. We can now trivially fit the modified-Richards data to derive the star-formation history of spheroids. This fit can then be subtract from the global star-formation history and in turn fit to recover the implied disc formation history. The resulting expressions are given below and represent the star-formation rate () versus time in Gyrs () since the Big Bang for the spheroidal () and disc () populations:
| (1) | |||
| (2) |
where is the IMF multiplier as given in Table 1. The guideline error at any particular time should be taken as % based on the scatter of the original data shown on Fig. 1 (lower) i.e., %of the grey data points lie on the grey shaded regions. At this point it is also worth highlighting that while the AGN data (mauve points) place a strong constrain on the shape of the spheroid star-formation history the normalisation is very uncertain and based on the relatively limited high-z cosmic star-formation history data and as we shall see in Section. 4 will require a modest downward correction of 25% to match the observed CSED (i.e., within the grey shaded error bounds).
As an alternative for the spheroid population, one could instead use the total CSFH for Gyrs combined with the AGN luminosity density data for Gyrs, which is given by:
| (3) |
As stated these CSFHs are calibrated, via the UV data, to the modified-Salpeter IMF used by Hopkins & Beacom (2006) which was first laid down as Sal A by Baldry & Glazebrook (2003). To convert to other IMFs one needs to multiply by the factor () shown in Table 1.
| IMF | Multiplier |
|---|---|
| Salpeter (1955) | |
| modified-Salpeter (Hopkins & Beacom 2006) | |
| Baldry & Glazebrook (2003) | |
| Kroupa (1993) | |
| Kroupa (2001) | |
| Chabrier (2003) |
The simple expressions above are shown in Fig. 1 (lower) in red (spheroid), blue (disc), and green (spheroid + disc) and provide a good fit to the data given the accuracy to which the data are known. These equations now provide a blueprint for the formation of the present day spheroids and discs over the full age of the Universe, leading to a clear prediction of the stellar energy output and stellar mass growth.
Of particular interest should be the transition point around 4.2 Gyrs () from which point star-formation resulting in disc growth dominates over star-formation resulting in spheroid growth. This suggests a key epoch at which the Universe switches from merger dominated evolution to accretion dominated evolution and meshes very well with the evident change in the morphological appearance of galaxies from highly disturbed to more ordered systems at (see Driver et al. 1998; and also van den Bergh 2002).
4 Constructing the model
With the CSFH of spheroids and discs defined, we now build our empirical two-phase model adopting “vanilla” choices at every opportunity. In summary the key inputs and assumptions to the model are:
1) The star-formation history shown in Fig. 1 as discussed in section 3.
2) The adoption of a Universal IMF, in this case Baldry & Glazebrook (2003, henceforth BG03).
3) The adoption of pegase.2 (Fioc & Rocca-Volmerange 1997; 1999) to model the spectral output of the evolving stellar population (using default options throughout).
4) The assumption that the gas-phase metallicity increases linearly with star-formation from to for spheroids and to for discs, with no time lag (i.e., instantaneous enrichment).
4.1 Metal/chemical enrichment history
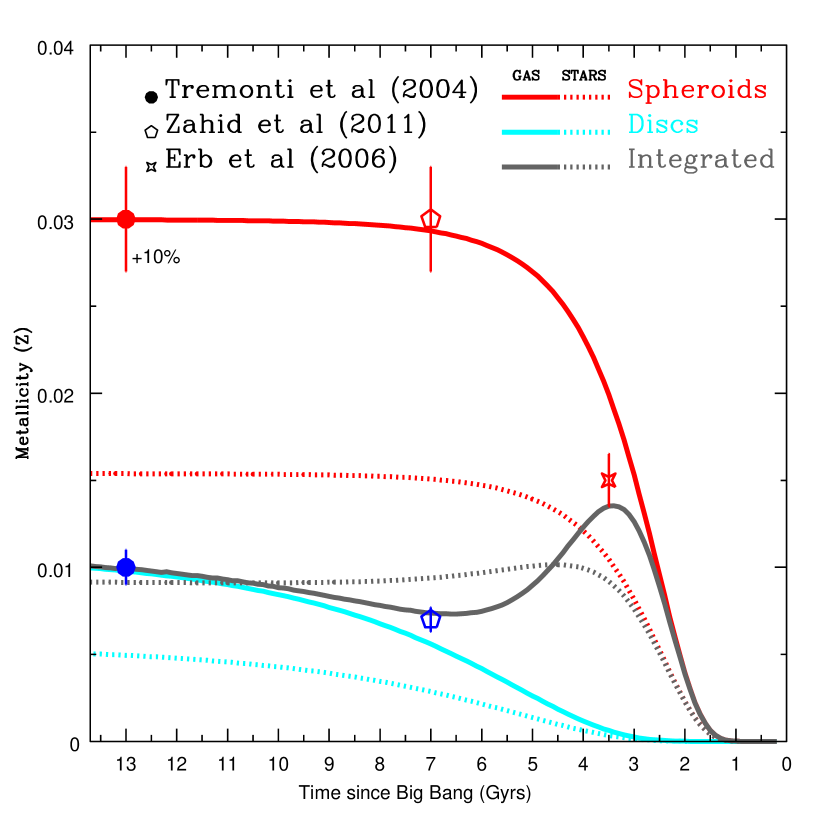
Perhaps the most uncertain of the above list is the appropriate metallicity history to adopt. Here we have been guided by the study of Tremonti et al. (2004) to define our gas-phase metallicity at redshift zero to be and for the spheroids and discs. These values were determined by noting the metallicity at M⊙ (predominantly spheroids) and at M⊙ (predominantly discs). To convert the given values to those shown on Fig.2 we adopt a solar metallicity of with . We then argue that in the absence of other factors the mean metallicity will rise approximately linearly with the cumulative cosmic star-formation history normalised to the present day values. This ignores the prospect of either pre-enrichment via, for example, Population III stars, or any lag between the star-formation and the increase in metallicity (i.e., instantaneous enrichment).
Conceptually these are loosely consistent with a closed-box model for spheroids (i.e., rising to a metallicity close to typical yields), and an infall model for discs or one in which the disc is gradually growing from a large gas “reservoir” (e.g., perhaps analogous to the “equilibrium model” put forward by Davé, Finlator & Oppenheimer 2012). To explore the bounds and importance of this metal enrichment, however, we also show the CSED predictions using our simple evolving metallicity history and for constant metallicity at the highest and lowest values. Fig. 2 shows the implied metallicity histories derived from Eqns. 1&2, for the two populations (as indicated by the red and cyan solid lines). Note that the grey lines on Fig. 2 show the combined metallicity of all stars formed (grey dotted line) and the integrated gas-phase metallicity (grey solid line). This shows interesting behaviour in that the average gas-phase metallicity (of the gas about to form stars) peaked at .
Constraints from the literature on the mean metallicity at intermediate and high redshift are minimal, however we note that Zahid, Kewley & Bresolin (2011) find from a sample of 1350 galaxies drawn from DEEP2 that massive systems have comparable gas-phase metallicity at to local systems, while low mass systems have a gas-phase metallicity reduced by 0.15dex. However Erb et al., (2006) find that the implied gas-phase metallicity, for massive, i.e., spheroidal-like systems, at is approximately half that at . Both of these results are crudely consistent with our inferred metallicity history if one equates (as we explicitly do), the massive systems to spheroids and low mass systems to discs. Note that one natural byproduct of this is that as intermediate mass systems have both a spheroid and a disc component their systemic metallicity will lie somewhere between the two extremes and exhibit strong radial gradients as one moves from the central spheroid component to the outer disc component. As the mean bulge-to-total ratio increases fairly smoothly with stellar mass this naturally gives rise to the mass-metallicity relation (Tremonti et al.2004). Note that the % error ranges shown on Fig. 2 are purely indicative as the actual ranges are poorly constrained.
4.2 Stellar population synthesis
To construct the redshift zero CSED the pegase.2 code (Fioc & Rocca-Volmerange 1997; 1999) was used to produce a series of single-stellar population (SSP) templates with an appropriate range of metallicities (Z = 0.000 to 0.025 in 0.001 intervals) and with the pegase.2 default steps in ages, (i.e., roughly logarithmic from 0-20Gyrs). For all SSP templates the star formation is set to a short continuous burst over a 1Myr period with constant metallicity (leading to the formation of M⊙ in pegase.2-normalised stellar mass units). These SSP spectra were then combined to create a library of 1 Gyr time averaged spectra from 0-1 Gyr to 13-14 Gyr in 1 Gyr intervals, and for each metallicity class. Note that the 0-1 Gyr bin which dominates the FUV and NUV region is extremely hard to model correctly because of the rapidly changing UV flux and requires more care. Here we take the rather simplistic approach of combining all the spectra provided by pegase.2 in the 0-1 Gyr range in the following manner i.e.,
Myr
To create the CSED at any redshift we then sum all previously formed populations, aged appropriately, drawn from the appropriate metallicity class, and scaled by the required star-formation rate. The modelling approach we adopt is therefore relatively simplistic and effectively assumes all values (star-formation rate, metallicity etc) are held constant over a 1 Gyr time period. At this stage we feel this is sufficient time resolution given the inherent uncertainties in the initial assumptions (i.e., the input CSFH and AGN activity data). CSEDs were then derived at all 13 time steps and combined to produce simple evolution movies available from:
http://www.simondriver.org/model1.gif — evolving metallicity
http://www.simondriver.org/model2.gif — constant high metallicity
http://www.simondriver.org/model3.gif — constant zero metallicity
4.3 Normalisation of the CSEDs
In order to determine the correct normalisation we need to multiply the output pegase.2 SSP spectra which are in units of erg s-1 by . Here the factor scales to 1 Gyr bins, the factor converts erg s-1 to W, the wavelength is in Angstroms, and the factor 0.002 scales the spectra to 1 solar mass. In applying Eqns. 1-3 we set to 0.7 to correct the CSFHs to the BG03 IMF.
Finally we allow the normalisations to float by % to account for the uncertainty highlighted in Fig. 1 by the grey shading, along with uncertainties in the multiplication factors in Table 1, the cosmic variance in the GAMA CSED data, and the impact of metallicity on star-formation rates. These 1 values are shown in brackets in Figs. 3 & 4.
5 Models v data
5.1 The CSED and adopted metallicity
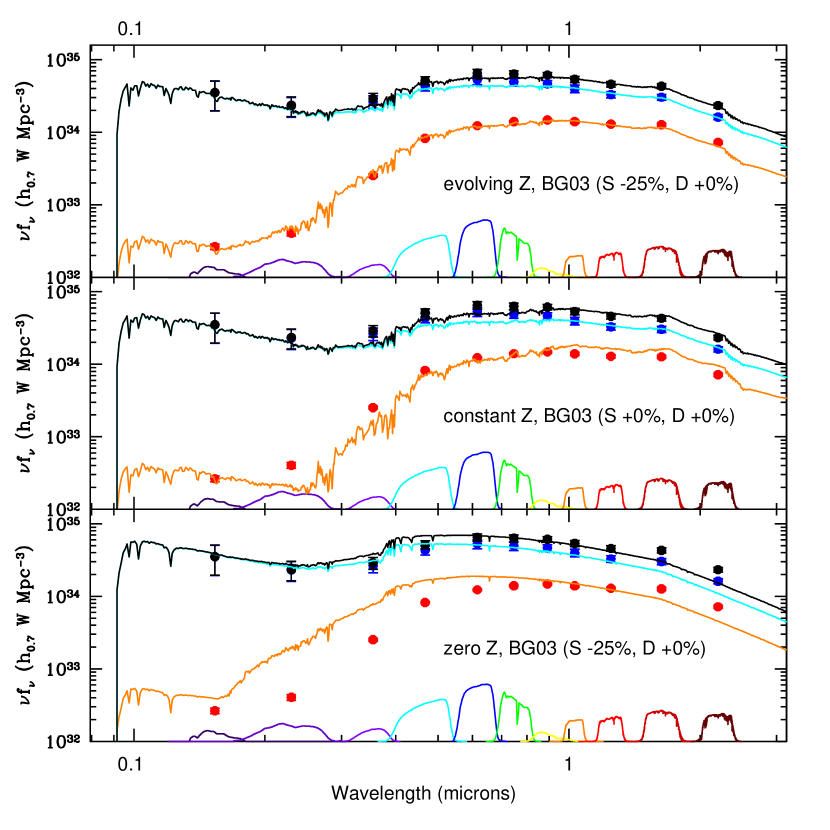
Fig. 3 shows the direct comparison of our CSED models against the recent GAMA data (Driver et al. 2012), for the three assumed metallicity histories (as indicated). The top panel, which adopts the evolving metallicity, shows a remarkable agreement across the full wavelength range and for both the spheroid and disc systems. Note that in achieving these fits the spheroid data have been renormalised downwards by 25% which is within the specified range of uncertainty. The central and lower panels of Fig. 3 show the same models except for a constant high or low metallicity. This has a negligible impact on the disc-CSED, suggesting very little dependency on the assumed metallicity evolution for discs (perhaps in part due to the low value adopted). Conversely the impact on the spheroid CSED is quite marked with the CSED tilting either redward or blueward for constant high or constant low metallicity respectively. This perhaps lends some argument against any very strong pre-enrichment phase as intermediate and low metallicity stars in spheroids are required to produce a plausible CSED. The obvious caveat is whether the shape of the currently adopted spheroid CSED is significantly modified/contaminated by young disc light.
5.2 Dependency on assumed IMF
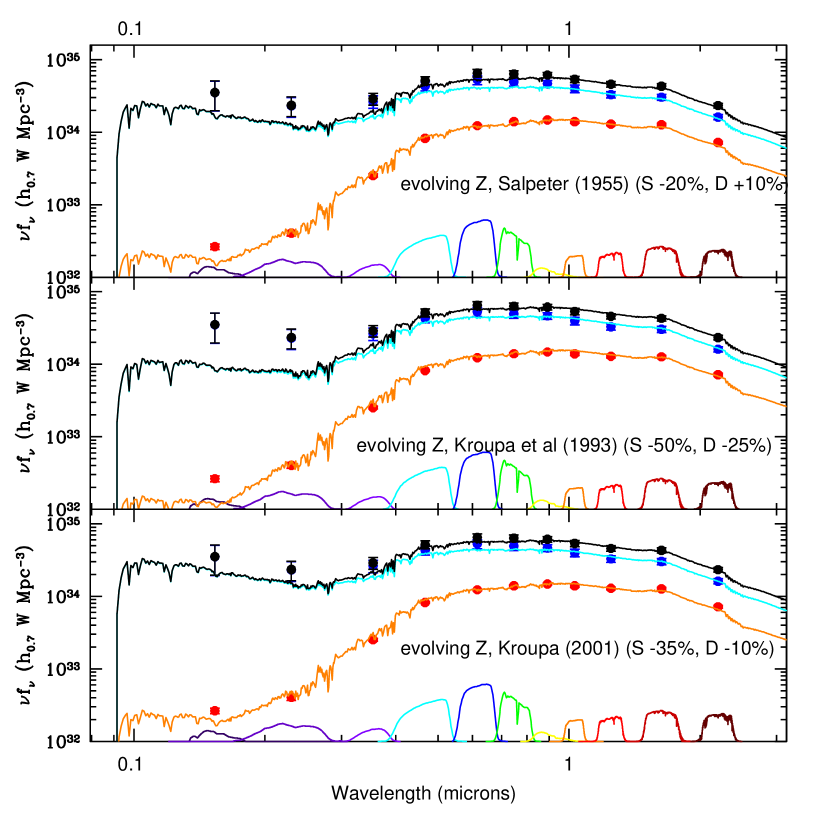
We now briefly explore the impact of the adopted IMF. Fig. 4 shows the CSED predictions for the evolving metallicity scenario using either a (top) Salpeter (1955), (centre) Kroupa et al. (1993), (bottom) or Kroupa (2001) IMF. Note that the Kroupa (2001) IMF is extremely close in form to the Chabrier (2003) IMF and therefore the Kroupa (2001) prediction can be taken as representative of both.
Essentially all IMFs provide an equally good fit to the CSED except in the UV regime. At wavelengths longer than -band (m) the resulting shape is not particularly sensitive to the detailed shape of the IMF. This is mainly because at stars close to solar luminosity, where the IMF is least contentious, are dominating most of the CSED. Systems at the very high-mass end which formed at high redshift will no longer be contributing to the CSED whereas very low-mass stars are yet to dominate the near-IR flux. The CSED is therefore unable to constrain the IMF other than the normalisations required for these IMFs are generally higher than for the models based on BG03.
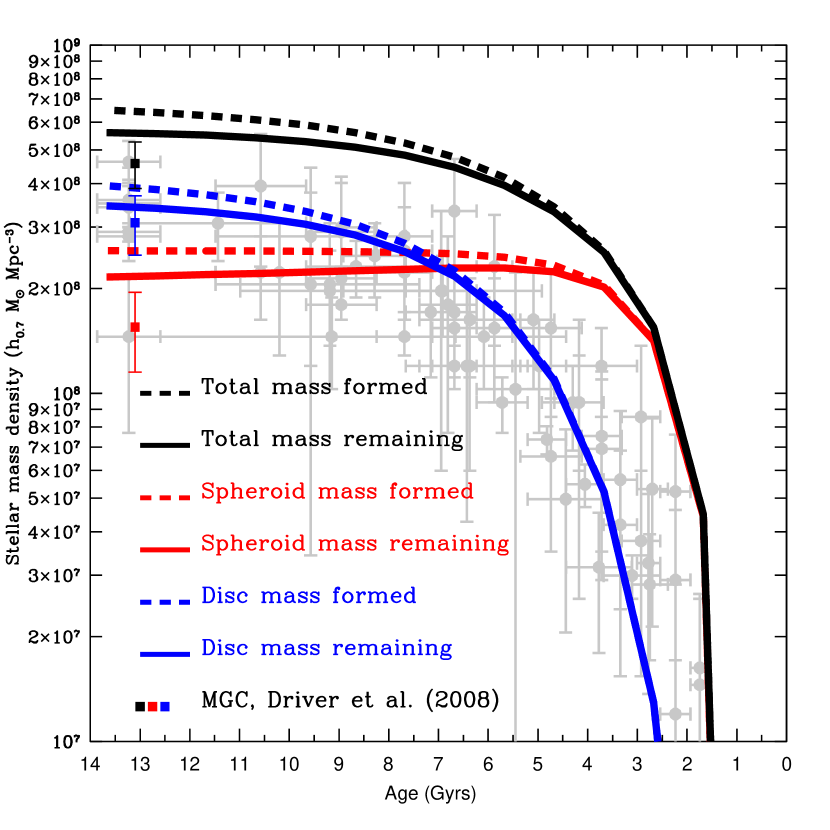
5.3 Stellar mass history
Fig. 5 shows the implied build-up of stellar mass in spheroids and discs (and combined), as indicated. Note that we show both the total cumulative stellar mass formed (dashed lines), along with that remaining based on default pegase.2 assumptions as to mass-loss (solid lines). Also shown are the direct empirical stellar mass measurements from the Millennium Galaxy Catalogue (Liske et al. 2003; Driver et al. 2005), which includes corrections for dust attenuation (Driver et al. 2008). The agreement is reasonable with the discs agreeing with the MGC data to within the error and the spheroid mass over-predicting the MGC value by a modest amount. It is worth noting from Fig. 5 that the stellar mass of spheroids is actually declining, with mass-loss having exceeding mass-gain for the past 9 billion years. For the discs, the two almost exactly balance, such that the overall stellar mass density appears to asymptote to a constant value around the present day.
Also shown in Fig. 5 as grey shaded data are the compendium of total stellar mass estimates given in Wilkins, Trentham & Hopkins (2008a). These data clearly fall significantly below the black shaded line, highlighting a significant discrepancy between the total stellar mass inferred from the cosmic star-formation history and that derived from direct empirical constraints. This offset is well known and discussed in detailed in Wilkins, Trentham & Hopkins (2008a), here we make two additional comments: (1) the shape of the data and the black curve do broadly agree with a offset at almost all ages, (2) the data from the MGC includes detailed dust corrections for both the optically thin and optically thick regions and is typically a factor of higher than most local measurements. It is possible then that the values from the literature are missing mass embedded in optically thick regions. Perhaps a more likely explanation, also put forward by Wilkins et al. (2008) is that the IMF was simply lighter at earlier times. This would reconcile quite nicely as the low-z CSED is fairly impervious to the very low mass-end of the IMF.
5.4 Discussion
At this point we have a simple heuristic model which adopts two simple axioms motivated by the physically distinct appearance of spheroids and discs in the nearby Universe. These axioms combined with the empirical compendium of AGN and cosmic star-formation activity/history are able to reproduce the CSEDs of spheroids and predict the mean mass and metallicity evolution of present day discs and spheroids. The model also provides a complete description of the energy output from stars within those systems which will eventually make up the local spheroid population (projenitors) as a function of redshift, the metallicity build-up, and suggests key cross-over epoch at between the hot and cold mode evolution. This later transition redshift is consistent with the obvious change in morphologies seen in HST images at this redshift (e.g., Driver et al., 1998, figure 3).
However an obvious weakness is that the model provides no clear prediction of the morphological, size- and shape- evolution, merger rates, or the clustering of the galaxy population. Furthermore the model does not stipulate the actual mechanism by which star-formation is occurring and for the hot mode could be some combination of monolithic collapse, major merging, and/or clump migration. Within the recent literature the exact status of the population is also unclear. Deep IFU studies (e.g., Forster Schreiber et al., 2009,2011) find that the majority of star-formation at appears to be taking place in rotating clumpy disc structures with no obvious central bulge component. Similarly Chevance et al., (2012, see also Weinzirl et al., 2011) from a study of 31 high-z galaxies, find that the Sérsic indices are significantly flatter than one would expect for low-z spheroids and obvious disc structures are present in many cases. From our Fig. 1 we can see that at we are still within the epoch where spheroid formation should be dominating. However spheroid formation does not necessarily imply spheroid morphologies until after some unspecified time-lag in which the system settles. In fact violently star-forming systems will inevitably appear blue, asymmetrical, gas-rich, and dusty, i.e., quite disc-like in many aspects. Other studies, e.g., van Dokkum (2008), find that 45% of massive galaxies at do indeed have evolved stellar populations, little or no ongoing star-formation, and compact early-type morphologies. Hence a picture of a spheroid population emerging from a highly turbulent progenitor phase around appears to be qualitatively consistent with our model. Alternatively our model may need to be adjusted to allow for gas infall and disc-formation from the outset with some fraction of the disc-formed stars merging into bulges, i.e., a relaxation of the maximal spheroid formation axiom. This would have the net effected of also increasing the cross-over redshift to
A further intriguing observations is that high-z spheroids are significantly more compact than nearby ellipticals by factors of at fixed stellar mass (e.g., Daddi et al., 2005; van Dokkum et al., 2008 etc). Within our scenario this could be consistent with the high-z sample being “naked”-bulges yet to grow discs or yet to be “puffed-up” through successive minor merger interactions or adiabatic expansion. These two pathways, disc-growth verses “puffing”, are likely to be strongly environmentally dependent with minor mergers more frequent in high density environments, and gas infall more prevalent in low-density environments. A particularly interesting comparison might therefore be the mass-size relation of high-z spheroids to low-z bulges.
With the caveat that the morphology and size evolution within our model is unspecified we nevertheless appear to have a prediction of the energy output of spheroid and discs projenitors over all epochs (Fig. 3 top panel), the mean gas-phase metallicity history for each population (Fig. 2), and the build-up of stellar mass (Fig. 5). Whether one can readily distinguish these populations observational however is an open question.
Finally it is worthwhile reiterating that this model contains no tunable parameters nor any dependency on initial conditions beyond the underlying cosmology. The model is built entirely from empirical data and provides a fully consistent empirical scaffolding upon which more physically motivated models can be built. Our conclusion is that the initial axioms on which the model is based are viable and the star-formation histories defined are tenable.
Further studies of the variation of the CSED and its dependency on environment should enable an investigation into dependencies on clustering, and to assess whether star-formation proceeds more rapidly or whether it is merely the relative mix of spheroid v disc formation which is changing. Similarly, using observations at intermediate redshift, it should be possible to compare data from high-z studies to the predictions of our two-phase model. Both of these avenues will be explored in future papers.
6 Conclusions
From two very simple axioms: (1) that AGN activity traces spheroid formation, and (2) that the CSFH is dominated by spheroid formation at high redshift, we are able to derive simple expressions for the cosmic star-formation histories of spheroids and discs. Following comparisons to the CSED for spheroids and discs we find a modest downward adjustment of 25% provides the optimal fit resulting in our final recommended star-formation histories of:
| (4) | |||
| (5) |
where is the IMF multiplier as given in Table 1. Fig. 6 shows these final relations compared to the compendium of data provided by Hopkins & Beacom (2006) and despite the renomalisation of the spheroid star-formation history still provide a perfectly satisfactory description of the global CSFH.
Adopting a Baldry & Glazebrook (2003) IMF and using these expressions to predict the CSED, we are able to provide a satisfactory explanation of the observed CSEDs of spheroids and discs from the FUV to the -band.
The corollary of the simplicity of the two-phase model, however, is that it lacks any prediction of the clustering signature, environmental dependencies, or the merger histories, although these can be built in at a later stage. Perhaps the key gain, in an era of hidden tunable parameters, is that with the adoption of a universal IMF and a stellar evolution code there are essentially no free parameters. Strictly speaking this is not precisely true as the detailed modelling of stellar evolution typically comes with options and there is arguably a choice of IMFs and also whether it is Universal or varies over cosmological time (see for example Wilkins et al. 2008a, 2008b; Gunawardhana et al. 2011). On this last subject of the IMF it is worth reiterating that longward of m the CSED is not sensitive to the high-mass shape of the IMF (unless taken to the extreme). This is because at almost all wavelengths, in the declining star-formation era today, the CSED is dominated by either the tip of the main sequence, which lies just below a solar mass and well above the mass range of contention (mid-optical to NIR), or the most recently formed stars (FUV to mid-optical).
As a byproduct, the two-phase model also provides the CSED of spheroids and discs at every epoch in the Universe, along with the prediction of a clear-cut transition redshift at around where galaxy evolution switches from evolution being dominated by major mergers to evolution being dominated by cold gas infall. Future work will include a broader wavelength baseline, bulge-disc decompositions, inclusion of the AGB energy output, and development of the model via comparisons to selected external data.
Acknowledgments
We thank the referee for insightful comments during the refereeing process which has helped improve the paper.
References
Allen P.D., Driver S.P., Graham A.W., Cameron E., Liske J., de Propris R., 2006, MNRAS, 371, 2
Abadi M.G., Navarro J.F., Steinmetz M., Eke V.R., 2003, ApJ, 591, 499
Agertz O., Romain T., Moore B., 2009, MNRAS, 397, 64
Baldry I.K., Glazebrook K., ApJ, 2003, 593, 258
Baldry I.K., 2004, ApJ, 600, 681
Barnes J.E., Hernquist L., 1996, ARA&A, 30, 705
Behroozi P.S., Wechsler R.H., Conroy C., 2012, ApJ, submitted (arXiv:1207.6105)
Brown M.J.I., Dey A., Jannuzi B.T., Brand K., Benson A.J., Brodwin M., Croton D., Eisenhardt P.R., 2007, ApJ, 654, 858
Brown M.J.I., et al., 2008, ApJ, 682, 937
Bundy K., Fukugita M., Ellis R.S., Kodama T., Conselice C., 2004, ApJ, 601, 123
Chabrier G., 2003, PASP, 115, 763
Chevance M., et al., 2012, ApJ, 754, 24
Cole S. et al., 2001, MNRAS, 326, 255
Conselice C.J., Blackburne J.A., Popovich C., 2005, ApJ, 620, 564
Cook M., Lapi A., Granato G.L., 2009, MNRAS, 397, 534
Cook M., Barausse E., Evoli C., Lapi A., Granato G.L., 2010b, MNRAS, 402, 2113
Cook M., Evoli C., Barausse E., Granato G.L., Lapi A., 2010a, MNRAS, 402, 941
Daddi E., et al., 2005, ApJ, 626, 680
Davé R., Finlator K., Oppenheimer B.D., 2012, MNRAS, 421, 98
Dekel A., et al., 2009, Nature, 457, 451
De Propris R., Liske J., Driver S.P., Allen P.D., Cross N.J.G., 2005, MNRAS, AJ, 130, 1516
De Propris R., Conselice C., Liske J., Driver S.P., Patton D.R., Graham A.W., Allen P.D., 2007, ApJ, 666, 212
De Propris R., et al., 2010, AJ, 139, 794
Domenech-Moral M. Martinez-Serrano F.J. Dominguez-Tenreiro R., Serna A., 2012, MNRAS, 412, 2510
Driver S.P. Fernandze-Soto A., Couch W.J., Odewahn S.C., Windhorst R.A., Phillipps S., Lanzetta K., Yahil A., 1998, ApJ, 496, 93
Driver S.P., 1999, ApJ, 526, 69
Driver S.P., Liske J., Cross N.J.G., De Propris R., Allen P.D., 2005, MNRAS, 360, 81
Driver S.P., et al., 2006, MNRAS, 368, 414
Driver S.P., Popescu C.C., Tuffs R.J., Liske J., Graham A.W., Allen P.D., de Propris R., 2007, MNRAS, 379, 1022
Driver S.P., Popescu C.C., Tuffs R.J., Graham A.W., Liske J., Baldry I., 2008, ApJ, 678, 101
Driver S.P., Robotham A.S.G., 2010, MNRAS, 407, 2131
Driver S.P., et al., 2012, MNRAS, in press (astro-ph/1209.0259)
Driver S.P., et al., 2011, MNRAS, 413, 971
Elmegreen B.G., Bournaud F., Elmegreen D.M., 2007, ApJ, 658, 67
Erb, D., Shapley A., Pettini M., Steidel C.C., Reddy N.A., Adelberger K.L., 2006, ApJ, 644, 813
Ferrarese L., Ford H., 2005, SSRv, 116, 523
Fioc M., Rocca-Volmerange B., 1997, A&A, 326, 950
Fioc M., Rocca-Volmerange B., 1999, (arXiv:9912179)
Forster Schreiber N.M., et al. 2011, AJ, 739, 45
Forster Schreiber N.M., et al. 2009, ApJ, 706, 1364
Gadotti D., 2009, MNRAS, 393, 1531
Geller M.J., Diafero A., Kutz M.J., Dell’Antonio I.P., Fabricant D.G., 2012, AJ, 143, 102
Graham A.W., 2011, in Planets, Stars and Stellar Systems, (Publ: Springer)
Governato F., et al., 2010, Nature, 463, 203
Governato F., et al., 2012, MNRAS, 422, 1231
Hill, D., et al., 2011, MNRAS, 412, 765
House E.L., et al., 2011, MNRAS, 415, 2652
Hopkins A.M., Beacom J.F., 2006, ApJ, 651, 142
Hopkins P.F., Hernquist L., Cox T.J., Di Matteo T., Robertsan B., Springel V., 2006, ApJS, 163, 1
Hopkins P.F., Hernquist L., Cox T.J., Keres D., 2008a, ApJS, 175, 356
Hopkins A.M., McClure-Griffiths N.M., Gaensler B.M., 2008b, ApJ, 682, L13
Hopkins P.F., Cox T.J., Younger J.D., Hernquist L., 2009, ApJ, 691, 1168
Hubble E., 1926, ApJ, 64, 321
Hubble E., 1936 in Realm of the Nebulae (Pub: Yale Uni. Press)
Keres D., Katz N., Weinberg D.H., Dave R., 2005, MNRAS, 363, 2
Kistler M.D., Yuksel H., Beacom J.F., Hopkins A.M., Wyithe J.S.B., 2009, ApJ, 705, 104
Koda J., Milosavljevic M., Shapiro P.R.,. 2009, ApJ, 696, 254
Komatsu et al., 2011, ApJS, 192, 18
Kroupa P., 1993, MNRAS, 262, 545
Kroupa P., 2001, MNRAS, 322, 231
Larson R.B., 1976, MNRAS, 176, 31
L’Huillier B., Combes F., Semelin, B, 2012, A&A, 544, 68
Liske J., Lemon D.J., Driver S.P., Cross N.J.G., Couch W.J., 2003, MNRAS, 344, 307
Lackner C.N., Gunn J.E., 2012, MNRAS, 421, 2277
Martig M., Bournaud F., 2010, ApJ, 714, 275
Navarro J.F., Steinmetz M., 2000, ApJ, 538, 477
Patton D.N., et al., 2002, ApJ, 565, 208
Pereira, E.S., Miranda O.D., 2011, MNRAS, 418, 30
Polletta M., et al., 2006, ApJ, 642, 673
Popescu C.C., Tuffs R.J., Dopita M.A., Fischera J., Kylafis N.D., Madore B.F., 2011, A&A, 527, 109
Rafferty D.A., Brandt W.N., Alexander D.M., Xue Y.Q., Bauer F.E., Lehmer B.D., Luo B., Papovich C., 2011, ApJ, 742, 3
Ravindranath S., et al., 2006, ApJ, 652, 963
Richards G., et al 2006, AJ, 131, 2766
Robotham A.S.G., Driver S.P., 2011, MNRAS, 413, 2570
Salpeter E.E., 1955, ApJ, 121, 161
Sancisi R., Fraternall F., Oosterloo T., van der Hulst J.M., 2008, A&A Rv, 15, 189
Scannapieco C, White S.D.M., Springer V., Tissera P.B., 2011, MNRAS, 417, 154
Simard L., Mendel J.T., Patton D.R., Ellison S.L., McConnachie A.W., 2011, ApJS, 196, 11
Strateva I., et al., 2001, AJ, 122 1861
Tasca L.A.M., White S.D., 2011, A&A, 530, 106
Tinsley B.M., Larson R.B., 1978, ApJ, 221, 554
Tremonti C.A., et al., 2004, ApJ, 613, 898
Triester E, Urry M.C., Schawinski K., Cardamone C.N., Sanders D.B., 2010, ApJ, 722, 238
Tuffs R., Popescu C.C., Volk HJ., Kylafis N.D., Dopita M.A., 2004, A&A, 419, 821
van den Bergh S., 2002, PASP, 114, 797
van Dokkum P., et al., 2008, ApJ, 677, 5
Vika, M., Driver S.P., Cameron E., Kelvin L., Robotham A.S.G., 2012, MNRAS, 419, 2264
Weinzirl T., et al., 2011, ApJ, 743, 87
White S.D.M., Navarro J.F., 1993, Nature, 366, 429
Wilkins S., Trentham N., Hopkins A.M., 2008a, MNRAS, 385, 687
Wilkins S., Hopkins A.M., Trentham N., Tojeiro R., 2008b, MNRAS, 391, 363
Yuksel H., Kistler M.D., Beacom J.F., Hopkins A.M., 2008, ApJ, 683, 5
Zahid H.J., Kewley L.J., Bresolin F., 2011, ApJ, 730, 137
Zolotov A., et al., 2012, ApJ, submitted (astro-ph/1207.0007)
Zwicky F., 1957, in Morphological Astronomy (Pub: Springer)