Evidence for the bottom baryon resonance state with the CDF II detector
Abstract:
Using data from collisions at recorded by the CDF II detector at the Fermilab Tevatron, we present evidence for the excited resonance state in its fully reconstructed decay mode to where with . The analysis is based on a data sample corresponding to an integrated luminosity of collected by an online event selection based on tracks displaced from the interaction point. The local significance of the observed signal is while the significance of the signal for the search region is . The mass of the observed state is found to be .
Baryons with a heavy quark can be viewed as a useful laboratory for quantum chromodynamics (QCD) in its confinement domain. An experimental measurement of a new heavy quark baryon state adds another constraint in sampling the confinement QCD force with experimental data.
The first result on bottom baryon resonances was obtained by CDF with the discovery of the -wave states in the decay modes [1]. Recently CDF has confirmed this observation presenting the measurements of the masses and widths of the baryons [2]. In this report, we present evidence for the -wave bottom resonance , predicted at a mass scale to be next to the established baryons. We have searched for candidate baryons with the complete data sample of . Our result provides an additional contribution to the currently small number of heavy quark baryon observations.
The models describing the heavy hadrons in the framework of heavy quark effective theories (HQET) [3] treat a heavy baryon as a system consisting of a heavy quark considered as a static color source with mass and of a light diquark with a gluon field [4]. Thence the bottom quark and the spinless diquark make the lowest-lying singlet ground state , the experimentally well established baryon [5]. When the diquark acquires an orbital excitation with relative to the heavy quark , the two excited states emerge with the same quark content as a singlet , with isospin but with total spin and [6]. These isoscalar states are the lowest-lying -wave states that can decay to the singlet via strong processes involving emission of a pair of soft pions – given the parity is conserved and provided sufficient phase space is available. Both particles are classified as bottom baryon resonant states.
Several recent theoretical predictions on masses of the excited heavy baryons are available [8, 9, 10]. Based on the predictions, the mass difference for the first, state, is predicted to be of . The mass splitting between different states, , is evaluated to be of order .
The component of the CDF II detector [11] most relevant to this analysis is the charged particle tracking system. The tracking system operates in a uniform axial magnetic field of generated by a superconducting solenoidal magnet. The inner tracking system comprises three silicon detectors: layer 00 (L00), the silicon vertex detector (SVX II), and the intermediate silicon layers (ISL) [12]. A large open cell cylindrical drift chamber, the central outer tracker (COT) [13], completes the CDF detector tracking system. The silicon tracking system provides fine resolution on a transverse impact parameter of (with the beam spot size included). The combined track transverse momentum resolution of the whole tracking system is .
This analysis relies on a three-level trigger used for the online event selection to collect large data samples of multibody hadronic decays of -flavor states. We refer to this as the displaced two-track trigger. The trigger requires two tracks in the COT with for each track [14]. A further requirement that the impact parameter of each track lie in the range makes an effective selection of long-lived -flavor particles [15]. Finally, the distance in the transverse plane between the beam axis and the intersection point of the two tracks projected onto their total transverse momentum is required to be greater than .
Using the dataset collected with the displaced two-track trigger, we reconstruct the candidate states in the exclusive strong decay followed by the weak decays and [16]. The analysis of the mass distributions is performed using the value, where is the reconstructed mass and is the known charged pion mass. The mass resolution of the signal and most of the systematic uncertainties cancel in the mass difference spectrum. We search for narrow structures in the value spectrum within the range of motivated by the theoretical estimates [8, 9, 10].
The analysis begins with reconstruction of the decay by fitting three tracks to a common vertex. Standard quality requirements are applied to each track, and only tracks with are used. All tracks are refit using pion, kaon and proton mass hypotheses to properly correct for the differences in multiple scattering and ionization energy loss. No particle identification is used in this analysis. The invariant mass of the candidate is required to be within of the world-average mass [5]. The momentum vector of the candidate is then extrapolated to intersect with a fourth track that is assumed to be a pion, to form the candidate. The vertex is subjected to a three-dimensional kinematic fit with the candidate mass constrained to its world-average value [5]. The probability of the constrained vertex fit must exceed [2]. The proton from the candidate is required to have to contribute to the trigger decision. The momentum criterion for the from the has been optimized by maximizing the score function , where is the number of signal events obtained from the fit of the invariant mass experimental spectrum and is the number of events in the sideband region, , of the value experimental spectrum. The sideband region boundaries are motivated by the signal predictions in [8, 9, 10]. The sideband spectrum is parametrized by a second order Chebyshev polynomial. The requirement of corresponds to the maximum of the score function. The momentum criteria both for proton and candidates favor these particles to be the two contributing to the displaced two-track trigger decision. To keep the slow pions of decaying within the kinematic acceptance of the CDF track reconstruction, the candidate must have greater than . This corresponds to the maximum of the score function , where is the signal reconstructed in the MC simulation and is the number of events in the previously defined sideband region of the value spectrum.
To suppress prompt backgrounds from the primary interactions, the decay vertex of the is required to be distinct from the primary vertex. To achieve this, cuts on the proper lifetime, , and its significance, , are applied. The first requirement confirms the trigger while the second one is set using MC simulation data to be fully efficient for the signal. We define the proper lifetime as where is the world-average mass of the [5]. The primary vertex is determined event-by-event when computing this vertex displacement. We require the vertex to be associated with a decay by applying a cut on the proper lifetime , where the corresponding quantity is calculated with respect to the vertex. The requirement reduces contributions from baryons directly produced in interactions and from the random combination of tracks faking candidates (which may have negative values). To reduce combinatorial background and contributions from partially reconstructed decays, we require candidates to point to the primary vertex by requiring the impact parameter not to exceed . Both latter cuts [2] are fully efficient for the signal.
Figure 1 shows a prominent signal in the invariant mass distribution, reconstructed with the criteria explained above. The fit model describing the invariant mass distribution comprises the Gaussian signal on top of a background shaped by several contributions [1, 2, 17]. A binned maximum-likelihood fit finds a signal of approximately candidates at the expected mass, with a signal to background ratio around .
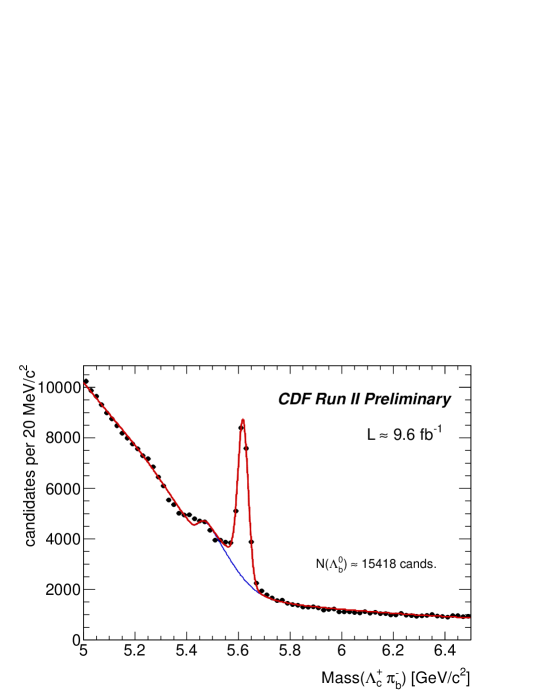
To reconstruct the candidates, each candidate with an invariant mass within a region of is combined with a pair of oppositely charged tracks each assigned to the pion hypothesis. The mass region corresponds to an area of around the signal peak as determined by a fit to the spectrum of Fig. 1. To increase the efficiency for reconstructing decays near the kinematic threshold, the quality criteria applied to soft pion tracks are loosened in comparison with those applied to tracks used for the candidates. The basic COT and SVX II hit requirements are imposed on the tracks, and only tracks with having hits in both trackers and with a valid track fit and error matrix are accepted.
To reduce the background level, a kinematic fit is applied to the resulting combinations of candidates to constrain them to originate from a common point. The candidates are not constrained to a nominal mass in this fit. Furthermore, since the bottom baryon resonance originates and decays at the primary vertex, the soft pion tracks are required to originate from the primary vertex by requiring an impact parameter significance smaller than [1, 2]. This requirement corresponds to the maximal value of the score function .
The experimental value distribution is shown in Fig. 2. A narrow structure at is clearly seen. The projection of the corresponding unbinned likelihood fit is superimposed on the graph. The fit function includes a single narrow signal structure on top of a smooth background. The signal is parametrized by two Gaussians with the same mean value and with their widths and weights set according to Monte Carlo simulation studies. The background is described by a second order Chebyshev polynomial. The parameters of interest are the position of the signal and its yield. The negative logarithm of the extended likelihood function is minimized over the unbinned set of values observed for the candidates in our sample. The value spectrum is fit over the range . The fit finds signal candidates at .
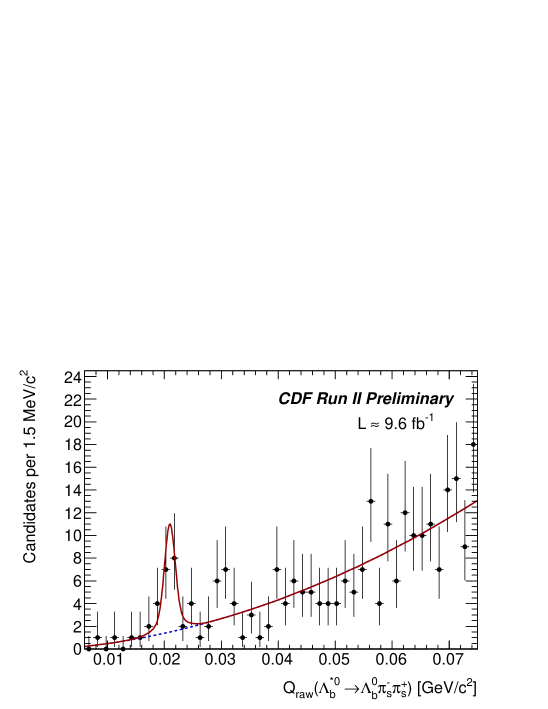
The significance of the signal is determined using a -likelihood ratio statistic [18, 19], We define hypothesis corresponding to the presence of a signal on top of the background. The statistic is used as a variable with two degrees of freedom to derive values for observing a deviation as large as is in our data or larger, assuming is true. Therefore our baseline signal fit has a local significance of . The significance for a search window of has been determined by running statistical pseudo-experiments in which the hypothesis is generated but fit with the hypothesis and the corresponding -likelihood ratio statistic is calculated for each trial. The fraction of the generated trials having above the value returned by the fits of the experimental data determines the significance. For this case the significance has been found to be .
The systematic uncertainties on the mass considered in our analysis derive from the CDF tracker momentum scale (the dominant contribution); the resolution model described by the sum of two Gaussians; and the choice of a background model. The uncertainties on the measured mass differences due to the momentum scale of the low- tracks are estimated from the large calibration sample of events. The scale factor to be applied to the soft pion transverse momentum is found to correct the difference between the experimental value in decays and its world-average value [5]. The same factor applied for the soft pions in a full Monte-Carlo simulation of decays yields a value change of . We take the full value of the change as the uncertainty and adjust by the value found by the fit of the experimental spectrum. The systematic uncertainties are summarized in Table 1.
| Source | Value, | Comment |
|---|---|---|
| Momentum scale | Propagated from high | |
| statistics calibration | ||
| sample; | ||
| of the found | ||
| adjustment value. | ||
| Signal model | MC underestimates | |
| the resolution; choice of | ||
| the model’s parameters | ||
| Background model | Consider 3-rd, 4-th power | |
| polynomials | ||
| Total: | Added in quadrature |
The analysis results are arranged in Table 2. From the measured value we extract the absolute masses using the known value of the mass and the CDF mass measurement, , as obtained in an independent sample [20]. The mass statistical and systematic uncertainties contribute to the systematic uncertainty on the absolute mass. The result is closest to the calculation in [10]. Our result is consistent with the state recently observed by the LHCb Collaboration [22]. The lower production rate of bottom hadrons at the Tevatron combined with the low efficiency for soft pion tracks make this sample insensitive to the presence of the state observed by LHCb.
| Value | |
|---|---|
In conclusion, we have conducted a search for the resonance state in its value spectrum, and a narrow structure has been identified. The narrow structure has a local significance of and is interpreted as evidence for a signal. The significance of the signal for the search region of is . Our result confirms the state observed by the LHCb Collaboration [22].
Acknowledgments.
The author is grateful to his colleagues from the CDF B-Physics Working Group for useful suggestions and comments made during preparation of this talk.References
- [1] T. Aaltonen et al. (CDF Collaboration), Phys. Rev. Lett. 99, 202001 (2007).
- [2] T. Aaltonen et al. (CDF Collaboration), Phys. Rev. D 85, 092011 (2012).
- [3] M. Neubert, Phys. Rept. 245, 259 (1994); A. V. Manohar and M. B. Wise, Camb. Monogr. Part. Phys. Nucl. Phys. Cosmol. 10, 1 (2000).
- [4] N. Isgur and M. B. Wise, Phys. Lett. B 232, 113 (1989); Ibid. 237, 527 (1990); N. Isgur and M. B. Wise, Phys. Rev. D 42, 2388 (1990).
- [5] J. Beringer et al. (Particle Data Group Collaboration), Phys. Rev. D 86, 010001 (2012).
- [6] J. G. Korner, M. Kramer, and D. Pirjol, Prog. Part. Nucl. Phys. 33, 787 (1994).
- [7] Throughout the text the notation represents the or the state.
- [8] M. Karliner, B. Keren-Zur, H. J. Lipkin, and J. L. Rosner, arXiv:0708.4027 [hep-ph]; M. Karliner, B. Keren-Zur, H. J. Lipkin, and J. L. Rosner, Annals Phys. 324, 2 (2009); M. Karliner, Nucl. Phys. Proc. Suppl. 187, 21 (2009).
- [9] D. Ebert, R. N. Faustov, and V. O. Galkin, Phys. Rev. D 72, 034026 (2005); D. Ebert, R. N. Faustov, and V. O. Galkin, Phys. Lett. B 659, 612 (2008); D. Ebert, R. N. Faustov, and V. O. Galkin, Phys. Atom. Nucl. 72, 178 (2009).
- [10] Z. Aziza Baccouche, C. -K. Chow, T. D. Cohen and B. A. Gelman, Phys. Lett. B 514, 346 (2001); Z. Aziza Baccouche, C. -K. Chow, T. D. Cohen and B. A. Gelman, Nucl. Phys. A 696, 638 (2001).
- [11] D. Acosta et al. (CDF Collaboration), Phys. Rev. D 71, 032001 (2005).
- [12] A. Sill et al., Nucl. Instrum. Meth. A 447, 1 (2000); A. A. Affolder et al. (CDF Collaboration), Nucl. Instrum. Meth. A 453, 84-88 (2000); S. Nahn (on behalf of the CDF Collaboration), Nucl. Instrum. Methods A 511, 20 (2003); C. S. Hill (on behalf of the CDF Collaboration), Nucl. Instrum. Methods A 530, 1 (2004).
- [13] A. A. Affolder et al. (CDF Collaboration), Nucl. Instrum. Methods A 526, 249 (2004).
- [14] E. J. Thomson et al., IEEE Trans. Nucl. Sci. 49, 1063 (2002).
- [15] B. Ashmanskas et al. (CDF Collaboration), Nucl. Instrum. Meth. A 518, 532-536 (2004); L. Ristori and G. Punzi, Ann. Rev. Nucl. Part. Sci. 60, 595-614 (2010).
- [16] Low momentum pions produced near the kinematic threshold in strong decays of the are indicated as . designates a pion produced in the weak decay of the . Unless otherwise stated all references to a specific charge combination imply the charge conjugate combination as well. Specifically, , , , and .
- [17] A. Abulencia et al. (CDF Collaboration), Phys. Rev. Lett. 98, 122002 (2007).
- [18] S.S. Wilks, Ann. Math. Statist. 9 (1938) 60-2.
- [19] R. Royall, J. Amer. Statist. Assoc. 95, 760 (2000).
- [20] D. Acosta et al. (CDF Collaboration), Phys. Rev. Lett. 96, 202001 (2006).
- [21] T. Aaltonen et al. (CDF Collaboration), Phys. Rev. Lett. 103, 152001 (2009).
- [22] R. Aaij et al. (LHCb Collaboration), Phys. Rev. Lett. 109, 172003 (2012).