Search for Pure Leptonic B Decays at ATLAS and CMS
Bakul Gaur on behalf of the ATLAS and CMS Collaborations111This work was supported in part by BMBF.
Naturwissenschaftlich-Technische Fakultät - Department für Physik
Universität Siegen
D-57068 Siegen, GERMANY
Proceedings of CKM 2012, the International Workshop on the CKM Unitarity Triangle, University of Cincinnati, USA, 28 September - 2 October 2012
1 Introduction
In the Standard Model (SM) the decays are mediated by flavour changing neutral currents (FCNC). They are CKM suppressed, and happen via higher-order electroweak Feynman diagrams. Their decay rates, additionally, suffer helicity suppression. For the channel a rate of has been predicted [1, 2], and for the prediction is [1]. In Standard Model extensions these rates may be enhanced. Any deviation from the SM predictions will indicate new physics. These channels are important probes for physics beyond the SM.
2 Analysis Strategy
The branching fractions can be measured relative to a well measured reference channel to minimize uncertainties, e.g. detector acceptance uncertainties, while keeping the analysis independent of luminosity variations and production cross-section uncertainties. For this purpose both ATLAS and CMS use as the reference channel, because of large available statistics, and similar (di-muon) final states. To keep systematic uncertainties low, similar selection cuts are applied to both the signal and the reference channel events.
The branching fractions are computed as
| (1) |
where and are the number of observed signal and reference channel events, respectively. The factor is to correct for the detector acceptances () and event selection efficiencies () estimated for the two channels using Monte Carlo events (MC). The ratios are the ratios of the -quark hadronization probabilities to correct for the different production rates of and . The reference channel branching fraction , and the ratio are taken from other measurements [5, 6]. The ratio is taken to be 1 [7].
3 ATLAS Analysis
The ATLAS analysis expresses the branching fraction as a product of the observed number of signal events and a Single Event Sensitivity (SES):
| (2) |
For a single observed signal event, the branching fraction would be equal to the SES.
The analysis uses collision data at TeV recorded by the ATLAS detector in the period April-August 2011. This corresponds to an integrated luminosity of 2.4 fb-1. The analysis is robust against pileup effects. The details of the analysis can be found in reference [8].
A topological trigger selects di-muon candidates above a transverse momentum () threshold of 4 GeV. The signal channel events in the invariant mass range MeV are hidden in the analysis (’blind’ analysis) until event selection cuts are finalized. The events in the side bands ( MeV, MeV) are split into two sets. To avoid statistical biases, one set is used for cut optimization (odd numbered events in data), and the other for estimation of the background under the signal (even numbered events in data).
The event selection cuts are optimized using a multivariate technique. The method uses Boosted Decision Trees (BDT) with 14 input variables to compute an event classifier, . The signal search window, , in the invariant mass spectrum is optimized together with the BDT classifier . The method determines the optimal and to get the maximum value for the estimator:
| (3) |
where is the signal selection efficiency and is the continuum background interpolated from the side bands (two times the number of odd events).
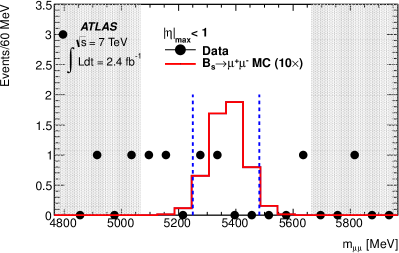
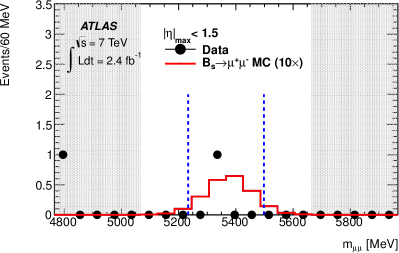
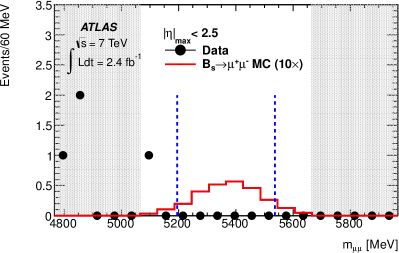
The events are split into three mass resolution categories distinguished by the maximum pseudorapidity () of the muon tracks. The and are separately optimized for each category. The same classifier cut is used to compute the acceptance and efficiency ratio from the MC, and the reference channel yield, , in the three categories. The yield is determined by fitting the invariant mass spectrum, and computing the in a band MeV. The SES is thus computed for the three categories using Equations (1) and (2). In the di-muon invariant mass spectrum there is an expected background due hadronic decays, where hadrons are misidentified as muons. The background is the dominating resonant background. It is estimated from the MC.
3.1 Results
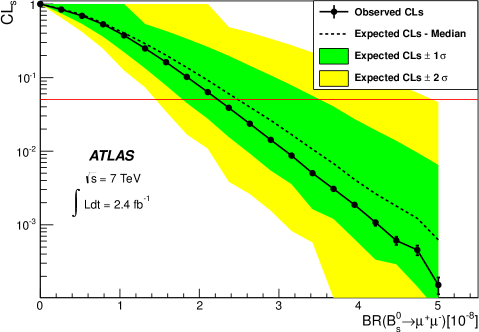
The upper limit on the branching fraction is computed using the CLs method [9]. A likelihood expression combines the SES computed in the three mass resolution categories, its uncertainties, and the expected resonant () and non-resonant background contributions to the invariant mass spectrum [8]. An expected limit of on is obtained. The data in the blinded region is analysed, and the signal yield is measured in the optimized search window for the three mass resolution categories (see Figure 1). The observed upper limit is at 95% (90%) confidence level (CL). The observed limit is comparable with the expected limit (Figure 2).
4 CMS Analysis
In this section the key features in the CMS analysis different from the ATLAS one are presented.
The CMS analysis uses 5 fb-1 of collisions at TeV recorded by the CMS detector in the year 2011. In this analysis a cut-and-count approach is taken. The optimization of the selection cuts is performed using the signal MC and all the side-band ( MeV, MeV) events in the data. The events inside the signal region (in data) are kept blinded until the cuts are established. A random-grid search method is used to tune the cuts on 11 analysis variables to get the best upper limit [11]. A different set of selection cuts is used for events in the endcap region of the detector than in the barrel region.
The analysis shows good agreement between the reconstructed distributions in data and MC, and it is not sensitive to pileup events.
4.1 Results
The branching fractions for both and decays are measured simultaneously using two asymmetric search windows around the and masses. Figure 3 shows the di-muon invariant mass spectrum after the unblinding.
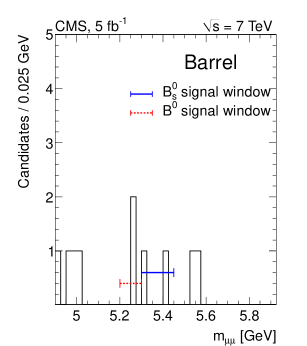
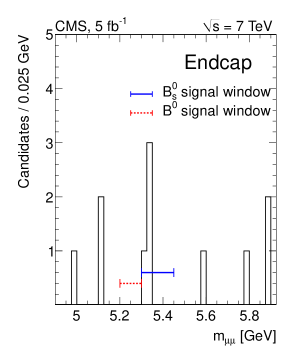
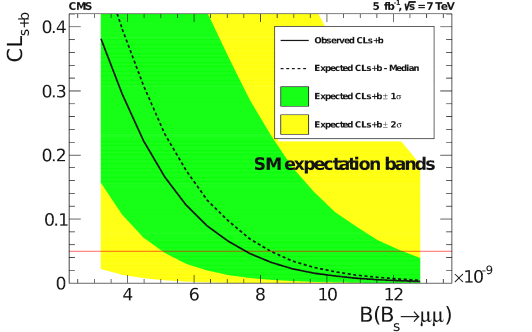
The limit extraction takes into account the expected combinatorial and the resonant background contributions (estimated using MC), and also the number of expected signal events assuming the SM branching fractions. The resonant background includes decays, where hadrons are misidentified as muons, and rare semileptonic decays. The limits are computed using the CLs method [9, 10]. The expected upper limits for () are () at 95% CL [11]. The upper limit for is at 95% (90%) CL. Figure 4 shows the dependence of CLs+b on the branching fraction.
5 Summary
The and are important decay channels to search for new physics. The latest limits on their branching fractions were set by the LHC experiments. These are summarized in Table 1. The best upper limit, , is the combined result [13] of the measurements performed by ATLAS, CMS and LHCb experiments. It is close to the SM expectation, . The ATLAS and CMS collaborations are working on extending their analyses to the full available statistics collected from the LHC.
References
- [1] A. J. Buras, J. Girrbach, D. Guadagnoli and G. Isidori, “On the Standard Model prediction for BR(),” arXiv:1208.0934 [hep-ph].
- [2] K. De Bruyn, R. Fleischer, R. Knegjens, P. Koppenburg, M. Merk, A. Pellegrino and N. Tuning, “Probing New Physics via the Effective Lifetime,” Phys. Rev. Lett. 109 (2012) 041801 [arXiv:1204.1737 [hep-ph]].
- [3] ATLAS Collaboration, “The ATLAS Experiment at the CERN Large Hadron Collider,” JINST 3 (2008) S08003.
- [4] CMS Collaboration, “The CMS experiment at the CERN LHC,” JINST 3 (2008) S08004.
- [5] K. Nakamura et al. [Particle Data Group Collaboration], “Review of particle physics,” J. Phys. G 37 (2010) 075021.
- [6] LHCb Collaboration, “Measurement of -hadron production fractions in collisions,” Phys. Rev. D 85 (2012) 032008 [arXiv:1111.2357 [hep-ex]].
- [7] D. Asner et al. [Heavy Flavor Averaging Group Collaboration], “Averages of b-hadron, c-hadron, and -lepton Properties,” arXiv:1010.1589 [hep-ex].
- [8] ATLAS Collaboration, “Search for the decay with the ATLAS detector,” Phys. Lett. B 713 (2012) 387 [arXiv:1204.0735 [hep-ex]].
- [9] A. L. Read, “Presentation of search results: The CL(s) technique,” J. Phys. G 28 (2002) 2693.
- [10] T. Junk, “Confidence level computation for combining searches with small statistics,” Nucl. Instrum. Meth. A 434 (1999) 435 [hep-ex/9902006].
- [11] CMS Collaboration, “Search for and decays,” JHEP 1204 (2012) 033 [arXiv:1203.3976 [hep-ex]].
- [12] LHCb Collaboration, “Strong constraints on the rare decays and ,” Phys. Rev. Lett. 108 (2012) 231801 [arXiv:1203.4493 [hep-ex]].
- [13] “Search for the rare decays and to dimuons at the LHC with the ATLAS, CMS and LHCb experiments,” ATLAS-CONF-2012-061, CMS-PAS-BPH-12-009, LHCb-CONF-2012-017, http://cdsweb.cern.ch/record/1456262.