Low-Ionization Outflows in High Eddington Ratio Quasars
Abstract
The broad Mgii2800 doublet has been much studied in connection with its potentially important role as a virial estimator of black hole mass in high redshift quasars. An important task is therefore identification of any line components likely related to broadening by non-virial motions. High s/n median composite spectra (binned in the “4D eigenvector 1” context of Sulentic et al. 2007) were constructed for the brightest 680 SDSS DR7 quasars in the range where both Mgii2800 and H are recorded in the same spectra. Composite spectra representing 90% of the quasars confirm previous findings that FWHM(Mgii2800) is about 20% narrower than FWHM(H). The situation is clearly different for the most extreme (Population A) sources which are the highest Eddington radiators in the sample. In the median spectra of these sources FWHM Mgii2800 is equal to or greater than FWHM(H) and shows a significant blueshift relative to H. We interpret the Mgii2800 blueshift as the signature of a radiation-driven wind or outflow in the highest accreting quasars. In this interpretation the Mgii2800 line width – affected by blueshifted emission – is unsuitable for virial mass estimation in 10% of quasars.
1 Introduction
Estimation of black hole mass () and Eddington ratio () for quasars is of great interest both to researchers working on models of the broad line region (BLR) structure and to cosmologists. Therefore we need a large number of accurate as possible estimates over the widest possible range of redshift, source luminosity and line/continuum properties. FWHM(H) is the principal virial estimator at low redshifts. While H can be followed into the infrared (out to ) at least one additional line is needed to provide complementary estimates over the full redshift range where quasars are observed. Mgii2800 is the best candidate since it is a low-ionization line and avoids some of the difficulties associated with Civ1549 (e.g. Netzer et al., 2007; Sulentic et al., 2007; Marziani & Sulentic, 2012; Trakhtenbrot & Netzer, 2012; Denney, 2012).
The advent of the SDSS database makes possible a direct calibration of Mgii2800 using sources where both Mgii2800 and H appear in the same SDSS spectra. Only high s/n composite spectra can provide an ideal vehicle for such comparisons. In addition one has to consider that source diversity found within the context of a formalism like 4D Eigenvector 1 (4DE1 Sulentic et al., 2000, 2007; Marziani et al., 2010) is large and likely driven by Eddington ratio (e.g. Boroson & Green, 1992; Marziani et al., 2001; Boroson, 2002; Grupe, 2004; Kruczek et al., 2011; Tang et al., 2012). The 4DE1 allows to discriminate sources whole emission line profiles and whose spectrophotometric properties are strikingly different. A notable empirically-motivated boundary at low- and moderate luminosity is set by FWHM(H) 4000 km s-1. Sources narrower than this limit show H profiles that are well fit by a Lorentzian function, while broader sources show prominent redward asymmetries in their H profiles (e.g. Véron-Cetty et al., 2001; Marziani et al., 2003b). Sources with FWHM(H) 4000 km s-1 include Narrow Line Seyfert 1s (NLSy1s) by definition and are characterized by a significant high-ionization outflow, revealed by a Civ1549 blueshift with respect to rest frame or to broad low-ionization lines (e.g. Gaskell, 1982; Tytler & Fan, 1992; Marziani et al., 1996; Sulentic et al., 2007; Richards et al., 2011). The outflow has been ascribed to a radiative or magnetically driven wind (e.g. Murray & Chiang, 1997; Bottorff et al., 1997; Proga et al., 2000). Therefore it is important to at least distinguish between sources that appear to be wind- or disk-dominated (Richards et al., 2011) applying the limit at FWHM(H) = 4000 km s-1 that separates Population A and B sources (Sulentic et al. 2000, c.f. Collin et al. 2006).
A finer subdivision is still needed even with the restriction to Population A. Pop. A sources span a relatively large range in Eddington ratio, 0.5, that likely involves not only the highest Eddington radiators. We apply the spectral classification of Sulentic et al. (2002) that divides the plane FWHM(H)– into bins of = 0.5 and FWHM(H) = 4000 km s-1, where is computed as the equivalent width (or intensity) ratio of the Feii4570 blend and broad H (see their Fig. 1). Extreme Pop. A (A3 and A4) sources with 1 are characterized by the strongest high-ionization outflow, with the largest Civ1549 blueshifts (Marziani et al., 2006; Sulentic et al., 2007), and are believed to be the highest Eddington ratio sources. A large low- sample covering the H and Mgii2800 emission lines is defined (§2). We point out intriguing changes of the H and Mgii2800 line profile occurring in bins A3 and A4 (§3) and discuss first order considerations about the physics involved (§4).
2 Sample Selection and Construction of Composite Spectra
We searched SDSS-DR7 for sources catalogued as Type 1 AGN (quasars) in the redshift range 0.4 – 0.75 and with magnitudes brighter than 18.5 in the , or bands, as well as the Zhou et al. (2006) catalog. The resultant sample consisted of 716 quasars reduced to 680 (all of Pop. B: 369 sources; A1: 97, A2: 156, A3: 43, A4:15) by discarding very noisy spectra and some sources with unusually red colors. Broad Absorption Line (BAL) QSOs were excluded from the sample.
The rest frame was set by measuring the wavelengths of three of the most prominent narrow lines ([Oii]3727, H, and [Oiii]5007) when they were detected. Residual systematic wavelength shifts (Hewett & Wild, 2010) in addition to the SDSS-provided redshift values were computed taking an average of the three lines in each source spectrum, clipping individual measurements in cases of disagreement because of poor data or intrinsic blueshift of [Oiii]5007 (Hu et al., 2008). We used IRAF splot to estimate FWHM(H) in order to better separate sources into spectral bins following the prescription in Sulentic et al. (2002). Assignments for all bins were made by visual inspection of each spectrum and estimation of through ngaussfit. Median composites were constructed respectively for H and Mgii2800 after redshift correction and continuum normalization at 5050 Å and 3050 Å. The rest frame radial velocity of the composites (defined by the average of peak radial velocity of narrow [Oii]3727, H, H, H, and [Oiii]4959,5007) was found 10 km s-1 in A1 and A2, and 20 km s-1 in bin A3 and A4, with a rms value always less than 50 km s-1. A line can be considered unshifted with respect to rest frame if km s-1. The relative uncertainty of measurements for H and Mgii2800 peak velocities on the composite spectra is somewhat less and has been estimated by propagating 3 sources of error on: (1) zero-point; [Oii]3727 and H narrow component peak wavelengths measured in the four composites agree within rms 10 km s-1; (2) wavelength calibration, by measuring the dispersion in wavelength measurements of strong sky lines, typically km s-1. Systematic shifts are consistent with 0 ( 25 km s-1) for HgI 4359 and OH 8401 lines whose wavelengths correspond roughly to the wavelengths of the redshifted Mgii2800 doublet and H line, respectively; (3) peak line position determined by the multicomponent fit, as provided by the fitting program specfit (§3).
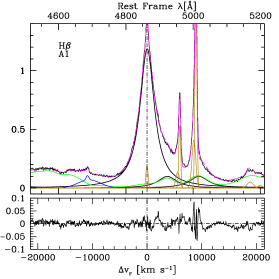
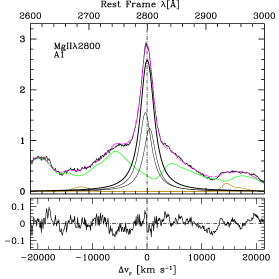
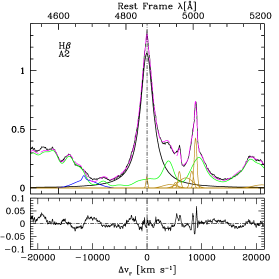
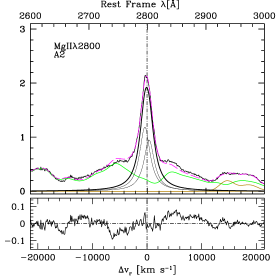
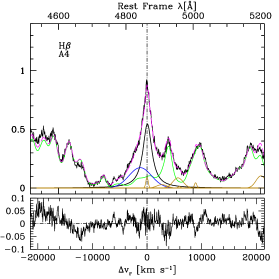
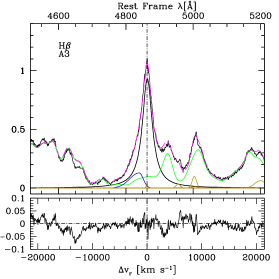
Interpretation of the H spectral range closely follows previous work (Boroson & Green, 1992; Marziani et al., 2003a, 2009). Along with continuum and Feii emission fit over the spectral range 4430 – 5510 Å, we will include possible contribution of He I lines at 4471 ad 5016 Å (that appear to be significant only for bin A1), Heii4686 and a contribution due to [Fe VII] and [N I] lines at 5150 – 5200 Å. The region around Mgii2800 has been studied by several authors since the mid-1980s (Wampler, 1985; Brotherton et al., 1994; Graham et al., 1996; Laor et al., 1997; Vestergaard & Wilkes, 2001). Emission blends near Mgii2800 are mainly due to Feii. We define a range for specfit analysis (2600–3050 Å) that is a compromise between proximity to the line and the necessity of having sufficient continuum coverage to properly map the broad FeII blends. We also include other known lines e.g. semi-forbidden Al II] 2669.95 and O III 2672.04. in the fits. Brühweiler & Verner (2008) provide FeiiUV emission templates computed from cloudy simulations and using an 830 level model of the Fe+ ion. Use of the Brühweiler & Verner (2008) FeiiUV template results in a systematic residual near 2950 Å (Figs. 1 and 2). The excess flux is probably due to the blend of He I2945 and Fei emission from a cluster of lines produced by transitions from the terms z5F and a to the ground state (a). Fei emission has been predicted by photoionization models (Sigut et al., 2004) and was suggested by previous observations (e.g., Kwan et al., 1995; Graham et al., 1996). The flux deficit is larger than the Fei predicted by photoionization models, at least by a factor of several with respect to a low-ionization, 3 times solar metallicity case (model u20h11 of Sigut et al., 2004). However, several lines associated to Fei multiplets 1 and 9 and opt 30 have been convincingly identified in a strong Feii emitter (Graham et al., 1996), and the emission of Fe I with respect to Fe II might increase with metallicity (Sigut et al., 2004). The issue of Fe I emission deserves further investigation not last because Fe I intensity is strongly dependent on the assumed Feii model at 2900 – 3000 Å. For the sake of present paper we checked that the peak shift of the Mgii2800 is basically unaffected even by strong changes in the assumed Fe I strength.
3 Results
3.1 Broad Line Profile Analysis
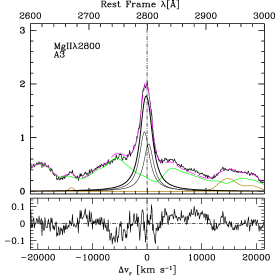
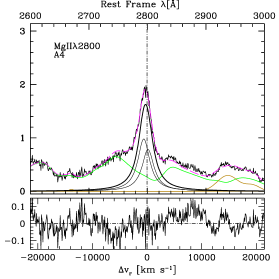
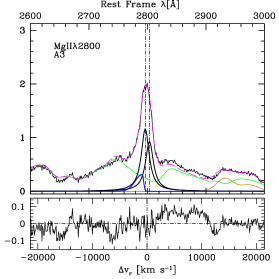
Composite spectra were analyzed using specfit with minimization techniques appropriate for non-linear multi-component fits (Kriss, 1994). The procedure allows for simultaneous continuum, Feii and narrow line fitting. Two FeiiUV emission templates were applied: the theoretical one by Brühweiler & Verner (2008), and an empirical template produced by Tsuzuki et al. (2006). Use of two independent templates was justified by possible effects that FeiiUV subtraction might have on the measurements of line shifts. Continuum subtracted composite spectra are shown in Fig. 1 for bins A1 and A2, and in Fig. 2 and Fig. 3 for bins A3 and A4. The Mgii2800 doublet was first modeled as two Lorentzian-like functions of same width and relative intensity ratio 1.25:1. This assumption is justified by the value of the prototypical A3 source I Zw1, and by the physical conditions within the BLR (Laor et al., 1997). It is possible that the lines become fully thermalized at the extreme optical depth of the low-ionization line (LIL) BLR, justifying the assumption of a 1:1 ratio. We have carried out several fits also for the 1:1 case but the results on line shifts and widths are very close to the 1.25:1 case and do not affect any of the conclusions discussed below.
Table 1 reports the results of the our multi-component analysis: intensity, shift uncertainty at 2 confidence level (estimated as described at the end of §2), and FWHM of the two line components used to model line profiles: the broad component (BC) and, when appropriate, a blueshifted component (blue). The radial velocity was measured with reference to the vacuum wavelength of the component, 2796.35 Å. Uncertainties in BC centroid shifts are significantly larger toward the line profile base than at peak, and are estimated to be 400 km s-1 for the centroid at 1/4 peak intensity. Columns BC and blue Int. report H and Mgii2800 line intensity normalized by continuum flux at 5050 Å. The normalization at 5050 Å ensures that the H value roughly corresponds to the line equivalent width, and that meaningful intensity ratios Mgii2800/H can be computed from the values reported in the Table. Note that Mgii2800 intensity values are for the doublet, while reported FWHMs are for an individual component. The formal uncertainty in FWHM measurements of H and Mgii2800 BC is, in absence of systematic effects, around 2% for spectral types A1 and A2, and 5% in all other cases. Shifts and width of the blue components are subject to considerable larger uncertainties since they are close to the much stronger BC. In addition their values depend on the line profile assumed for the fit. Formal uncertainty (i.e., without considering the possibility of different profile shapes) derived on the FWHM of the blue components is 10% in all cases.
Fits to H and Mgii2800 in A1 and A2 bins needed only symmetric, unshifted Lorentzian line components. The BC accounts for the entire H and Mgii2800 profiles in A1 and A2 sources where the ratio FWHM(Mgii2800) / FWHM(H) 0.75 – 0.80 (Tab. 1). This FWHM ratio also holds for Pop. B sources and, therefore, for 90% of quasars (Wang et al., 2009; Trakhtenbrot & Netzer, 2012, Sulentic et al. 2012, in preparation). The simplest interpretation is that the emissivity weighted distance of the Mgii2800 emitting gas is somewhat larger than that for H( 1.5 following the virial assumption, see also §4).
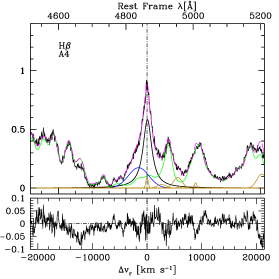
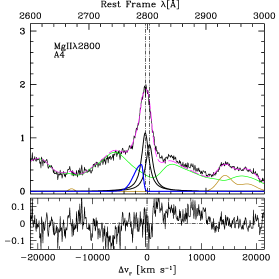
The H profiles in A3 and A4 bins also involve an (almost) unshifted, symmetric component (the broad component BC) with FWHM(H) 2000 km s-1 which we assume to be the virial broadening estimator. However, fits to the H profile for sources in A3 and A4 bins require an additional blueshifted (Column “blue” in Tab. 1) component in order to minimize residuals (e.g. Leighly, 2000; Leighly & Moore, 2004; Marziani et al., 2010; Wang et al., 2011). The “blue” component has been modeled first as a symmetric Gaussian, in line with past work. The right panels of Fig. 2 show that a good fit to the Mgii2800 profiles in A3 and A4 is possible using a shifted symmetric Lorentz function with a profile shift of a few hundred km s-1.
At a second stance a skewed Gaussian (Azzalini, 1985) has been considered for both H and Mgii2800 (Fig. 3). In this case, a two-component model is possible also for the spiky Mgii2800 profile. We assumed unshifted BC Mgii2800 emission with FWHM(Mgii2800) = 0.8 FWHM(H), plus an additional blueshifted component described by a skewed Gaussian as for H. The resulting Mgii2800 line decomposition is shown in the right panels of Fig. 3. Line parameters are reported in Tab. 1 (A3b and A4b).
3.2 A systematic Mgii2800 Blueshift
Bins A3 and A4 (10% of all quasars) behave differently than the wide majority of quasars since their FWHM(Mgii2800) H. The ratio FWHM(Mgii2800)/FWHM(H) is larger than unity in bin A4, with H and Mgii2800 showing the same width in bin A3 (lower panel of Fig. 5) where a peak blueshift is already highly significant. As mentioned, the Mgii2800 doublet appears blueshifted with respect to rest frame and H in spectral types A3 to A4 where H shows evidence for a blueshifted component (Fig. 2; see also Marziani et al. 2010). The Mgii2800 blueshift reaches 20% of the half line width in bin A4. In bin A3 and A4 the core of the Mgii2800 profile is narrow enough to appear visually displaced relative to the rest frame (Fig. 2). Even measuring the position of the broad-line core (without any correction because of contaminant lines) with splot we obtain consistent values. The effect is too large to be ascribed to sources of uncertainty on rest frame, and it is even more significant if relative line shifts are considered. As mentioned, we repeated the fits for all bins assuming that the doublet ratio is 1.0:1.0. This results in a slightly larger Mgii2800 blueshift. To further test the reality of the shift, we considered that the maximum doublet ratio for expected physical conditions in the BLR is 1.5:1.0. We constructed noiseless mock profiles to derive a peak wavelength in case Mgii2800 treated as single line, for doublet ratios 1.5,1.25,1 to 1. The effective wavelength of the doublet is 2799.1, 2799.4, 2800.1 for the three ratios respectively. Also in the case 1.5:1.0, the peak shift will remain significant.
The Mgii2800 A3 and A4 fits with a shifted symmetric function probably yield only a lower limit to the shift amplitude since, if a two component interpretation is correct, they include also unshifted emission line gas. Yet, these Mgii2800 fits are meaningful since they provide a robust measurement of a significant blueshift affecting the Mgii2800 line profile. Renouncing the symmetric Gaussian approximation for the blueshifted emission (in H) provides support for profile decomposition into two components (Fig. 3). With the exception of A4 H, both H and Mgii2800 median spectra show blue components with strong blueward asymmetry: the blue component profiles vaguely resemble the “trapezoidal” shape of the I Zw 1 Civ1549 profile (c.f. Leighly, 2000). The lower derived for Mgii2800 blueshifted component with respect to the one of H in bins A3 and A4 is consistent with the profile shape difference since H is more affected toward the line base, while Mgii2800 is affected to closer to the line core. Indeed, in all cases the shift of H is larger than the shift of Mgii2800. This result provides an important constrain on the emitting region structure (§4). Considering the strongly skewed blue component line profiles in A3 and A4, the estimated shifts reported in Tab.1 could be considered more properly as upper limits since symmetric blueshifted Gaussians would yield some emission under the BC with lower shift values.
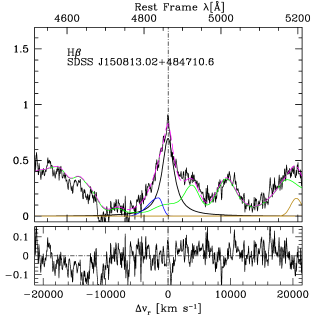
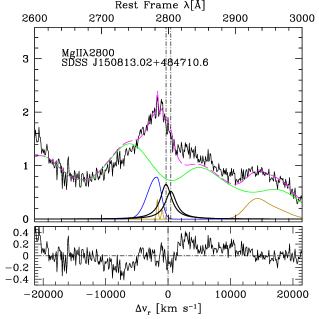
The most extreme source in our sample involves SDSS J150813.02+484710.6 whose Mgii2800 and H profiles are shown in Fig. 4. H shows a prominent blue asymmetry while Mgii2800 is fully blueshifted with width and shift amplitude similar to the ones measured for Civ1549 in extreme Pop. A sources such as I Zw 1. For this source we apply to the Mgii2800 profile only the profile model appropriate for Civ1549 of extreme Pop. A quasars i.e., an unshifted double Lorentzian + a blueshifted component approximated with a skewed Gaussian. While uncommon, other sources like J1508+48 have been found (see e.g., Q1258+1404; Barthel et al., 1990).
3.3 Major trends
3.3.1 Spectral types
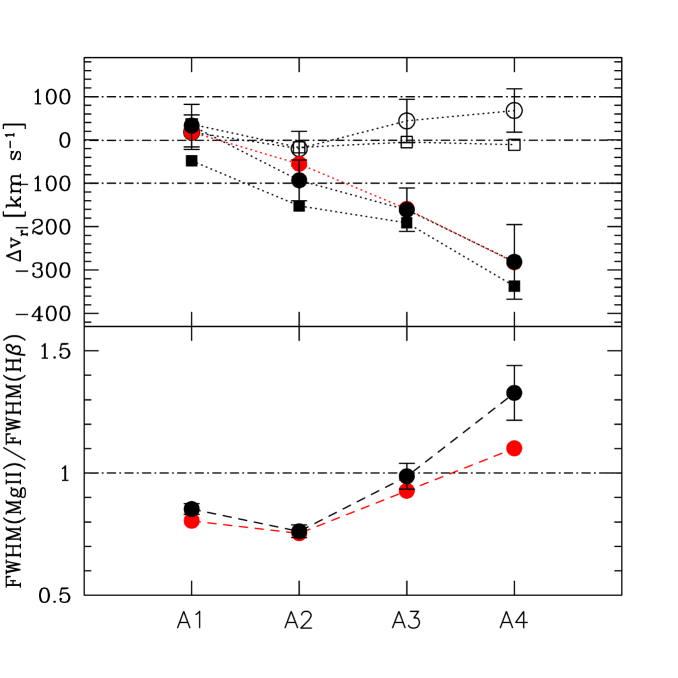
The upper panel of Fig. 5 shows radial velocity trends of broad component peaks as a function of spectral type, while the lower panel shows trends of the ratio FWHM(Mgii2800) / FWHM(H). Mgii2800 line shift measurements shown in Fig. 5 were carried out in three different ways: (1) using specfit with the theoretical FeiiUV template, (2) using specfit with the FeiiUV template from Tsuzuki et al. (2006) and (3) measuring the position of the broad-line core without any correction. The three sets of measures yield consistent trends. The interesting change in the lower panel of the figure involves a tendency for the FWHM ratio to increase first to parity in bin A3 and finally to FWHM(Mgii2800) FWHM(H) in bin A4 (cf. Trakhtenbrot & Netzer, 2012). This trend likely accounts for the large scatter (and convergence toward parity) of single-source measures in Figure 2 of Wang et al. 2009). The consistent behavior of both shift and FWHM strengthens our confidence that the trends are real. The increase in FWHM(Mgii2800) lends support to the hypothesis that an additional blueshifted component is emerging on the blue side of an unshifted BC with FWHM(Mgii2800) 0.8 FWHM(H). A symmetric blueshifted Lorentzian model is helpful for ascertaining the reality of the blueshifts but seems physically unrealistic. The blueshifts are more likely associated with a Mgii2800 component due to gas moving at larger velocity than the ones inferred from the global shift of the line core (Tab. 1).
3.3.2 Eddington ratio
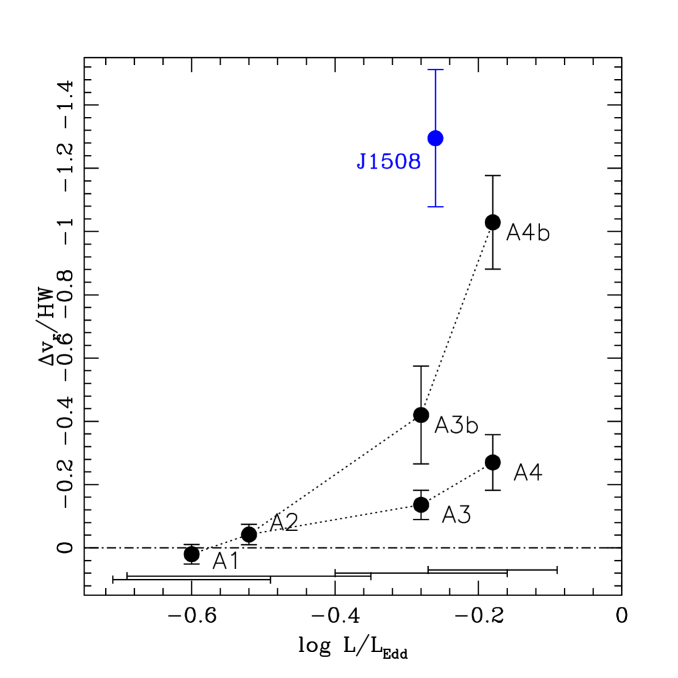
We estimated median values computing median 5100 Å luminosities from fluxes of all sources in each bin and with FWHM measures of the median composites following the prescription of Assef et al. (2011). A bolometric correction to the 5100 Å luminosities was applied following Nemmen & Brotherton (2010) in order to derive values. The semi inter-quartile range (SIQR) of has been estimated using the individual FWHM H measurements carried out for spectral bin assignment (§2). All bins show very similar median bolometric luminosities [ergs s-1]. Fig. 6 shows the peak shift of the Mgii2800 broad and blue components as a function of . Shift values have been normalized by the H half-width at half-maximum (HW) in order to provide an indicator of dynamical significance to the shifts. The peak Mgii2800 shift is consistent with zero for spectral types A1 and A2 but begins to appear at –0.5 at type A2 increasing to 0.2/0.3 of half width for A3 and A4. The shift amplitude is much larger when the blueshifted component is considered. If 0.8 HW can be considered as a rough estimator of the virial velocity of the Mgii2800 emitting gas then A4 and SDSS J1508+4847 show outflows close to escape velocity. The main difference between median A4 and the source SDSS J1508+4847 is related to the amount of outflowing gas: in A4 the blue component is contributing 1/7 of the total line emission while it exceeds 1/3 in SDSS J1508+4847.
4 Discussion
The Mgii2800 profile in median spectra is different from both Civ1549 and H. Comparison between the latter two lines yielded inferences about the BLR structure (Marziani et al., 1996). The Civ1549 blueshift in low sources is thought to be associated with a wind component whose prominence increases with along the 4D eigenvector 1 (4DE1) sequence. The Civ1549 profile in bins A2-A4 can be modeled as a combination of the H BC profile plus a fully blueshifted component that accounts for most of the flux. This basic scenario has been confirmed by recent work (see e.g. Richards et al. 2011; Wang et al. 2011). In the case of Mgii2800 we see a displacement that is also significant with 200 – 300 km s-1 if the shift is measured on the full profile. As pointed out, this is likely a lower limit. If the blue component is considered, the shift amplitude is much larger ( –1000 km s-1) but significantly lower in Mgii2800 than in H. We are considering median spectra so the profiles represent the median behavior of line profiles – in some sense equivalent to a single source rms profile. So we can ask: what is the typical relation between the blueshifted Civ1549 and H on the one hand and the blueshifted Mgii2800 emission on the other?
4.1 Mgii2800 blueshift: emission from a radiation-driven wind
The Mgii2800 blueshift is most straightforwardly interpreted as due to outflow motions of the line emitting gas with preferential obscuration of the receding part of the flow. The fact that large blue shifts are observed when is highest indicates a role of radiation force in acceleration of the gas. If we consider gravitation and ionizing radiation as the only forces (neglecting drag forces and pressure gradients) the radial acceleration can be written as , where is the fraction of bolometric luminosity absorbed, the column density and the Thompson scattering cross-section, and a constant term. If the first term in square brackets exceeds , the outflowing velocity field of the gas will follow the form , where is the launching radius of the wind, and the terminal velocity (). Outflows driven by line and/or ionizing photon pressure can accelerate the line-emitting gas to where is the Keplerian velocity at the launching radius of the wind (e.g. Laor & Brandt, 2002). In the case of outflows driven by ionizing radiation the force multiplier is expected to be: where 0.5 for Compton-thin gas optically thick to the ionizing continuum (Netzer & Marziani, 2010). can be in the case of line driven winds (Proga et al., 2000).
The largest Civ1549 blue shifts are observed in spectral types A3 and A4 (in A3, km s-1) where also the Mgii2800 shifts occur. It therefore seems unlikely that there is no connection between Civ1549 and Mgii2800: both lines may be emitted as part of the same flow. However, bulk emission are expected to occur at different distances and/or in different physical condition. In the framework of photoionization, Mgii2800 emission is associated with low-ionization and relatively large column density gas (Netzer, 1980; Korista et al., 1997). Within a gas slab or cloud, Mgii2800 is emitted mainly beyond the fully ionized zone of geometrical depth -1 (with being the ionization parameter) where all of the Civ1549 is emitted. The total column density needed for substantial Mgii2800 production is not well constrained at very low ionization, since the fully ionized zone is already a tiny fraction of the emitting gas slab if cm-2 and .
Since is proportional to both -1/2 and , Mgii2800 emission may occur at higher column density and/or larger distance than blueshifted Civ1549. A large is consistent with the overall symmetry of the Mgii2800 profile base (§3.2; Figs. 1, 2, 3). Reverberation mapping indicates that high ionization lines are emitted closer to the central continuum than low-ionization lines (e.g. Peterson & Wandel, 1999). It is possible to ascribe the blueshifted Mgii2800 emission entirely to a larger radial distance if Mgii2800 arises times more distant than Civ1549. On the other hand, if 1, . Restricting our considerations to order-of-magnitude estimates due to uncertain shift values, a reasonable increase in column density over the standard value cm-2 would also suffice to reduce the Mgii2800 shifts close to the observed values.
An assumption from the behavior of the FWHM ratio is that the Mgii2800 flows start close to where the bulk of the low-ionization lines (H in the present case) is emitted. The following considerations apply also if FWHM(Mgii2800)/FWHM(H) 0.8 implies 1.5 larger emissivity-weighted distance for Mgii2800 than for H. The distance from the continuum source of the emitting gas can be derived from the continuum luminosity at 5100 Å following Bentz et al. (2009): [cm] for spectral type A4. If = 12 [cm-3], the ionization parameter is . The Mgii2800 luminosity is then Mgii2800, where is the covering factor, the emerging line flux for unit surface, and the depth-averaged volume emissivity. cloudy (Ferland et al., 1998) simulations indicate that has a minimum value ergs s-1 cm-2 at = 12 if , 1023 cm-2 1025cm-2, . In these ranges depends slightly on and . The computed (Mgii2800) extrapolated to full continuum coverage is always larger than the observed (Mgii2800) (ergs s-1 for A4). This is the case if the geometry is assumed static and open or if a velocity field appropriate for a wind (i.e., with photon local escape probability following Sobolev’s approximation) is considered. The derived indicates partial covering of the continuum as in a wind or in an ensemble of outflowing clouds.
Resonant line acceleration is expected to contribute to the dynamics of the flow in the physical scenario outlined above. Circumstantial evidence in favor of line acceleration is provided by the difference between a resonance UV line (Mgii2800) and a non-resonance line (H). From the purely observational point of view, a line driven outflow would be convincingly demonstrated if the ionizing photon flux were found unable to drive the line emitting gas to the observed outflow velocity or, in the context of absorption lines, from “line locking” (e.g. Cottis et al., 2010). However, the ionizing photon flux appears to be sufficient to accelerate the gas to the observed Mgii2800 velocities and to escape velocity in A4 sources: for , , . If HW(H), km s-1. This value exceeds the peak velocity of the blue component in bin A3, and is in agreement with the ones measured in A4 and in SDSS J1508+4847. Resonant line acceleration might be needed if the gas has a large ( cm-2) or if the Mgii2800 emitting gas is shielded by part of the continuum.
4.2 Alternate interpretations
Both Mgii2800 and H line profile widths are probably modified by the viewing angle of the outflow/jet axis. Evidence exists that the line width of H is affected by line-of-sight orientation of the jet axis in radio-loud sources (Wills & Browne, 1986; Wills & Brotherton, 1995; Rokaki et al., 2003; Sulentic et al., 2003; Zamfir et al., 2008). An effect on FWHM of a factor 2 is likely between core and lobe-dominated sources. Orientation effects are also expected for radio-quiet quasars (e.g. Jarvis & McLure, 2006; Punsly & Zhang, 2010). Extreme and variable soft X-ray emission from some narrow line Seyfert 1s (Pop. A) sources has been interpreted as a signature of pole-on orientation (Sulentic et al., 2000, and references therein). Recent work confirms a dependence on orientation for H in radio-loud sources and further suggests a less-strong dependence for Mgii2800 (Runnoe et al., 2012). Following this line of reasoning the occurrence of blueshifts in bin A3/A4 might involve sources viewed at a favorable line-of-sight orientation. It is not clear whether the results of Runnoe et al. (2012) on different orientation sensitivity can be extended to Pop. A where radio-loud sources are almost absent in bins A2, A3 and A4. Even if the FWHM(H) change could be explained on the basis of an orientation effect, several line intensity ratios change very strongly going from A1 to A4 (e.g., Wills et al., 1999; Aoki & Yoshida, 1999; Sulentic et al., 2000; Bachev et al., 2004; Baldwin et al., 2004; Negrete et al., 2012; Shin et al., 2012): by definition, but also Ciii]1909/Siiii]1892, Aliii1860/Siiii]1892, Siiv1397+Oiv]1402/Civ1549. Emission line equivalent widths change as well. For instance, the EW of H BC shows a decrease from A1 to A4 by a factor 2 (Tab. 1), as found previously (e.g., Sulentic et al., 2000). The large difference in EW persists also if the flux of the blueshifted component is included. Line intensity ratios and line equivalent widths are most likely sensitive to density, ionization state and chemical composition of the gas along with ionizing continuum shape (ultimately thought to be governed by Eddington ratio). In this respect we note that the decrease of (Mgii2800) from 110 to 70 Å is also consistent with a study showing an anticorrelation between (Mgii2800) and (Dong et al., 2009). It is unclear how orientation might drive such changes. We are probably dealing with a restricted range of in each spectral bin “convolved” with the effect of orientation (Marziani et al., 2001). If a (rare) pole-on orientation favors the observation of large shifts then SDSS J1508+4847 might be an example of a pole-on source.
5 Conclusion
Mgii2800 should be used as a virial estimator with caution in high Eddington ratio sources. Under the simplest assumptions virial motion implies an unshifted and symmetric profile. A systematic line profile blueshift can be interpreted as the signature of emission from radiatively acceleration of gas motion therefore invalidating the virial broadening assumption for Mgii2800 in 20% of Pop. A sources (10% of all quasars). Conversely further work has shown that the majority of quasars show unshifted Mgii2800 profiles that are more symmetric than H (Sulentic et al. 2012 in preparation, and references therein). The width of Mgii2800 is probably a suitable virial broadening estimator for those sources.
| Sp. T. | H | Mgii2800 | |||||||||||||
|---|---|---|---|---|---|---|---|---|---|---|---|---|---|---|---|
| BC | blue | BC | blue | ||||||||||||
| Int.a | Shiftb | FWHMb | Int.a | Shiftb | FWHMb | Int.c | Shiftb | FWHMb | Int.c | Shiftb | FWHMb | ||||
| A1 | 96 | 2040 | 3180 | 0.0 | n.a. | n.a. | 111 | 3550 | 2710 | 0.0 | n.a. | n.a. | |||
| A2 | 85 | -2040 | 2900 | 0.0 | n.a. | n.a. | 73 | -7050 | 2320 | 0.0 | n.a. | n.a. | |||
| A3 | 45 | 4540 | 2190 | 12 | -1240230 | 4250 | 65 | -15050 | 2240 | 0.0 | n.a. | n.a. | |||
| A3b | 54 | 4540 | 2190 | 6.5 | -1420510 | 4100 | 54 | 0d | 1750e | 5.6 | -880170 | 3100 | |||
| A4 | 28 | 7050 | 1980 | 16 | -1240220 | 4870 | 68 | -26590 | 2650 | 0.0 | n.a. | n.a. | |||
| A4b | 29 | 7050 | 1940 | 13 | -1530200 | 4460 | 46 | 0d | 1585e | 10 | -1010130 | 3300 | |||
| J1508+48 | 32 | -5d | 2300 | 5.0 | -1540100 | 4000 | 37 | 0d | 2190 | 20 | -1490160 | 3500 | |||
-
a
Line intensity normalized to the continuum at 5050 Å. The value roughly corresponds to the rest-frame equivalent width in Å. For J1508+48 values are in units of 10-15ergs s-1 cm-2 Å-1.
-
b
In units of km s-1.
-
c
Line intensity normalized to the continuum at 5050 Å. The value can be used an estimate of the Mgii2800/H intensity ratio. For J1508+48 values are in units of 10-15 ergs s-1 cm-2 Å-1.
-
d
Imposed to be consistent with rest frame.
-
e
FWHM(Mgii2800) = 0.8 FWHM(H), for broad component.

References
- Aoki & Yoshida (1999) Aoki, K., & Yoshida, M. 1999, in Astronomical Society of the Pacific Conference Series, Vol. 162, Quasars and Cosmology, ed. G. Ferland & J. Baldwin, 385
- Assef et al. (2011) Assef, R. J., et al. 2011, ApJ, 742, 93
- Azzalini (1985) Azzalini, A. 1985, Scand. J. Statist., 12, 171
- Bachev et al. (2004) Bachev, R., Marziani, P., Sulentic, J. W., Zamanov, R., Calvani, M., & Dultzin-Hacyan, D. 2004, ApJ, 617, 171
- Baldwin et al. (2004) Baldwin, J. A., Ferland, G. J., Korista, K. T., Hamann, F., & LaCluyzé, A. 2004, ApJ, 615, 610
- Barthel et al. (1990) Barthel, P. D., Tytler, D. R., & Thomson, B. 1990, A&ApS, 82, 339
- Bentz et al. (2009) Bentz, M. C., Peterson, B. M., Pogge, R. W., & Vestergaard, M. 2009, ApJL, 694, L166
- Boroson (2002) Boroson, T. A. 2002, ApJ, 565, 78
- Boroson & Green (1992) Boroson, T. A., & Green, R. F. 1992, ApJS, 80, 109
- Bottorff et al. (1997) Bottorff, M., Korista, K. T., Shlosman, I., & Blandford, R. D. 1997, ApJ, 479, 200
- Brotherton et al. (1994) Brotherton, M. S., Wills, B. J., Steidel, C. C., & Sargent, W. L. W. 1994, ApJ, 423, 131
- Brühweiler & Verner (2008) Brühweiler, F., & Verner, E. 2008, ApJ, 675, 83
- Collin et al. (2006) Collin, S., Kawaguchi, T., Peterson, B. M., & Vestergaard, M. 2006, A&Ap, 456, 75
- Cottis et al. (2010) Cottis, C. E., Goad, M. R., Knigge, C., & Scaringi, S. 2010, MNRAS, 406, 2094
- Denney (2012) Denney, K. D. 2012, ApJ, 759, 44
- Dong et al. (2009) Dong, X.-B., Wang, T.-G., Wang, J.-G., Fan, X., Wang, H., Zhou, H., & Yuan, W. 2009, ApJ, 703, L1
- Ferland et al. (1998) Ferland, G. J., Korista, K. T., Verner, D. A., Ferguson, J. W., Kingdon, J. B., & Verner, E. M. 1998, PASP, 110, 761
- Gaskell (1982) Gaskell, C. M. 1982, ApJ, 263, 79
- Graham et al. (1996) Graham, M. J., Clowes, R. G., & Campusano, L. E. 1996, MNRAS, 279, 1349
- Grupe (2004) Grupe, D. 2004, AJ, 127, 1799
- Hewett & Wild (2010) Hewett, P. C., & Wild, V. 2010, MNRAS, 405, 2302
- Hu et al. (2008) Hu, C., Wang, J.-M., Ho, L. C., Chen, Y.-M., Zhang, H.-T., Bian, W.-H., & Xue, S.-J. 2008, ApJ, 687, 78
- Jarvis & McLure (2006) Jarvis, M. J., & McLure, R. J. 2006, MNRAS, 369, 182
- Korista et al. (1997) Korista, K., Baldwin, J., Ferland, G., & Verner, D. 1997, ApJS, 108, 401
- Kriss (1994) Kriss, G. 1994, Astronomical Data Analysis Software and Systems III, A.S.P. Conference Series, 61, 437
- Kruczek et al. (2011) Kruczek, N. E., et al. 2011, AJ, 142, 130
- Kwan et al. (1995) Kwan, J., Cheng, F.-Z., Fang, L.-Z., Zheng, W., & Ge, J. 1995, ApJ, 440, 628
- Laor & Brandt (2002) Laor, A., & Brandt, W. N. 2002, ApJ, 569, 641
- Laor et al. (1997) Laor, A., Jannuzi, B. T., Green, R. F., & Boroson, T. A. 1997, ApJ, 489, 656
- Leighly (2000) Leighly, K. M. 2000, NARev, 44, 395
- Leighly & Moore (2004) Leighly, K. M., & Moore, J. R. 2004, ApJ, 611, 107
- Marziani et al. (2006) Marziani, P., Dultzin-Hacyan, D., & Sulentic, J. W. 2006, Accretion onto Supermassive Black Holes in Quasars: Learning from Optical/UV Observations (New Developments in Black Hole Research), 123
- Marziani & Sulentic (2012) Marziani, P., & Sulentic, J. W. 2012, NARev, 56, 49
- Marziani et al. (1996) Marziani, P., Sulentic, J. W., Dultzin-Hacyan, D., Calvani, M., & Moles, M. 1996, ApJS, 104, 37
- Marziani et al. (2010) Marziani, P., Sulentic, J. W., Negrete, C. A., Dultzin, D., Zamfir, S., & Bachev, R. 2010, MNRAS, 409, 1033
- Marziani et al. (2009) Marziani, P., Sulentic, J. W., Stirpe, G. M., Zamfir, S., & Calvani, M. 2009, A&Ap, 495, 83
- Marziani et al. (2003a) Marziani, P., Sulentic, J. W., Zamanov, R., Calvani, M., Dultzin-Hacyan, D., Bachev, R., & Zwitter, T. 2003a, ApJS, 145, 199
- Marziani et al. (2001) Marziani, P., Sulentic, J. W., Zwitter, T., Dultzin-Hacyan, D., & Calvani, M. 2001, ApJ, 558, 553
- Marziani et al. (2003b) Marziani, P., Zamanov, R. K., Sulentic, J. W., & Calvani, M. 2003b, MNRAS, 345, 1133
- Murray & Chiang (1997) Murray, N., & Chiang, J. 1997, ApJ, 474, 91
- Negrete et al. (2012) Negrete, A., Dultzin, D., Marziani, P., & Sulentic, J. 2012, ApJ, 757, 62
- Nemmen & Brotherton (2010) Nemmen, R. S., & Brotherton, M. S. 2010, MNRAS, 408, 1598
- Netzer (1980) Netzer, H. 1980, ApJ, 236, 406
- Netzer et al. (2007) Netzer, H., Lira, P., Trakhtenbrot, B., Shemmer, O., & Cury, I. 2007, ApJ, 671, 1256
- Netzer & Marziani (2010) Netzer, H., & Marziani, P. 2010, ApJ, 724, 318
- Peterson & Wandel (1999) Peterson, B. M., & Wandel, A. 1999, ApJ, 521, L95
- Proga et al. (2000) Proga, D., Stone, J. M., & Kallman, T. R. 2000, ApJ, 543, 686
- Punsly & Zhang (2010) Punsly, B., & Zhang, S. 2010, ApJ, 725, 1928
- Richards et al. (2011) Richards, G. T., et al. 2011, AJ, 141, 167
- Rokaki et al. (2003) Rokaki, E., Lawrence, A., Economou, F., & Mastichiadis, A. 2003, MNRAS, 340, 1298
- Runnoe et al. (2012) Runnoe, J. C., Brotherton, M., Shang, Z., Wills, B., & DiPompeo, M. 2012, ArXiv e-prints
- Shin et al. (2012) Shin, J., Woo, J.-H., Nagao, T., & C., K. S. 2012, ApJ, in press
- Sigut et al. (2004) Sigut, T. A. A., Pradhan, A. K., & Nahar, S. N. 2004, ApJ, 611, 81
- Sulentic et al. (2007) Sulentic, J. W., Bachev, R., Marziani, P., Negrete, C. A., & Dultzin, D. 2007, ApJ, 666, 757
- Sulentic et al. (2000) Sulentic, J. W., Marziani, P., & Dultzin-Hacyan, D. 2000, ARA&A, 38, 521
- Sulentic et al. (2002) Sulentic, J. W., Marziani, P., Zamanov, R., Bachev, R., Calvani, M., & Dultzin-Hacyan, D. 2002, ApJL, 566, L71
- Sulentic et al. (2003) Sulentic, J. W., Zamfir, S., Marziani, P., Bachev, R., Calvani, M., & Dultzin-Hacyan, D. 2003, ApJL, 597, L17
- Tang et al. (2012) Tang, B., Shang, Z., Gu, Q., Brotherton, M. S., & Runnoe, J. C. 2012, ApJS, 201, 38
- Trakhtenbrot & Netzer (2012) Trakhtenbrot, B., & Netzer, H. 2012, ArXiv e-prints
- Tsuzuki et al. (2006) Tsuzuki, Y., Kawara, K., Yoshii, Y., Oyabu, S., Tanabé, T., & Matsuoka, Y. 2006, ApJ, 650, 57
- Tytler & Fan (1992) Tytler, D., & Fan, X.-M. 1992, ApJS, 79, 1
- Véron-Cetty et al. (2001) Véron-Cetty, M.-P., Véron, P., & Gonçalves, A. C. 2001, AAp, 372, 730
- Vestergaard & Wilkes (2001) Vestergaard, M., & Wilkes, B. J. 2001, ApJS, 134, 1
- Wampler (1985) Wampler, E. J. 1985, ApJ, 296, 416
- Wang et al. (2011) Wang, H., Wang, T., Zhou, H., Liu, B., Wang, J., Yuan, W., & Dong, X. 2011, ApJ, 738, 85
- Wang et al. (2009) Wang, J., et al. 2009, ApJ, 707, 1334
- Wills & Brotherton (1995) Wills, B. J., & Brotherton, M. S. 1995, ApJ, 448, L81
- Wills & Browne (1986) Wills, B. J., & Browne, I. W. A. 1986, ApJ, 302, 56
- Wills et al. (1999) Wills, B. J., Laor, A., Brotherton, M. S., Wills, D., Wilkes, B. J., Ferland, G. J., & Shang, Z. 1999, ApJ, 515, L53
- Zamfir et al. (2008) Zamfir, S., Sulentic, J. W., & Marziani, P. 2008, MNRAS, 387, 856
- Zhou et al. (2006) Zhou, H., Wang, T., Yuan, W., Lu, H., Dong, X., Wang, J., & Lu, Y. 2006, ApJS, 166, 128