MuLan Measurement of the Positive Muon Lifetime and Determination of the Fermi Constant
Proceedings of CKM 2012, the 7th International Workshop
on the CKM Unitarity
Triangle, University of Cincinnati, USA,
28 September - 2 October 2012
Tim Gorringe for the MuLan Collaboration,
Department of Physics and Astronomy, University of Kentucky,
Lexington, KY, 40506, USA
Abstract
We report results from the MuLan measurement of the positive muon lifetime. The experiment was conducted at the Paul Scherrer Institute using a time-structured surface muon beam and a segmented plastic scintillator array. Two different in-vacuum muon stopping targets were used: a ferromagnetic foil with a large internal magnetic field and a quartz crystal in a moderate external magnetic field. From a total of decays, we obtained the muon lifetime ps (1.0 ppm) and Fermi constant GeV-2 (0.5 ppm).
The Fermi constant is best determined by measurement of the positive muon lifetime . Following work by van Ritbergen and Stuart [1] and Pak and Czarnecki [2]—that reduced the theoretical uncertainty in the relation between the muon lifetime and the Fermi constant to 0.14 pm—two new experiments have been performed to measure [3, 4]. Herein we report the results from the part-per-million measurement of the positive muon lifetime by the MuLan Collaboration.
1 Experimental setup
The experiment was conducted at the Paul Scherrer Institute using a nearly 100% longitudinally polarized, 29 MeV/c, beam from the E3 secondary beamline at the 590 MeV proton cyclotron. Incoming muons were stopped in solid targets and outgoing positrons were detected in a finely segmented, fast timing, scintillator array. The photomultiplier signals from scintillator detectors were recorded by 450 MHz sampling-rate, 8-bit resolution, waveform digitizers and read out by a high-speed data acquisition.
One important feature of the experiment was the application of a time structure on the muon beam. The time structure consisted of a 5 s-long, beam-on “accumulation period” followed by a 22 s-long, beam-off “measurement period”. The structure was imposed on the continuous beam using a custom-built, fast-switching, 25 kV electrostatic kicker. With the kicker high voltage off, the muons were transported to the target. With the kicker high voltage on, the muons were deflected into a collimator. The structure was important in avoiding the need to associate positrons with parent muons, a requirement that limited the statistics of earlier measurements.
Another important feature of the experiment was the setup and the choice of the muon stopping targets. First, the E3 beamline was extended through the positron detector with the stopping target mounted in the beam vacuum. This design reduced the number of upstream stops. Second, two combinations of stopping target materials and transverse magnetic fields were used: a magnetized Fe-Cr-Co foil (Arnokrome-III) with a 4 kG internal -field and a quartz crystal disk (SiO2) in a 130 G external -field. In the ferromagnetic target, where muons reside as diamagnetic ions, the precession frequency was 50 MHz. In the quartz target, where muons reside mostly as paramagnetic atoms, the precession frequency was 180 MHz. The fast precession yielded a roughly 1000-fold reduction in the ensemble-averaged polarization via the spin dephasing during the beam accumulation.
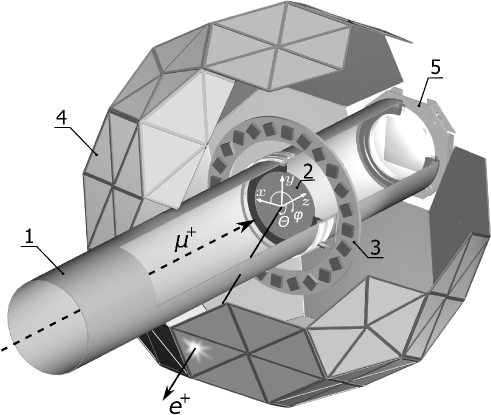
The positron detector was constructed of 170 triangle-shaped plastic scintillator pairs arranged in a soccer ball (truncated icosahedral) geometry (Fig. 1). Each pair comprised an inner plastic scintillator tile and outer plastic scintillator tile. The pairs were grouped into ten pentagonal enclosures containing five tile-pairs and twenty hexagonal enclosures containing six tile-pairs, which together formed the soccer ball geometry. The segmentation was important in reducing positron pile-up in individual detector elements. The symmetric arrangement of detector elements was important in reducing the effects of muon spin rotation / relaxation (SR).
2 Data analysis
A total of 1.01012 decays from stops in Arnokrome-III were collected in our 2006 production run and 0.71012 decays from stops in quartz were collected in our 2007 production run. The runs yielded about 130 terabytes of digitized pulses. The analysis was conducted using the 88-teraflop ABE cluster at the National Center for Supercomputing Applications (NCSA).
The time and amplitude of pulses were determined from least square fits to the individual digitized waveforms. The procedure involved fitting a relatively high-resolution standard waveform (0.022 ns sampling-interval) to a relatively low-resolution individual waveform (2.2 ns sampling-interval). The high-resolution standard waveforms were constructed by combining a large sample of 450 MHz sampling-rate, single-pulse, digitized waveforms. If the quality of the fit to a single pulse was not acceptable, the algorithm attempted to improve the fit by adding pulses or removing pulses.
Two cuts were applied on the amplitudes and the times of the hits before constructing inner-outer tile-pair coincidences. One cut defined an unambiguous software amplitude threshold for detector hits. Another cut defined an unambiguous artificial deadtime between detector hits. Hits that survived these cuts were sorted into time distributions of inner singles, outer singles and inner-outer coincidences. The construction of coincidence histograms with different thresholds and artificial deadtimes was important for studying such effects as pulse pileup and gain variations.
2.1 Systematics effects
If a hit occurs in the artificial deadtime of an earlier hit it is lost. Because these losses are more frequent during the high rates at early measurement times than the low rates at late measurement times, such pile-up distorts the time spectrum.
Our procedure for correcting for pileup took advantage of the time structure of the incident beam. The pileup losses were statistically recovered by replacing the lost hits in each measurement period with measured hits at equivalent times in neighboring measurement periods. For example, to correct for leading-order pileup, if a hit is observed at time in fill (the “trigger” hit), a hit is searched for within the interval in fill (the “shadow” hit). Adding the resulting histogram of shadow hit times to the original histogram of trigger hit times thereby statistically recovers the lost hits. Similar methods were used to correct for higher-order pileup and accidental coincidences.
In filling histograms only hits with amplitudes that exceed the threshold were used. Consequently, if the detector gain varies over the measurement period, then the time histogram will be distorted, either by additional hits rising above the amplitude cut or by additional hits falling below the amplitude cut.
Our procedure for correcting for gain variations took advantage of the measurement of the positron pulse amplitude during the measurement period. The detector gain versus measurement time was determined from the MIP (minimally ionizing particle) peak of the decay positrons in the scintillator tiles. Using the MIP-peak position versus measurement time, the time histograms were corrected for gain variations.
2.2 Lifetime fits
A simple procedure was used to extract the lifetime from the Arnokrome-III target. The summed tile-pair time histogram of coincidence hits was fit to . The approach relied on sufficient cancellation of Arnokrome-III SR effects by spin dephasing and detector geometry. No evidence of SR distortion were observed in the time spectra from the Arnokrome-III target.
A more detailed procedure was needed to extract the lifetime from the quartz target. First, geometry-dependent effective lifetimes were extracted for each tile-pair from fits to
| (1) |
where accounts for time-dependent effects of transverse-field (TF) spin precession / relaxation. Then, the lifetime is extracted from the 170 effective lifetimes from a fit to
| (2) |
where accounts for geometry-dependent effects of longitudinal-field (LF) spin relaxation. Together these steps accounted for all observed features of quartz TF/LF SR.
Note a number of datasets were accumulated with different magnetic field orientations and different positron detector offsets. These datasets changed the magnitude and orientation of TF/LF SR effects. The agreement between lifetime results for different configurations was an important verification of the fitting procedures.
3 Results
The individual results [3] for the muon lifetime from the Arnokrome-III dataset and the quartz dataset are
| (3) |
and
| (4) |
The combined result
| (5) |
is obtained from the weighted average of the individual values with the appropriate accounting for the correlated uncertainties. The result corresponds to an overall uncertainty in the muon lifetime of 2.2 ps or 1.0 ppm—a thirty-fold improvement over earlier generations of lifetime measurements. The largest contributions to systematic uncertainties are associated with the aforementioned pulse pileup, gain changes and SR effects, as well as the knowledge of the time independence of the beam extinction during the measurement period.
The final result for is in reasonable agreement with the earlier work of Duclos et al., Balandin et al., Giovanetti et al. and Bardin et al. However, it is in marginal disagreement (2.9 ) with the commissioning result from the FAST collaboration experiment [4].
We use the relation obtained by van Ritbergen and Stuart (vRS) [1] for the determination of the Fermi constant from the measurement of the muon lifetime . The vRS relation was derived using the - current-current Fermi interaction with QED corrections evaluated to 2-loop order. It yields , a thirty-fold improvement over the 1998 Particle Data Group [5] value that pre-dates the vRS theoretical work and recent lifetime measurements. The 0.5 ppm error is dominated by the 1.0 ppm uncertainty of the lifetime measurement, with contributions of 0.08 ppm from the muon mass measurement and 0.14 ppm from the theoretical corrections.
References
- [1] T. van Ritbergen and R. G. Stuart, Nucl. Phys. B 564, 343 (2000) [hep-ph/9904240].
- [2] A. Pak and A. Czarnecki, Phys. Rev. Lett. 100, 241807 (2008) [arXiv:0803.0960 [hep-ph]].
- [3] D. M. Webber et al. [MuLan Collaboration], Phys. Rev. Lett. 106, 041803 (2011) [Phys. Rev. Lett. 106, 079901 (2011)] [arXiv:1010.0991 [hep-ex]].
- [4] A. Barczyk et al. [FAST Collaboration], Phys. Lett. B 663, 172 (2008) [arXiv:0707.3904 [hep-ex]].
- [5] C. Caso et al. (Particle Data Group), The European Physical Journal C3 (1998) 1.