Molecular Hydrogen and [Fe ii] in Active Galactic Nuclei III: LINERS and Star Forming Galaxies
Abstract
We study the kinematics and excitation mechanisms of H2 and [Fe ii] lines in a sample of 67 emission-line galaxies with Infrared Telescope Facility SpeX near-infrared (NIR, 0.8-2.4m) spectroscopy together with new photoionisation models. H2 emission lines are systematically narrower than narrow-line region (NLR) lines, suggesting that the two are, very likely, kinematically disconnected. The new models and emission-line ratios show that the thermal excitation plays an important role not only in active galactic nuclei but also in star forming galaxies. The importance of the thermal excitation in star forming galaxies may be associated with the presence of supernova remnants close to the region emitting H2 lines. This hypothesis is further supported by the similarity between the vibrational and rotational temperatures of H2. We confirm that the diagram involving the line ratios H2 2.121m/Br and [Fe ii] 1.257m/Pa is an efficient tool for separating emission-line objects according to their dominant type of activity. We suggest new limits to the line ratios in order to discriminate between the different types of nuclear activity.
keywords:
galaxies: Seyfert – infrared: spectra – molecular processes – infrared: galaxies – line: formation1 Introduction
Molecular gas emission has been detected in the inner few tens of parsecs of the central region of emission-line galaxies (e.g. Alloin & Galliano, 2002; Gratadour et al., 2003; Riffel et al., 2006a, b, 2008a; Storchi-Bergmann et al., 2010; Riffel & Storchi-Bergmann, 2011a, b). However, the origin of these lines remains unclear. They appear in objects classified from starburst to active galactic nucleus-dominated. In active galactic nuclei (AGNs), unification models predict the presence of a dusty molecular torus that obscures the central source from some viewing angles, thus creating apparently different AGN classes (e.g. Seyfert 1 and Seyfert 2 galaxies). In order to block the radiation coming from the central source, the torus must have a very large optical depth (tens of magnitudes), thus serving as a natural reservoir of molecular gas. For example, Gratadour et al. (2003, see their Fig. 4) propose that the torus is the source of the H2 emission-lines observed in NGC 1068. However, Integral Field Unit (IFU) spectroscopy of this source shows that the molecular gas is distributed along the galaxy and is spatially correlated with a young stellar population (30 Myr old, Storchi-Bergmann et al., 2012).
Observational evidence has confirmed that circumnuclear/nuclear starbursts can coexist in objects harbouring AGNs (e.g. Mizutani et al., 1994; Imanishi & Dudley, 2000; Sturm et al., 2002; Contini et al., 2002; Rodríguez-Ardila & Viegas, 2003; Imanishi & Wada, 2004; Storchi-Bergmann et al., 2005; Shi et al., 2006). However, in the case of low-luminosity AGNs, no strong starburst evidence is found, but significant fractions of intermediate-age stars are detected (Ivanov et al., 2000; Cid Fernandes et al., 2004; González Delgado et al., 2004; Cid Fernandes et al., 2005, 2010, and references therein). Thus, if star formation is taking place or occurred recently, the presence of molecular clouds associated with the star forming regions should leave spectral signatures that may contaminate the AGN spectrum. Therefore, whether the H2 lines observed in AGNs are directly associated with either the molecular dusty torus or the circumnuclear gas remains an open question. Alternatively, the molecular gas may be directly associated with the AGN, but distributed within the circumnuclear region. This later scenario is supported by the fact that the H2 gas is most probably arranged in a disc surrounding the nucleus (Reunanen et al., 2002, 2003; Neumayer et al., 2007). In this picture, shocks by radio jets and X-ray heating are plausible excitation mechanisms for the H2 molecule (Knop et al., 1996; Reunanen et al., 2002; Dors et al., 2012).
As shown by Rodríguez-Ardila et al. (2004, 2005) and Riffel et al. (2006a) in the study of 51 objects, mostly AGNs, molecular hydrogen is detected in almost all Seyfert 2 (Sy 2) and in about 80% of the Seyfert 1 (Sy 1) sources. Interestingly, the four starburst galaxies in Riffel et al. (2006a) also show the presence of molecular hydrogen emission. However, these previous works have not included a statistically significant number of Low-ionisation nuclear emission-line region (LINER) and Star Forming Galaxies (SFGs). In fact, up to now, only a few investigations have included these type of sources (e.g. Larkin et al., 1998). These classes deserve separate analyses, as it is expected that the active nucleus has very little influence on their emission-line spectrum.
The H2 infrared emission lines may be produced by the radiative de-excitation following collisional excitation (thermal process) or UV (6-18 eV) photon absorption (non-thermal process). H2 may also be formed in an excited state, after which de-excitation also leads to emission of IR lines. This mechanism is, however, not very important in a hot or strongly UV/X-ray irradiated gas (e.g. Aleman & Gruenwald, 2011) as AGNs. H2 IR emission can be significant in regions illuminated by UV photons (Black & van Dishoeck, 1987; Sternberg & Dalgarno, 1989) or X-rays (Maloney et al., 1996; Lepp & McCray, 1983), as well as in shocks (Hollenbach & McKee, 1989). In each case, a different emission-line spectrum is expected and, therefore, the relative intensities among the H2 emission-lines may be used to discriminate between the powering mechanisms (e.g. Mouri, 1994), keeping in mind that multiple emitting regions and multiple mechanisms may simultaneously be present (Rodríguez-Ardila et al., 2004, 2005; Riffel et al., 2006b, 2008a; Storchi-Bergmann et al., 2009; Riffel & Storchi-Bergmann, 2011b).
Rodríguez-Ardila et al. (2004, 2005) carried out a pioneering study of the H2 excitation mechanisms in a sample of Seyfert galaxies. The innovation of these investigations compared to previous ones (Veilleux et al., 1997; Larkin et al., 1998; Reunanen et al., 2002, 2003) is that their integrated spectra cover the inner 300 pc in most of the sample, minimizing the host galaxy contamination and maximizing the number of diagnostic lines observed. In addition, [Fe ii] and H2 emission-lines are usually suggested to form in the same region, and the evidence accumulated shows that forbidden iron emission in AGNs can have different sources, but very likely, all directly related to the central engine (Forbes & Ward, 1993; Goodrich et al., 1994; Simpson et al., 1996; Alonso-Herrero et al., 1997; Mouri et al., 2000; Rodríguez-Ardila et al., 2004, 2005; Davies et al., 2005; Riffel et al., 2006b, 2008a; Storchi-Bergmann et al., 2009; Riffel & Storchi-Bergmann, 2011b; Dors et al., 2012, and references therein). Thus, it is interesting to study the excitation mechanisms leading to H2, together with the processes responsible for the [Fe ii] emission-lines.
With the above in mind, we present a study of the excitation mechanisms leading to the emission of H2 and [Fe ii] for a sample of nearby LINERs and SFGs. We present 16 new spectra acquired with the same instrumentation employed by Rodríguez-Ardila et al. (2004, 2005) and Riffel et al. (2006a), with simultaneous observations of the -bands, eliminating differences in aperture and seeing across the bands. The samples combined correspond to an homogeneous data set with 70 sources. To date this is the largest number of galaxies used to study the nuclear excitation mechanisms of H2 and [Fe ii].
This paper is structured as follows. § 2 presents the observations and data reduction steps. § 3 discusses the kinematics of the H2 and [Fe ii] gas inferred from their line profiles. In § 4, the excitation mechanisms of the H2 IR lines in AGN are discussed using new photoionisation models for AGNs and Starbusts. The calculated emission is compared to the observed H2 line ratios in a 1-0 S(2)/1-0 S(0) vs 2-1 S(1)/1-0 S(1) diagnostic diagram. § 5 analyses the line ratios H2 2.121/Br and [Fe ii] 1.257/Pa for different emission-line objects and the apparent correlation between these ratios over a large range of values. It also discusses the difference in these ratios for different nuclear activity type. Concluding remarks are given in § 6. A Hubble constant of 75 km s-1 Mpc-1 will be used throughout this work in order to be consistent with our previous studies.
2 Observations and data reduction
Near-infrared (NIR) spectra in the range 0.8-2.4 m were obtained on October 4,6, and 7 in 2010 with the SpeX spectrometer (Rayner et al., 2003) attached to the NASA 3 m Infrared Telescope Facility (IRTF). The detector is a 10241024 ALADDIN 3 InSb array with a spatial scale of 0.15′′/pixel. Simultaneous wavelength coverage was obtained by means of prism cross-dispersers. A 0.815′′ slit was used during the observations, giving a spectral resolution of 360 . Both the the arc lamp spectra and the night sky spectra are consistent with this value. The seeing varied between 0.4′′–0.7′′ over the different nights.
Due to the extended nature of the sources, the observations were done by nodding in an Object-Sky-Object pattern with typical individual integration times of 120 s and total on-source integration times between 18 and 58 minutes. During the observations, A0 V stars were observed near each target to provide telluric standards at similar air masses. They were also used to flux calibrate the sample. Table 1 shows the observation log. The galaxies are listed in order of right ascension, and the number of exposures refers to on source integrations.
Spectral extraction and wavelength calibration were performed using the spextool, a software developed and provided by the SpeX team for the IRTF community (Cushing et al., 2003)111spextool is available from the IRTF web site at http://irtf.ifa.hawaii.edu/Facility/spex/spex.html, following the same procedures as described by Rodríguez-Ardila et al. (2004). Column 10 of Table 1 lists the radius of the integrated region, with centre at the peak of the continuum light distribution for every object of the sample. No effort was made to extract spectra at positions different from the nuclear region, even though some objects show evidence of extended emission. Telluric absorption correction and flux calibration were applied to the individual 1-D spectra by means of the IDL routine xtellcor (Vacca et al., 2003).
The 1-D wavelength and flux calibrated spectra were then corrected for redshift, determined from the average measured from the position of [S iii] 0.953m, Pa, He i 1.083m, Pa and Br. Final reduced spectra, in the spectral regions of interest in this work, are plotted in Figures 1 and 2.
| Source | Activity | Activity | Obs. Date | Exp. Time | Airmass | RA | DEC | z | Pos. Angle | radiusb |
|---|---|---|---|---|---|---|---|---|---|---|
| Reference | (s) | (deg) | (pc) | |||||||
| NGC 23 | SFG | 1 | 2010 10 07 | 29 120 | 1.04 | 00h09m53.4s | +25d55m26s | 0.0157202 | 330 | 609 |
| NGC 520 | SFG | 2 | 2010 10 04 | 16 120 | 1.04 | 01h24m35.1s | +03d47m33s | 0.0080367 | 300 | 311 |
| NGC 660 | LINER/HII | 2,3,4 | 2010 10 06 | 24 120 | 1.01 | 01h43m02.4s | +13d38m42s | 0.0029152 | 33 | 107 |
| NGC 1055 | LINER/HII | 2,3,4 | 2010 10 04 | 16 120 | 1.07 | 02h41m45.2s | +00d26m35s | 0.0036267 | 285 | 210 |
| NGC 1134 | SFG | 5 | 2010 10 04 | 16 120 | 1.11 | 02h53m41.3s | +13d00m51s | 0.0129803 | 0 | 503 |
| NGC 1204 | LINER | 6 | 2010 10 07 | 16 120 | 1.23 | 03h04m39.9s | -12d20m29s | 0.0154058 | 66 | 597 |
| NGC 1222 | SFG | 7 | 2010 10 06 | 24 120 | 1.13 | 03h08m56.7s | -02d57m19s | 0.0082097 | 315 | 270 |
| NGC 1266 | LINER | 7 | 2010 10 07 | 18 120 | 1.09 | 03h16m00.7s | -02d25m38s | 0.0077032 | 0 | 298 |
| UGC 2982 | SFG | 8 | 2010 10 04 | 9 120 | 1.11 | 04h12m22.4s | +05d32m51s | 0.0177955 | 295 | 689 |
| NGC 1797 | SFG | 1 | 2010 10 07 | 16 120 | 1.23 | 05h07m44.9s | -08d01m09s | 0.0154111 | 66 | 597 |
| NGC 6814 | Sy 1 | 7 | 2010 10 07 | 16 120 | 1.17 | 19h42m40.6s | -10d19m25s | 0.0056730 | 0 | 220 |
| NGC 6835 | ? | - | 2010 10 06 | 22 120 | 1.21 | 19h54m32.9s | -12d34m03s | 0.0057248 | 70 | 166 |
| UGC 12150 | LINER/HII | 9 | 2010 10 04 | 15 120 | 1.08 | 22h41m12.2s | +34d14m57s | 0.0214590 | 37 | 748 |
| NGC 7465 | LINER/Sy 2 | 10 | 2010 10 06 | 12 120 | 1.03 | 23h02m01.0s | +15d57m53s | 0.0066328 | 340 | 257 |
| NGC 7591 | LINER | 7 | 2010 10 07 | 16 120 | 1.03 | 23h18m16.3s | +06d35m09s | 0.0165841 | 0 | 642 |
| NGC 7678 | SFG | 11 | 2010 10 04 | 16 120 | 1.01 | 23h28m27.9s | +22d25m16s | 0.0120136 | 90 | 419 |
-
SFG: Star Forming Galaxies (Starburst or Hii galaxies). LINER/HII were assumed as pure LINERs in the text. References - 1: Balzano (1983); 2: Ho et al. (1997b); 3: Ho et al. (1997a); 4: Filho et al. (2004); 5: Condon et al. (2002); 6: Sturm et al. (2006); 7: Pareira-Santaella et al. (2010); 8: Schmitt et al. (2006); 9: Veilleux et al. (1995); 10: Ferruit et al. (2000); 11: Gonçalves et al. (1997b).


3 on the molecular gas kinematics
The main goal of this section is to discuss how the velocity width of the H2 2.1213m emission-line compares to that of [Fe ii] and [Siii] in different objects. This provides important constraints to the location of the molecular gas, and allows a comparison between this region with the different types of nuclear activity. It is worth mentioning that the nuclear activity used here (Table 1) comes primarily from optical studies, and was taken from the NASA Extragalactic Database (NED). However, NIR emission-line ratios may reveal the presence of “hidden” AGNs (see Sec. 5).
Previous results, mainly on Seyfert galaxies, are controversial. An imaging study of H2 emission (Quillen et al., 1999) shows that the H2 is distributed on scales of a few hundred parsecs from the nucleus. In addition, the fact that the H2 emission was found to coincide with [O iii] and H+[N ii] for some sources led the authors to suggest that the molecular gas may follow the narrow line region (NLR) gas distribution. Schinnerer et al. (1999) suggest that the molecular gas in NGC 1068 and NGC 3727 originates from a warped disc with a radius smaller than 75 pc. These latter results are supported by those of Rodríguez-Ardila et al. (2004, 2005), who found that the H2 2.1213m emission is spectroscopically unresolved or with FWHM systematically narrower than that of the NLR forbidden lines in Seyfert galaxies. This was interpreted in terms of a kinetic disconnection between the molecular and the NLR gas. Further support to this hypothesis comes from Integral Field Unit (IFU) studies of AGNs, which suggest that the H2 is in the galaxy plane, from the centre up to the field limit ( 500 pc), while the ionised gas is observed up to high latitudes (Riffel et al., 2006b, 2008a; Storchi-Bergmann et al., 2009, 2010; Riffel & Storchi-Bergmann, 2011a, b; Davies et al., 2009; Müller Sánchez et al., 2009).
In order to study the H2 and [Fe ii] lines in LINERs and SFGs, and to complete our analysis of these transitions in emission-line objects, we have followed the methodology of our previous studies. We assume that the widths of the forbidden lines (or NLR gas in the case of AGNs) reflect the large scale motions of the emitting clouds in the gravitational potential of the central mass. As a consequence, similar FWHM of molecular and atomic forbidden lines would indicate that these species are co-spatial222It is worth mentioning that, only because two lines have similar FWHMs does not prove that they are co-spatial. For instance, they could originate approximately in the same region but from different gas layers with different physical conditions. Even when lines originate from exactly the same gas, different line profiles (or FWHM) may result from radiative transfer effects..
Table 2 lists the intrinsic FWHM of [S iii] 0.9531m, [Fe ii] 1.2567m and H2 1.957, 2.0332, and 2.121m. To obtain the intrinsic FWHM, the instrumental width was subtracted from the observed line width in quadrature. The errors in FWHM ( 30 ) are dominated by the uncertainty in the continuum placement. To ensure that the intrinsic FWHM is equal or larger than the instrumental one (360 ), a line was considered to be spectroscopically resolved if its measured FWHM was larger than 500 . Thus, lines with FWHM equal to 360 in Table 2 may have measured values in the range 360 FWHM 500 .
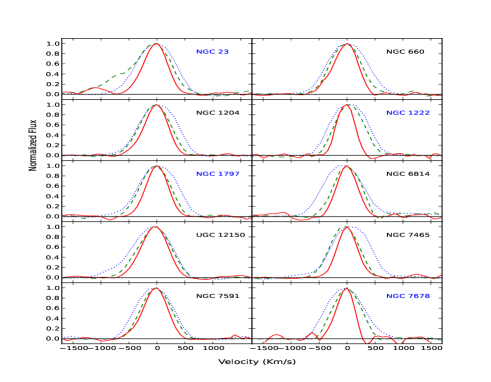
Figure 3 compares the observed line profiles of [S iii] 9531Å (dotted line), [Fe ii] 1.257m (dashed line), and H2 2.122m (full line) for a sub-sample of our sources (those exhibiting all the three lines). Clearly, [S iii] and [Fe ii] tend to be broader than H2, following the same trend observed in Seyfert galaxies (Rodríguez-Ardila et al., 2004, 2005).
| Source | [S iii] | [Fe ii] | H2 | H2 | H2 |
|---|---|---|---|---|---|
| 9530 | 1.2570 | 1.9570 | 2.0332 | 2.1213 | |
| m | m | m | m | ||
| NGC 23 | 435 | 563 | 492 | 360 | 360 |
| NGC 520 | – | – | 360 | 360 | 360 |
| NGC 660 | 612 | 402 | 390 | 360 | 360 |
| NGC 1055 | – | – | – | – | – |
| NGC 1134 | – | – | – | – | – |
| NGC 1204 | 562 | 301 | 360 | 360 | 360 |
| NGC 1222 | 500 | 447 | 601 | 360 | 360 |
| NGC 1266 | – | 632 | 360 | 360 | 360 |
| UGC 2982 | – | – | 648 | 360 | 360 |
| NGC 1797 | 573 | 285 | 360 | 360 | 360 |
| NGC 6814 | 717 | 583 | 368 | 360 | 360 |
| NGC 6835 | – | 499 | 876 | 360 | 360 |
| UGC 12150 | 611 | 508 | 527 | 360 | 360 |
| NGC 7465 | 557 | 492 | 360 | 390 | 360 |
| NGC 7591 | 669 | 367 | 666 | 363 | 360 |
| NGC 7678 | 746 | 360 | 360 | 360 | 360 |
-
The uncertainty associated with the FWHM is 30 km s-1 (for details see text).
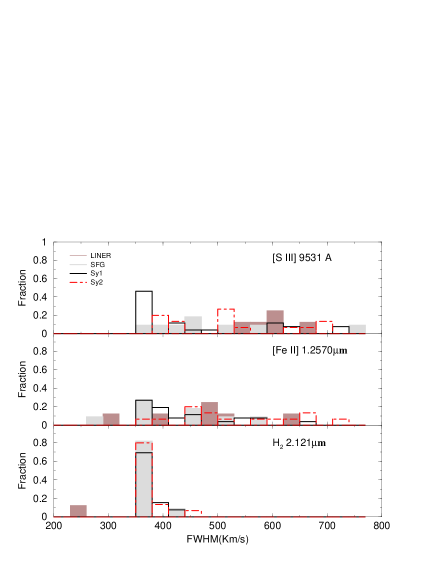
To better understand the kinematics of the gas emitting the different lines in the sources of different classification, we show in Figure 4 a fractional histogram of the FWHM values of the three lines used in Figure 3 for the data presented in Table 2 plus literature data taken from Rodríguez-Ardila et al. (2004, 2005). This plot shows that the molecular gas follows different kinematics than that followed by the atomic forbidden emission-line gas not only in Seyferts, but also in LINERs and SFGs. Previous work supports this disconnection in Seyfert galaxies, and suggests that the gas is arranged in a disc surrounding the nuclear region (Reunanen et al., 2002, 2003). Further support for this hypothesis comes from Gemini-IFU studies (Riffel et al., 2006b, 2008a; Storchi-Bergmann et al., 2009, 2010; Riffel & Storchi-Bergmann, 2011a, b), who suggest that the H2 is located in the galaxy plane and is distributed along the whole field, while the ionised gas is observed up to high latitudes from the galaxy plane.
In summary, the observational evidence presented here confirms that H2 is common within the inner few hundred parsecs of emission-line galaxies, regardless of type. The molecular gas follows different kinematics than that of the ionised gas, suggesting that the two emissions are not co-spatial. The H2 lines are narrower than the forbidden ones, in particular [S iii]. A possible explanation involves atomic gas outflow. Indeed, Riffel et al. (2012) have shown very recently that the velocity dispersion of gas restricted to the plane (H2 gas) does not correlate with that of bulge stars. On the other hand, the velocity dispersion of gas extending to higher latitudes (such as the [Fe ii] emitting gas) is similar to that of the galaxy bulge stars. Higher velocity dispersions of [Fe ii] relative to stars are probably due to an extra heating provided by a nuclear AGN outflow. In such a scenario, the atomic gas could be farther out from the supermasive black hole (SMBH) than the molecular gas. Another possibility worth mentioning is the atomic gas being closer to the SMBH than the molecular gas and, thus, being more affected by the gravitational pull of the putative SMBH in AGNs. Such a possibility is related to the fact that [S iii] is a higher ionisation line and, thus, its bulk should be formed more inwards in the NLR than [Fe ii] and H2. Thus, the unresolved FWHM of H2 in almost all objects implies that the molecular gas is probably not gravitationally bound to the SMBH, but to the collective gravitational potential of the galaxy. According to literature results (Reunanen et al., 2002, 2003), it may be arranged in a disc-like structure. Further support of this hypothesis comes from the fact that, compared to SFGs, AGNs tend to have significantly broader [S iii] than [Fe ii] and H2 (Fig. 4).
4 Excitation mechanisms of the H2 lines
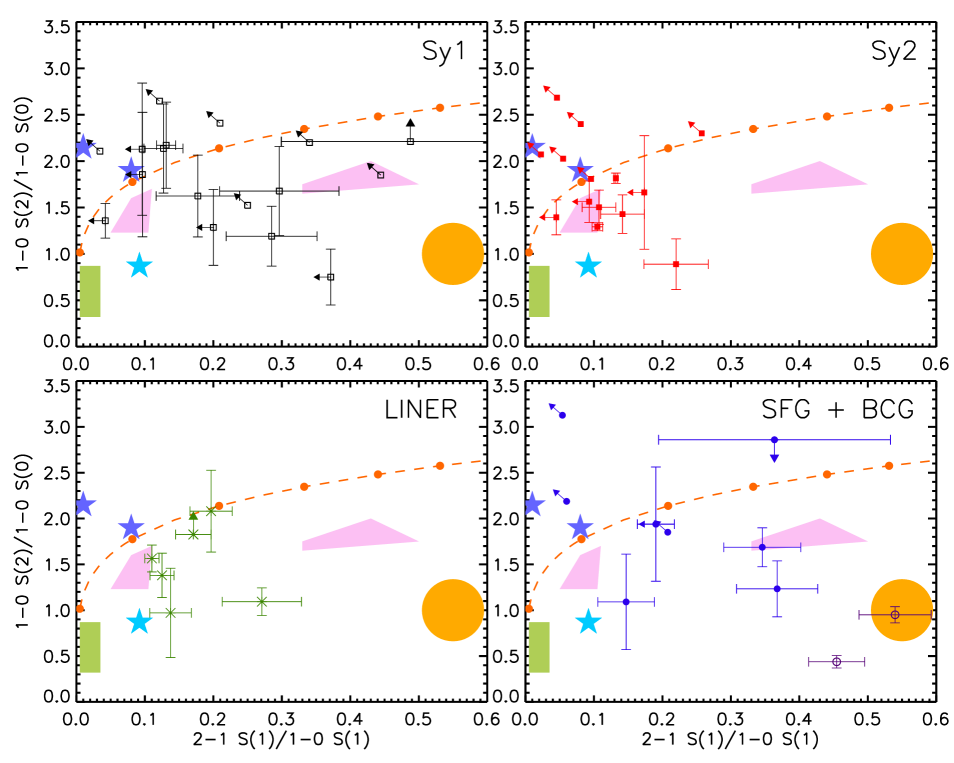
As mentioned in the Introduction, H2 line ratios are used to discriminate among the dominant line excitation mechanisms. For example, Mouri (1994) suggested the use of the ratios 1-0 S(2) 2.033m/1-0 S(0) 2.223m versus 2-1 S(1) 2.247m/1-0 S(1) 2.121m to separate the mechanism exciting the H2 emission. Figure 5 shows this plot for the objects listed in Table 1 plus AGNs from Rodríguez-Ardila et al. (2004, 2005) and blue compact dwarf galaxies (BCGs) from Izotov & Thuan (2011). It can be seen from Fig. 5 that objects with different nuclear activity populate different regions of the diagram. Sy1s and SFGs tend to scatter over the plotted region, although Sy1s tend to have lower values of 2-1 S(1)/1-0 S(1) than SFGs, while Sy2 and LINERs are concentrate in a smaller region around the coordinates (0.1,1.5). Note also that two BCGs are on the lower right of the plot.
Figure 5 also shows results of model calculations found in the literature. The UV-excited low-density gas models of Black & van Dishoeck (1987) occupy the region indicated by the orange filled circle on the right, while the UV-excited high-density models of Sternberg & Dalgarno (1989) occupy the region indicated by the green box on the left. Models of X-ray irradiated gas of Lepp & McCray (1983) are indicated by purple stars. The cyan star is a model of shock by Kwan (1977). Maloney et al. (1996) showed that for X-ray–irradiated molecular gas, the 2-1 S(1)/1-0 S(1) ratio is 0.3 (0.1 in regions where the line 1-0 S(1) is more intense). Dors et al. (2012) calculated the ratios with the photoionisation code CLOUDY for AGN models. They found that heating by X-rays produced by active nuclei is a common and very important mechanism of H2 excitation. Shock models by Kwan (1977) give 2-1 S(1)/1-0 S(1) = 0.092 and 1-0 S(2)/1-0 S(0) = 0.87, while Hollenbach & McKee (1989) find ratios in the range 0.3-0.5 for the 2-1 S(1)/1-0 S(1) ratio333This ratio is not indicated on Fig. 5 because the authors did not provide the corresponding 1-0 S(2)/1-0 S(0) ratios..
The observed ratios are not reproduced by any of pure low-density UV, high-density UV, X-rays or shock models only. Different processes may be more important in different objects. Moreover, a mixture of these processes are likely to be exciting the molecule in both AGNs and SBs. Here we will focus our discussion in the excitation due to a radiation source (i.e., no shock excitation).
The models of Sternberg & Dalgarno (1989) and Black & van Dishoeck (1987) only consider UV radiation (E 13.6 eV). On the other hand, the models of Maloney et al. (1996) only consider X-ray radiation (E 100 eV). Lepp & McCray (1983) present very complete models and take a wider energy range into account, but they only calculated two models. Dors et al. (2012) obtained models for a single value of gas density ( 104 cm-3) and their calculations stop when the temperature falls to 1000 K, missing an important part of the H2 emission, where the X-rays may be of great importance (see the discussion of Fig. 8 below and Aleman & Gruenwald, 2011).
Here we present new calculations of the H2 IR emission lines produced with a photoionisation numerical code. These calculations are an improvement over the previous mentioned calculations, since they consider the spectrum from the IR up to X-rays (10 1 keV), they run from the inner and more ionized zones to the outer and more neutral zones, where T decreases to 100K. The processing of the radiation in the inner gas shells is done in a self-consistent way and the microphysics of H2 is included in detail. The models are described below (Sect. 4.1). In Sect. 4.2, we compare model and observed H2 line ratios, with the aim of studying the excitation mechanism of these lines.
4.1 Models
We calculated the intensity of H2 emission lines of AGNs using the one-dimensional photoionisation code aangaba (Gruenwald & Viegas, 1992). The H2 microphysics is included in detail in the code. To calculate the intensity of H2 IR lines, the density and the population of the H2 electronic ground state rovibrational levels that originate the emission must be known. The density of H2 is calculated assuming the chemical and ionisation equilibrium between this molecule and the other H-bearing species (H0, H+, H-, H , and H; see Aleman & Gruenwald 2004). The code includes over forty different reactions of formation and destruction of these species. The population of the H2 rovibrational levels of the three lowest electronic bound states is calculated by assuming statistical equilibrium (i.e., the total population rate of a level is equal to the total depopulation rate). The populations of the electronic ground level takes into account the radiative and collisional excitation and de-excitation mechanisms, as well as the possibility that H2 is produced or destroyed in any given level. For upper electronic levels, only radiative electronic transitions between each upper state and the ground state are included, since this must be the dominant mechanism.
The population of excited H2 rovibrational levels of the electronic ground state occurs mainly by electric dipole transitions to upper electronic states, with the absorption of a UV photon, followed by the subsequent decay to the ground state (with the emission of an UV photon), usually in a excited rovibrational level. This mechanism of H2 excitation is called UV pumping. The decay to lower levels, through quadrupole transitions, produces fluorescence. Collisions with the dominant species of the gas may also be an important route of H2 excitation. We included collisions of H2 with the main components of the gas, i.e., H, H+, He, H2, and electrons.
The H2 molecule is also included in the gas temperature calculation, which assumes thermal equilibrium (the total input of energy in the gas is balanced by the total loss of energy per unit time and volume). The relevant mechanisms of gain and loss of energy by the gas due to atomic species, dust, and H2 are taken into account. The gas heating mechanisms are photoionisation of atoms, atomic ions, and H2 by the primary and diffuse radiation, H2 photodissociation (direct and two steps), H2 formation on grain surfaces, by associative detachment, and by charge exchange with H, H2 collisional de-excitation, and photoelectric effect on dust surfaces. The gas cooling mechanisms are emission of collisionally excited lines; radiative and dielectronic atomic recombination, thermal collisional atomic ionisation, free-free emission, collisional excitation of H2 destruction of H2 by charge exchange with H+, H2 collisional dissociation, and collision of gas-phase particles with dust grains.More details on the calculation of the H2 level population are found in Aleman & Gruenwald (2004, 2011).
The emissivity of a line produced by de-excitation from a given level is the product of the population of that level by the Einstein coefficient of the transition and by the energy of the emitted photon. The emissivities of the H2 IR lines are calculated for each point of the nebula. The intensities are calculated by integrating the emissivity over the nebular volume. The gas is assumed to be optically thin for the H2 lines.
We assume a spherical distribution, uniform density and composition for gas and dust, and gas densities () from 103 to 105 cm-3, which are typical for AGNs (Osterbrock, 1989). Solar abundance is assumed for the elements in all models (Osterbrock, 1989), with values (Table 3) obtained from Grevesse & Anders (1989). The chemical composition affects the processing of the radiation inside the cloud and, consequently, the ionisation structure of the cloud, but this does not significantly affect the H2 ratios, as shown by Dors et al. (2012).
| Element | Abundance | Element | Abundance |
|---|---|---|---|
| H | 1.0 | Mg | 3.810-5 |
| He | 9.810-2 | Si | 3.510-5 |
| C | 3.610-4 | S | 1.610-5 |
| N | 1.110-4 | Cl | 3.210-7 |
| O | 8.510-4 | Ar | 3.610-6 |
| Ne | 1.210-4 | Fe | 4.710-5 |
Dust, in our models, is assumed to be composed by spherical graphite grains with optical properties taken from Draine & Lee (1984); Laor & Draine (1993). Models were calculated for two different grain radii, 10-2 and 10-1 m, typical interstellar values according to (Li, 2007) and Mathis et al. (1977). As shown in Aleman & Gruenwald (2004), the dust particle size is more important for the H2 density than the grain type. The dust-to-gas mass ratio () is assumed constant in all models. Models were calculated for 10-3 and 10-2, average values for planetary nebulae and the interstellar medium (Tielens, 2005; Lenzuni et al., 1989; Stasińska & Szczerba, 1999).
In our models, the spectrum of an AGN is approximated by a power law, i.e., , where is the photon energy, is the number of photons per unit time per unit of energy emitted by the source, and is the spectral index. The constant roughly indicates the radiation field intensity. It is usually defined in terms of the ionisation parameter, which is the ratio of the amount of hydrogen ionising photons incident on the inner border of the cloud to the density of H atoms of the cloud. The ionisation parameter () is then
where is the numerical H density of the cloud, is the internal radius of the cloud, is the number of hydrogen ionising photons emitted by the ionising source per unit of time, and is the speed of light. values between 10-4 and 10-1 are inferred from observations of the NLR of AGNs (e.g. Osterbrock, 1989). In this paper, we use models for average values (0.1, 0.01 and 0.001). The shape of the UV to X-ray SED can differ among AGNs (Prieto et al., 2010), a range well represented by spectral indices from 1.0 to 1.5, which we use in our models.
For comparison, we also include models with a starburst-like spectrum. For such models, we assume that the ionising spectrum has the shape given by Riffel et al. (2008b), which represents the underlying stellar population of the Starburst (SB) galaxy NGC 7714. We scale the spectrum to study different number of ionising photons. The models range from 52 to 54, to cover SB values (Leitherer et al., 1995). We study the same range of gas and dust parameters as for AGNs.
Our models show that the bulk of the H2 near-IR emission in AGNs is produced in the warm region of the gas, so we use T 100 K as the stop criterion for the models. For SBs, there is a non-negligible contribution from gas with T 100 K in some cases, so the stop criterion is T 50 K.
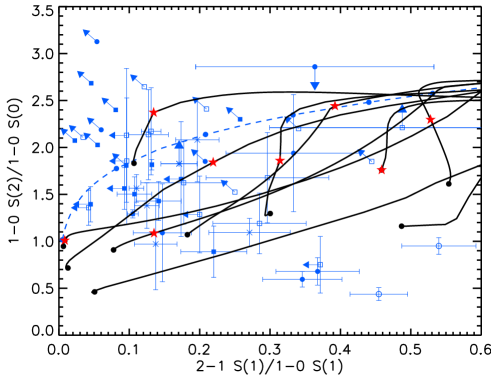
4.2 H2 Diagnostic Diagram: observations versus models
Figure 6 shows the H2 line ratios resulting from our AGN models and from observations. Similarly, Fig. 7 compares our SBs models with observations. The observational data and the results of previous models showed in Fig. 5 are also included in the plots of Figs. 6 and 7 for comparison.
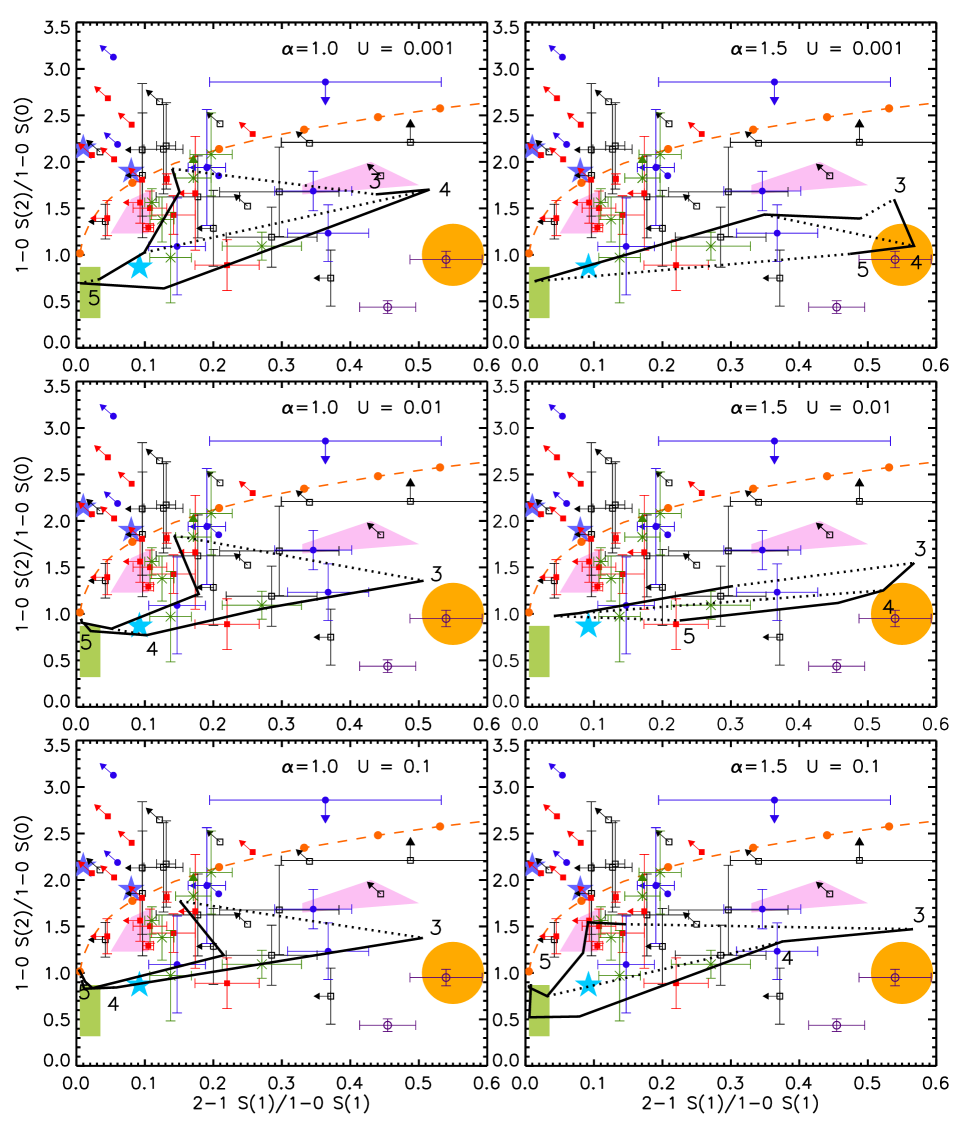
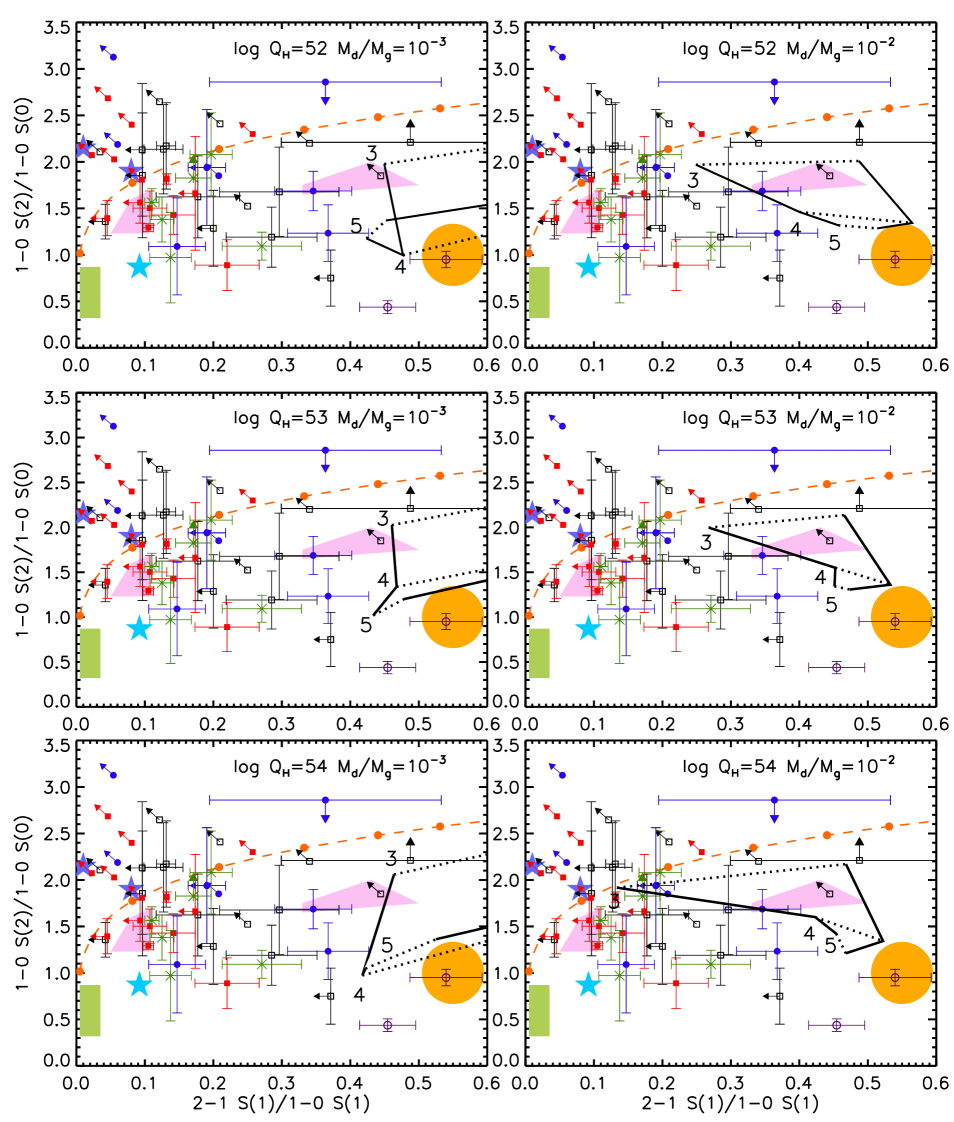
Our models with typical AGN parameters can reproduce most of the observed values (including the SFGs), while SB models only account for a fraction of the SFGs and BCGs and sub-sample of the AGNs with high 1-0 S(2)/1-0 S(0). Our models confirmed that the H2 excitation in AGNs is most likely produced in a gas irradiated by a spectrum rich in high energy photons, while for the SBs the H2 excitation is could be due to a starburst-like spectra or by a power-law spectra as can be seen in Figs. 6 and 7. Models with a hard incident spectrum (i.e., with a large amount of high energy photons, or a lower value) tend to have lower 2-1 S(1)/1-0 S(1) ratios than AGN models with soft spectra or SB models. The region around the coordinates (0.15,1.5) on these plots is densely populated with Seyfert galaxies and LINERs. For 1.0, only models with 104 cm-3 can reproduce the observations. Models with 1.5 can reproduce the observations, with the exception of the dense ( 105 cm-3) 0.1 models. Alternatively, if the cloud is dense ( 105 cm-3), the cloud is thiner than our models, i.e., has only gas at temperatures higher than 500K (see paragraph bellow). The observations around the coordinates (0.12,1.5) can only be reproduced by models with 103cm-3. It is worth mentioning that the H2 line ratios remain essentially unchanged if we consider an average AGN ionizing spectrum like the one used by Korista et al. (1997), or an equivalent power-law. For the latter we mean a SED that produces approximately the same far-UV (5eV) to X-ray (2keV) flux ratio. The Korista et al. (1997) SED, for example, is equivalent to a single power-law with a spectral index of 1.4. As an example, one of our models with a spectral index of 1.5 gives the ratios 1-0 S(2)/ 1-0 S(0) = 1.252 and 2-1 S(1)/ 1-0 S(1) = 0.523, while a model with the same parameters plus the Korista et al. (1997) SED gives very similar results for 1-0 S(2)/ 1-0 S(0) = 1.174 and 2-1 S(1)/ 1-0 S(1) = 0.566.
The increase of the depth in the cloud also affects significantly the line ratios as can be seen in Fig. 8. In general, for increasing depth both ratios decrease towards lower values, initially following the LTE high temperature solutions (dashed curve) and then following a path that depends on object properties. It can clearly be observed in this figure that the ratios are significantly affected if the models run only for 1000 K (marked with red stars), thus, affecting model predictions.
The diagrams show that several factors, besides the radiation source, compete for the determination of H2 line ratios. Gas and dust density, grain size, and the shape and luminosity of the central source spectra are the most important. For example, Figure 6 shows that AGN models with high gas density tend to have low 1-0 S(2)/1-0 S(0) and 2-1 S(1)/1-0 S(1) ratios, reflecting an emission spectrum dominated by collisions, as discussed by Sternberg & Dalgarno (1989). Values obtained by Kwan (1977) for shock regions are similar to our densest AGN models. For SBs, high density models also tend to have low values of 1-0 S(2)/1-0 S(0), but the exact behaviour of 2-1 S(1)/1-0 S(1) with density also depends on other properties, as discussed below.
Since we assume a constant dust-to-gas ratio (and not the density of grains), increasing the gas density also increases proportionally the amount of dust. As seen in Fig. 7, increasing just the dust-to-gas ratio (keeping constant) diminishes the 1-0 S(2)/1-0 S(0) ratio, but not necessarily 2-1 S(1)/1-0 S(1). We show only SB models with different dust densities, but the effect of increasing dust density on AGN models is similar to that on SB models.
As previously mentioned, dust grain size also plays an important role in H2 line ratios. Models with smaller dust grains have smaller 2-1 S(1)/1-0 S(1) ratios. Assuming a constant dust-to-gas ratio, the optical depth due to dust and the H2 formation rate are inversely proportional to grain size, as shown in Aleman & Gruenwald (2004). For these reasons, more H2 is produced in models with smaller grains.
4.3 H2 excitation temperatures and masses
As stated in Rodríguez-Ardila et al. (2005), an alternative way to determine the mechanism driving the molecular gas excitation is to derive the rotational and vibrational temperatures for the H2. A gas dominated by thermal excitation has similar rotational and vibrational temperatures (as expected for a gas in LTE) while fluorescent excitation is characterized by a high vibrational temperature and a low rotational temperature. For more details see Rodríguez-Ardila et al. (2005, and references therein).
The values of and can be calculated using the fluxes of the observed H2 lines together with the expressions (Reunanen et al., 2002): and . The derived values are presented in Table 5. It can be observed from that table and from Rodríguez-Ardila et al. (2005) Table 4, that AGNs and LINERs tend to have similar values of and , while in the case of SFGs (NGC 23, NGC 520, NGC 34, NGC 1614 and NGC 7714, the latter 3 are from Rodrigues-Ardila sample) the tends to be higher than .
In addition to the excitation temperature, the fluxes of Table 4 also allow us to compute the mass of hot H2 emitting the 1-0S(1) 2.121 m line by means of the equation: (Reunanen et al., 2002).
The mass of this hot H2 for our galaxy sample is listed in Table 5. They were calculated assuming =2000 K, a transition probability =3.4710-7 s-1 (Turner et al., 1977), the population fraction in the =1, =3 level =0.0122 (Scoville et al., 1982) and the intrinsic flux of H2 2.121m, . The extinction coefficient, Cext, is calculated by assuming an intrinsic value of 5.88 for the flux ratio Pa/Br (Osterbrock, 1989, , case B). As can be observed in Table 5 and in Rodríguez-Ardila et al. (2005), the mass of the hot H2 is very similar for all activity types. The fraction of molecular mass present in the nuclear region and emitting in the NIR is a very small fraction of the warm molecular mass expected to be present in the galaxy centre (up to 10, Young et al., 1961, for example), and is not related to activity type.
Overall, the diagnostic diagrams presented in Figs. 6 and 7 allow us to distinguish fairly well between the H2 excitation mechanisms (collisional or UV pumping). However, it is not straightforward to distinguish between different classes of sources (e.g. AGN or Starburst), as discussed in the previous subsection. Alternatively mechanisms may dominate the H2 excitation in different regions in a same object. As the emission lines are integrated along the line of sight, we observe a combination of such processes. As can be seen in Figs. 6 and 7, both collisional and UV pumping excitations may play an important role not only in AGNs but also in SFG galaxies. This is further supported by the similarity between the vibrational and rotational temperatures of H2 in some objects, and the tendency of to be higher than in others (see Table 5). For example, in SFGs, the thermal processes may dominate the excitation of the gas irradiated by supernova remnants (SNRs) or very hot stars. In this case, the H2 emission is due to X-ray excitation, which would favour vibrational transitions over rotational transitions (Rodríguez-Ardila et al., 2005). Mouri (1994) showed that SNRs lies very close to the thermal curve in these diagnostic diagrams (see their Fig. 1). In the case of UV excitation by stars, the effective optical depth of the nebula, a non-thermal signature, will be determined if the ratios reflect the domination of thermal or non-thermal process (Sternberg & Dalgarno 1989).
| Source | [Feii] | Pa | [Feii] | H2 | H2 | H2 | H2 | H2 | Br |
|---|---|---|---|---|---|---|---|---|---|
| 1.2570m | 1.2820m | 1.6444m | 1.9570m | 2.0332m | 2.1213m | 2.2230m | 2.2470m | 2.1650m | |
| NGC 23 | 10.500.87 | – | 14.203.46 | 20.204.60 | 4.940.57 | 10.001.26 | 4.532.10 (t) | 1.470.37 | 0.000.00 |
| NGC 520 | – | – | 3.870.14 | 2.410.39 | 1.130.10 | 2.400.18 | 0.670.06 | 0.830.12 | 6.670.19 |
| NGC 660 | 13.900.65 | 29.00.60 | 15.700.90 | 8.870.80 | 3.670.56 | 6.910.77 | 2.01 | 1.180.12 (t) | 16.600.71 |
| NGC 1055 | – | – | – | – | 0.000.00 | – | – | – | – |
| NGC 1134 | – | – | – | – | 0.000.00 | – | – | – | – |
| NGC 1204 | 5.160.2 | 12.100.20 | 6.510.36 | 4.170.51 | 1.810.34 | 3.610.25 | 0.870.09 | 0.710.10 | 5.880.27 |
| NGC 1222 | 6.320.43 | 28.200.37 | 4.650.18 | 1.950.34 | 0.950.14 | 0.840.12 | 0.490.14 | 0.16 | 6.980.073 |
| NGC 1266 | 3.190.51 | 0.750.08 | 2.900.38 | 15.100.47 | 5.10 0.44 | 13.700.25 | 3.260.12 | 1.510.14 | 1.400.33 |
| UGC 2982 | – | – | – | 1.790.48 | 0.610.08 (t) | 0.600.02 (t) | – | – | 0.800.036 |
| NGC 1797 | 5.040.25 | 12.100.26 | 4.650.47 | 4.100.51 | 1.480.30 | 3.210.28 | 1.200.17 | 1.180.16 | 5.330.09 |
| NGC 6814 | 4.640.52 | 3.530.57 | 5.530.48 | 3.360.54 | 1.250.20 | 2.140.20 | 1.050.23 | 0.610.13 | 0.520.32 |
| NGC 6835 | 2.060.23 | 4.860.19 | 3.240.08 | 3.330.44 | 0.850.05 | 1.340.21 | 0.650.18 (t) | – | 4.660.25 |
| UGC 12150 | 4.730.33 | 7.860.30 | 3.560.18 | 5.250.05 | 1.650.07 | 4.000.13 | 1.700.85 (t) | 0.550.12 (t) | 2.880.13 |
| NGC 7465 | 11.80.66 | 9.572.61 | 9.200.28 | 4.330.16 | 2.360.39 | 3.920.27 | 1.710.10 | 0.490.06 | 3.750.69 |
| NGC 7591 | 6.800.21 | 9.740.21 | 6.050.60 | 8.170.26 | 2.460.20 | 4.800.36 | 2.250.25 | 1.300.26 | 4.070.052 |
| NGC 7678 | 3.280.49 | 9.200.51 | 3.090.21 | 1.450.10 | 2.030.20 | 0.880.14 | 0.71 | 0.320.14 | 2.560.15 |
| (t) Affected by telluric absorption. | |||||||||
| Source | Cext | H2 Mass | Tvib | Trot |
|---|---|---|---|---|
| M | K | K | ||
| NGC 23 | – | – | 2521469 | 1067601 |
| NGC 520 | – | – | 4115279 | 1832159 |
| NGC 660 | 0.69 | 1615 | 2704240 | 2108208 |
| NGC 1055 | – | – | – | – |
| NGC 1134 | – | – | – | – |
| NGC 1204 | 0.59 | 199157 | 2912256 | 2776270 |
| NGC 1222 | 0.21 | 677 | 2856 | 2373399 |
| NGC 1266 | 1.35 | 7189132 | 2232154 | 1631118 |
| UGC 2982 | – | – | – | – |
| NGC 1797 | 0.54 | 160656 | 4293271 | 1209307 |
| NGC 6814 | 0.00 | 5619 | 3607381 | 1165343 |
| NGC 6835 | 0.98 | 2016 | – | – |
| UGC 12150 | 0.43 | 322797 | 2444363 | 960630 |
| NGC 7465 | 0.47 | 32334 | 2362227 | 1378222 |
| NGC 7591 | 0.51 | 263882 | 3478361 | 1069174 |
| NGC 7678 | 0.28 | 17017 | 4225806 | – |
5 Nuclear activity from Near-Infrared emission-lines
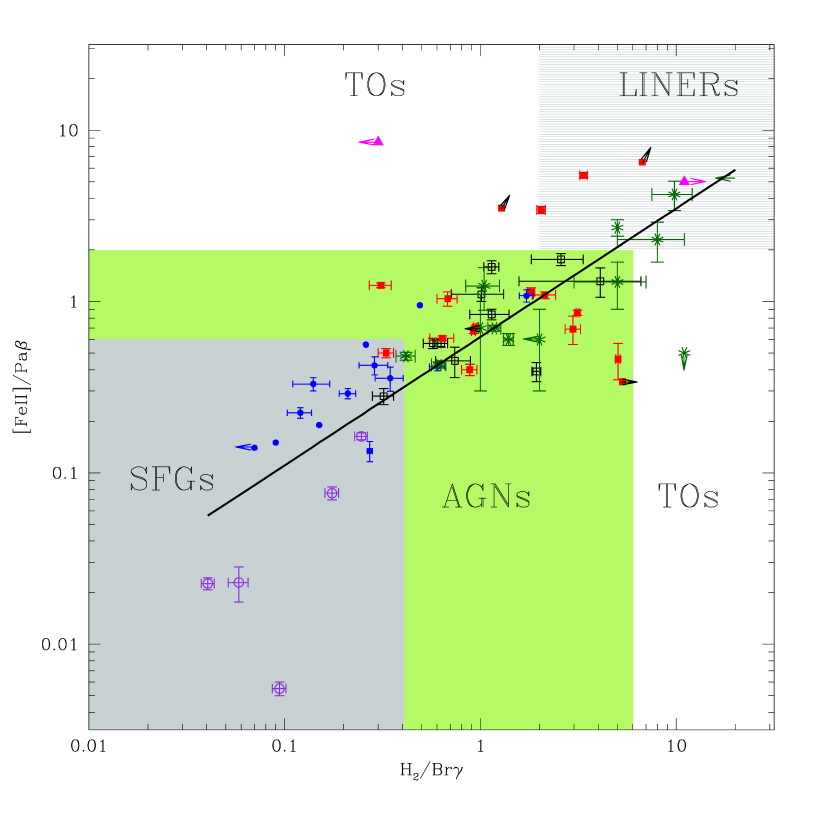
Since H2 and [Fe ii] lines are common features in a wide variety of sources, it is interesting to investigate how these emission-lines compare in objects with different degrees of nuclear activity. A diagram involving the line ratios H2 2.121m/Br and [Fe ii] 1.257m/Pa was proposed by Larkin et al. (1998) in a study of LINERs and other emission-line objects, including a few Seyferts. They report a strong linear correlation in the log-log plot of [Fe ii]/Pa versus H2/Br, with SB galaxies displaying the lower values, Seyferts with intermediate ones and LINERs with the highest ratios. They suggest that [Fe ii]/Pa1 and H2/Br3 mark the end of Seyfert-like nuclei and the beginning of LINER-like objects. Rodríguez-Ardila et al. (2004, 2005) confirm such diagram as a suitable means of separating emission-line objects by their degree of activity in the NIR, and propose that AGNs are characterized by H2 2.121m/Br and [Fe ii] 1.257m/Pa flux ratios between 0.6 and 2. Starburst/H ii galaxies display line ratios 0.6, while LINERs are characterized by values higher than 2 for both ratios. However, the lack of an adequate number of objects preclude definitive conclusions in those studies.
Here, with a larger sample, and most importantly, a more adequate number of objects of each activity class, we may provide further support to the trend already observed. Figure 9 presents the updated version of H2 2.121m/Br [Fe ii] 1.257m/Pa diagnostic diagram. The sample analyzed here is composed by the objects listed in Table 1 plus some taken from the literature: AGNs from Rodríguez-Ardila et al. (2004, 2005), SFG from Dale et al. (2004) and Larkin et al. (1998), LINERs, supernova remnants (SNRs) from Larkin et al. (1998), and BCGs from Izotov & Thuan (2011). As can be seen in Figure 9, LINERs and AGNs are not clearly separated by such a diagram. However, our sample of LINERs is composed by Luminous Infrared Galaxies (LIRGs), and the classification in Table 1 is based on optical emission-line diagrams, which are affected by reddening (see Rodríguez-Ardila et al., 2005, for example). Since LIRGs harbour large quantities of dust, we suggest that the LINERs lying within the region of AGNs may hide a Seyfert nucleus.
With our sample comprising 65 objects, we not only confirm the diagram (Fig. 9) as a discriminator of emission-line objects by their degree of activity, but we also provide improved limits to the line ratios for each activity type. The limits are as follows: (i) SFGs [Fe ii] 1.257m/Pa 0.6 and H2 2.121m/Br 0.4, (ii) AGNs 0.6 [Fe ii] 1.257m/Pa 2 and 0.4 H2 2.121m/Br 6, and (iii) LINERs [Fe ii] 1.257m/Pa 2 and H2 2.121m/Br 6,
As discussed in Rodríguez-Ardila et al. (2005) on a pure observational basis, the interpretation of Figure 9 is not straightforward. For example, the correlation between H2/Br and [Fe ii]/Pa may originate from the fact that H2 and [Fe ii] are mainly excited by the same mechanism, i.e., X-ray. In fact, it was shown very recently by Dors et al. (2012), using photodissociation models, that X-ray heating from the AGN is an important mechanism in the excitation of these NIR emission-lines in AGNs (see Sec.4). They also show that a decrement in the X-ray content of the continuum source translates into a line weakening, and their models are no longer compatible with observations. However, X-ray heating is a plausible explanation for AGNs, but may not work for LINERs. Larkin et al. (1998), for example, argue that hard X-ray heating from a power-law is a plausible mechanism to explain LINERs with low values of the [Fe ii]/Pa and H2 2.121m/Br ratios. But, it would not explain the high values (up to 7) observed in some objects. Nevertheless, the high [Fe ii]/Pa line ratios may be explained by the dependence of [Fe ii]/Pa on the Fe/O abundance and on the dependence on the ionisation parameter of the molecular gas, leading to high values for both ratios (Dors et al., 2012, see their Figure 1)
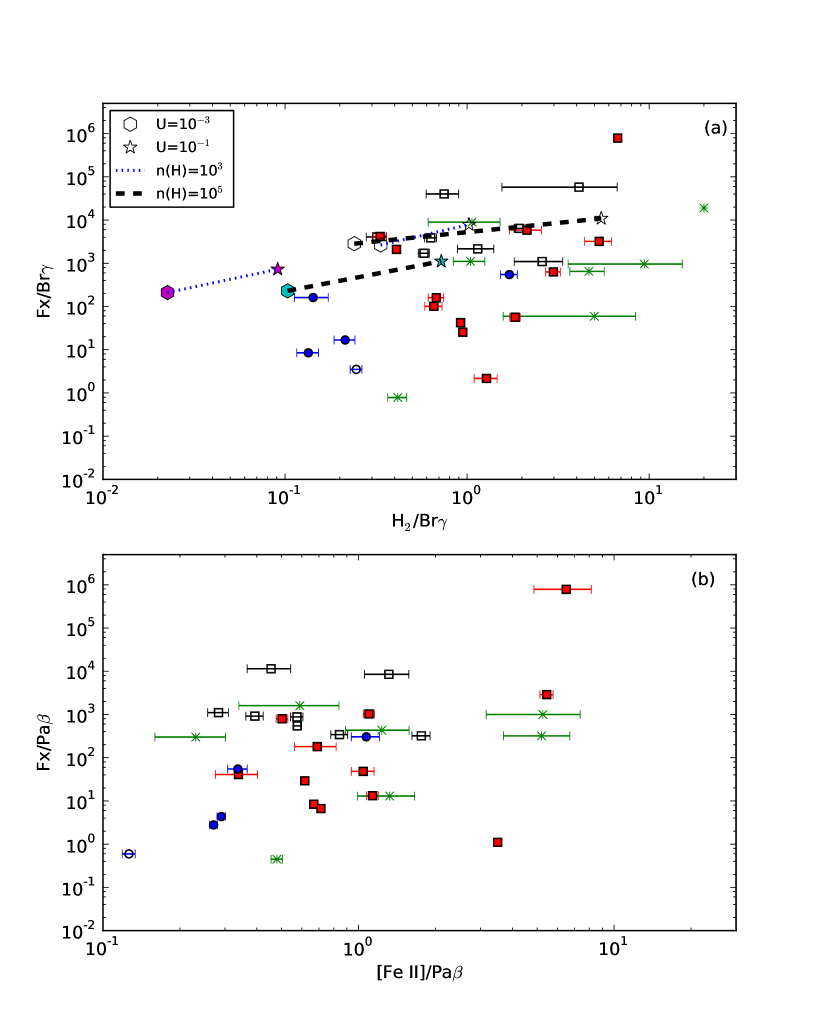
On the other hand, it has been recently proposed that it is unlikely that LINER emission lines are powered by photoionisation by the low-luminosity AGN they harbour (Eracleous et al., 2010; Cid Fernandes et al., 2010; Yan & Blanton, 2012). This would rule out X-ray heating as the main mechanism driving the excitation of the NIR emission-lines in LINERs. We investigated the role played by the hard X-ray (2-10 KeV, Fx) radiation in [Fe ii] and H2 emission lines with diagrams involving Fx/Br vs H2/Br ratios and Fx/Pa vs [Fe ii]/Pa (Fig. 10). The X-ray fluxes were taken from literature and are listed in Table 6. A mild correlation is observed for Fx/Br vs H2/Br (Fig. 10a), indicating that the X-ray heating is an important mechanism in the molecular gas excitation. For a more objective assessment of the X-ray heating in our data, we included model predictions to Fig. 10a. It is clear that the explored parameter space overlaps the observed line ratios. In addition, the AGNs are better explained by =1 and =0.1. It is also interesting that Sy 1s require higher hydrogen gas densities than the other activity types, indicating that the molecular gas in Sy 1s is denser. No correlation is observed for Fx/Pa, and, [Fe ii]/Pa and as for the diagram invloving H2/Br no separation is observed between LINERs and Seyferts (Fig. 10). This result suggests that X-ray heating alone is not responsible for the observed sequence in Fig. 9. As shown by Dors et al. (2012), high values of [Fe ii]/Pa line ratios can be explained by the dependence on the Fe/O abundance. Thus, the observed sequence in Fig. 9 may be a consequence of the amount of X-ray photons together with abundance effect (i.e. in the case of LINERs powered by star-formation, SN explosions would eject enriched material to the interstellar medium).
A detailed interpretation of the variation of these line ratios, from pure-starburst driven emission to LINER nuclei, is non-trivial. A possible scenario is that the different line ratios reflect different excitation mechanisms, in the sense that they are able to describe a transition from an ionizing radiation powered by star formation to pure shock excitation driven by SNRs (Mazzalay et al., 2012). In such a case, the emission-line ratios observed in our LINER sample would be a combination of processes, from X-ray heating to star-formation/evolution. Since most LINERS have strong star formation (Tab. 1), the stars could provide the required electromagnetic or mechanical power to produce the observed line strengths. However, to clearly investigate this issue, a 3D simulation of the emitting gas would be needed (i.e. AGN in the center + star-formation in a volume). It is also worth mentioning that, in the case of star formation, the underlying stellar population would significantly affect the atomic hydrogen emission-lines, thus affecting the observed line ratios (Larkin et al., 1998; Riffel et al., 2008b).
| Source | Fx(2-10 KeV) | Reference |
| Sy 1 | ||
| Mrk 334 | 80 | Lutz et al. (2004) |
| NGC 7469 | 290 | Lutz et al. (2004) |
| NGC 3227 | 75 | Lutz et al. (2004) |
| NGC 4151 | 900 | Lutz et al. (2004) |
| Mrk 766 | 300 | Lutz et al. (2004) |
| NGC 4748 | 30 | Landi et al. (2010) |
| NGC 5548 | 430 | Lutz et al. (2004) |
| NGC 6814 | 300 | Turner & Pounds (2010) |
| Sy 2 | ||
| ESO428-G014 | 3.8 | Lutz et al. (2004) |
| NGC 591 | 2 | Guainazzi et al. (2005) |
| Mrk 573 | 2.8 | Guainazzi et al. (2005) |
| Mrk 1066 | 3.6 | Guainazzi et al. (2005) |
| NGC 2110 | 430 | Nandra et al. (2007) |
| NGC 7674 | 5 | Lutz et al. (2004) |
| NGC 5929 | 79 | Lutz et al. (2004) |
| Mrk 1210 | 250 | Lutz et al. (2004) |
| NGC 5728 | 13.3 | Shu et al. (2007) |
| Mrk 993 | 6.1 | Guainazzi et al. (2005) |
| NGC 5953 | 0.06 | Guainazzi et al. (2005) |
| NGC1144 | 1100 | Lutz et al. (2004) |
| LINER | ||
| NGC 5194 | 4.8 | Cappi et al. (2006) |
| NGC 7743 | 0.44 | González-Martín et al. (2009) |
| NGC 660 | 0.13 | Filho et al. (2004) |
| NGC 7465 | 41.5 | Guainazzi et al. (2005) |
| NGC 3998 | 84.2 | Ueda et al. (2001) |
| NGC 7479 | 3.9 | Ueda et al. (2005) |
| NGC 4736 | 19 | Ueda et al. (2001) |
| SFG | ||
| NGC 34 | 39 | Lutz et al. (2004) |
| NGC 7714 | 2.6 | Ueda et al. (2005) |
| NGC 1614 | 3.6 | Ueda et al. (2001) |
| NGC 3310 | 17.4 | Ueda et al. (2001) |
| BCDg | ||
| Mrk 930 | 0.161 | González et al. (2009) |
Another interesting point is the fact that Br is produced mostly inside the hydrogen ionised region, while the H2 emission originates in a warm semi-ionised region (Aleman & Gruenwald, 2011) around the hydrogen recombination and in the photodissociation region (PDR), where H is mostly neutral. SFGs typically have lower 1-0 S(1)/Br ratios than AGNs. This may indicate that the region that produces the H2 emission in AGNs is larger than in SBs, if we consider that AGN spectra are harder than SFG’s. Harder ionisation spectra may produce a more extended semi-ionised region (Aleman & Gruenwald 2004, 2007), which favours the formation and emission of H2. In our models, the ratio H2 1-0 S(1)/Br is within the range 10-3 H2 1-0 S(1)/Br 10 (see Sec. 4), with the higher ratios ( 1) occurring in models with 1.0 and the smallest values ( 10-2) occurring for 1.5 (in fact, the emission of these last objects are below the detection limit of our observations). Furthermore, denser and/or dustier models typically have higher ratios. A more detailed discussion on these models will be made in a forthcoming work (Aleman et al., in preparation).
6 Concluding Remarks
We present NIR spectroscopy (0.8m — 2.4m) of seven SFGs and nine LINERs to discuss the distribution and excitation of the emitting H2 and [Fe ii] gas in emission-line galaxies. These data were analysed together with similar AGN data of two previous publications (Rodríguez-Ardila et al., 2004, 2005). The whole data set constitutes the most complete and homogeneous sample of such kind of objects observed in the NIR to date. Our main conclusions are:
-
•
H2 is common within the inner few hundred parsecs of emission-line galaxies, regardless of type. However, the molecular gas follows different kinematics than that of the ionised gas, suggesting that the two emissions are not co-spatial. For example, it is clear that the H2 lines are narrower than the forbidden lines, especially for [S iii]. This could be interpreted as if the latter is broadened by the gravitational influence of the SMBH in the AGNs. Furthermore, LINERs tend to have [S iii] significantly broader than [Fe ii] and H2 compared to SFGs. The fact that H2 FWHM is unresolved in almost all objects implies that the molecular gas is probably not gravitationally bound to the SMBH but to the gravitational potential of the galaxy following a different kinematics than that of the classical NLR gas. In addition, IFU data and rotation curves derived for H2 and published by other authors for objects in common with our sample support this hypothesis and point to a scenario where H2 may be arranged in a disc-like structure on the galaxy plane.
-
•
We have computed new photoionisation models for clouds ionised by AGN and stars, which provided fluxes of the H2 lines. We use a diagnostic diagram with H2 IR line ratios to study the excitation mechanisms of H2. The thermal excitation plays an important role not only in AGNs, but also in SFG galaxies. This hypothesis is further supported by the similarity between the vibrational and rotational temperatures of H2 in some objects, and the tendency of to be higher than in others. In SFGs, the importance of the thermal excitation may be associated with the presence of SNRs close to the region emitting H2 lines.
-
•
With our extended sample, of 65 objects, we have confirmed that the diagram involving the line ratios H2 2.121m/Br and [Fe ii] 1.257m/Pa is an efficient tool for separating emission-line objects according to their dominant degree of activity and should be useful for classifying objects with hidden AGNs or highly reddened objects. We also provide improved limits to the line ratio intervals for each activity type, as follows: (i) SFGs [Fe ii] 1.257m/Pa 0.6 and H2 2.121m/Br 0.4, (ii) AGNs 0.6 [Fe ii] 1.257m/Pa 2 and 0.4 H2 2.121m/Br 6, and (iii) LINERs [Fe ii] 1.257m/Pa 2 and H2 2.121m/Br 6,
-
•
A positive correlation is found in the diagnostic diagram involving the above ratios, interpreted as being a more likely an apparent correlation, since different mechanisms drive the production of either [Fe ii] or H2 according to the level of nuclear activity. It is not discarded that a combination of X-ray heating from the central source (in AGNs) plus shock heating (radio jet and NLR gas interaction) and/or SNRs can simultaneously drive the emission of [Fe ii], supporting this correlation in LINERs and SFGs.
Acknowledgements
We thank an anonymous referee for valuable comments that helped to improve the text. R.R. thanks to FAPERGs (ARD 11/1758-5), CNPq (304796/2011-5) and Instituto Nacional de Ciência e Tecnologia em Astrofísica - INCT-A, funded by CNPq and FAPESP. ARA acknowledges CNPq (308877/2009-8) for partial support to this work. I.A. acknowledges support from CAPES/PRODOC and FAPESP (Proc. 2007/04498-2). OLD is grateful to the FAPESP for support under grant 2009/14787-7. This research has made use of the NASA/IPAC Extragalactic Database (NED) which is operated by the Jet Propulsion Laboratory, California Institute of Technology, under contract with the National Aeronautics and Space Administration.
References
- Aleman & Gruenwald (2004) Aleman, I. & Gruenwald, R., 2004, ApJ, 607, 865
- Aleman & Gruenwald (2011) Aleman, I. & Gruenwald, R., 2011, A&A, 528, A74
- Aleman et al. (2012) Aleman, I., Gruenwald, R., Riffel, R., Pastoriza, M. G., & Ardilla, A., 2012, in preparation
- Alloin & Galliano (2002) Alloin, D., Galliano, E., 2002, A&A, 393, 43
- Alonso-Herrero et al. (1997) Alonso-Herrero, A., Rieke, M. J., Rieke, G. H., & Ruiz, M., 1997, ApJ, 482, 747
- Alonso-Herrero et al. (2000) Alonso-Herrero, A., Rieke, M. J., Rieke, G. H., Shields, J. C., 2000, ApJ, 530, 688
- Antonucci & Miller (1985) Antonucci, R. R. J., Miller, J. S., 1985, ApJ, 297, 621.
- Balzano (1983) Balzano, V. A., 1983, ApJ, 268, 602.
- Black & van Dishoeck (1987) Black, J. H., & van Dishoeck, E. F., 1987, ApJ, 322, 412
- Blietz et al. (1994) Blietz, M., et al., 1994, ApJ, 421, 92
- Braatz et al. (1994) Braatz, J. A., Wilson, A. S., & Henkel, C., 1994, ApJ, 437, L99
- Bradt et al. (1978) Bradt, H. V., Burke, B. F., Canizares, C. R., et al., 1978, ApJL, 226, 111
- Cardelli et al. (1989) Cardelli, J. A., Clayton, G. C., & Mathis, J. S., 1989, ApJ, 345, 245
- Cappi et al. (2006) Cappi, M.; Panessa, F.; Bassani, L.; Dadina, M.; Di Cocco, G.; Comastri, A.; della Ceca, R.; Filippenko, A. V.; Gianotti, F.; Ho, L. C.; Malaguti, G.; Mulchaey, J. S.; Palumbo, G. G. C.; Piconcelli, E.; Sargent, W. L. W.; Stephen, J.; Trifoglio, M.; Weaver, K. A., 2006, A&A, 446, 459.
- Cid Fernandes et al. (2004) Cid Fernandes, R.; González Delgado, R. M.; Schmitt, H.; Storchi-Bergmann, T.; Martins, L. P.; Pérez, E.; Heckman, T.; Leitherer, C.; Schaerer, D., 2004, ApJ, 605, 105.
- Cid Fernandes et al. (2005) Cid Fernandes, R.; González Delgado, R. M.; Storchi-Bergmann, T.; Martins, L. P.; Schmitt, H., 2005, MNRAS, 356, 270.
- Cid Fernandes et al. (2010) Cid Fernandes, R.; Stasińska, G.; Schlickmann, M. S.; Mateus, A.; Vale Asari, N.; Schoenell, W.; Sodré, L., 2010, MNRAS, 403, 1036.
- Condon et al. (2002) Condon, J. J.; Cotton, W. D.; Broderick, J. J., 2002, AJ, 124, 675.
- Contini et al. (2002) Contini, M., Radovich, M., Rafanelli, P., Richter, G. M., 2002, ApJ, 572, 124
- Colina (1993) Colina, L., 1993, ApJ, 411, 565
- Cushing et al. (2003) Cushing, M. C., Vacca, W. D., & Rayner, J. T., 2003, PASP, submitted.
- Dale et al. (2004) Dale, D. A., et al., 2004, ApJ, 601, 813
- Davies et al. (2005) Davies, R. I., Sternberg, A., Lehnert, M. D., Tacconi-Garman, L.E. 2005, ApJ, 633, 105.
- Davies et al. (2009) Davies, R. I.; Maciejewski, W.; Hicks, E. K. S.; Tacconi, L. J.; Genzel, R.; Engel, H. 2009, ApJ, 702, 114.
- Dors et al. (2012) Dors, O. L., Jr.; Riffel, Rogemar A.; Cardaci, M. V.; Hägele, G. F.; Krabbe, A. C.; Pérez-Montero, E.; Rodrigues, I., 2012, MNRAS, 422, 252.
- Draine & Lee (1984) Draine, B. T. & Lee, H. M., 1984, ApJ, 285, 89
- Eracleous et al. (2010) Eracleous, M.; Hwang, J. A.; Flohic, H. M. L. G.2010, ApJ, 711, 796
- Ferruit et al. (2000) Ferruit, P.; Wilson, A. S.; Mulchaey, J., 2000, ApJS, 128, 139.
- Filho et al. (2004) Filho, M. E.; Fraternali, F.; Markoff, S.; Nagar, N. M.; Barthel, P. D.; Ho, L. C.; Yuan, F., 2004, A&A, 418, 429.
- Forbes & Ward (1993) Forbes, D. A., & Ward, M. J., 1993, ApJ, 416, 150
- González-Martín et al. (2009) González-Martin, O.; Masegosa, J.; Márquez, I.; Guainazzi, M.; Jiménez-Bailón, E., 2009, A&A, 506, 1107.
- González Delgado et al. (2004) González Delgado, R. M.; Cid Fernandes, R.; Pérez, E.; Martins, L. P.; Storchi-Bergmann, T.; Schmitt, H.; Heckman, T.; Leitherer, C., 2004, ApJ, 605, 127.
- González et al. (2009) Rosa González, D.; Terlevich, E.; Jiménez Bailón, E.; Terlevich, R.; Ranalli, P.; Comastri, A.; Laird, E.; Nandra, K., 2009, MNRAS, 399, 487.
- Gonçalves et al. (1997b) Gonçalves, A. C.; Veron, P.; Veron-Cetty, M.-P., 1998, A&AS, 127, 107.
- Grevesse & Anders (1989) Grevesse, N. & Anders, E., 1989, in Cosmic abundances of matter, AIP Conference Proceedings, Vol. 183, ed. C. J. Waddington, New York, American Institute of Physics, p. 1.
- Gruenwald & Viegas (1992) Gruenwald, R. & Viegas, S. M., 2011, ApJS, 78, 153
- Gratadour et al. (2003) Gratadour, D., Clénet, Y., Rouan, D., Lai, O., Forveille, T., 2003, A&A, 411, 335
- Guainazzi et al. (2005) Guainazzi, M.; Matt, G.; Perola, G. C., 2005, A&A, 444, 119.
- Goodrich et al. (1994) Goodrich, R. W., Veilleux, S., & Hill, G. J., 1994, ApJ, 422, 521
- Ho et al. (1997a) Ho, L. C., Filippenko, A. V., Sargent, W. L., Peng, C. Y., 1997a, ApJS, 112, 391.
- Ho et al. (1997b) Ho, L. C. Filippenko, A. V.; Sargent, W. L., 1997b, ApJS, 112, 315.
- Hollenbach & McKee (1989) Hollenbach, D., & McKee, C. F., 1989, ApJ, 342, 306
- Imanishi et al. (1998) Imanishi, M., Terada, H., Goto, M., & Maihara, T., 1998, PASJ, 50, 399
- Imanishi & Dudley (2000) Imanishi, M.; Dudley, C. C., 2000, ApJ, 545, 701.
- Imanishi & Wada (2004) Imanishi, M.; Wada, K., 2004, ApJ, 617, 214.
- Ivanov et al. (2000) Ivanov, V. D., Rieke, G. H., Groppi, C. E., Alonso-Herrero, A., Rieke, M. J., Engelbracht, C. W., 2000, ApJ, 545, 190.
- Kawara et al. (1988) Kawara, K., Nishida, M., & Taniguchi, Y., 1988, ApJ, 328, L41
- Korista et al. (1997) Korista, K.; Baldwin, J.; Ferland, G.; Verner, D., 1997, ApJS, 108, 401.
- Yan & Blanton (2012) Yan & Blanton 2012, ApJ, 747, 61
- Izotov & Thuan (2011) Izotov, Yuri I.; Thuan, Trinh X., 2011, ApJ, 734, 82.
- Young et al. (1961) Young, Judith S.; Devereux, Nicholas A., 1991, ApJ, 373, 414
- Knop et al. (1996) Knop, R. A., Armus, L., Larkin, J. E., Matthews, K., Shupe, D. L., & Soifer, B. T., 1996, AJ, 112, 81
- Knop et al. (2001) Knop, R. A., Armus, L., Matthews, K., Murphy, T. W., Soifer, B. T., 2001, AJ, 122, 764
- Kwan (1977) Kwan, J., 1977, ApJ, 216, 713
- Laor & Draine (1993) Laor, A. & Draine, B. T., 1993, ApJ, 402, 441
- Lenzuni et al. (1989) Lenzuni,P., Natta, A., & Panagia, N. 1989, ApJ, 345, 306
- Li (2007) Li, A., 2007,SP Conf. Ser. 373, The Central Engine of Active Galactic Nuclei, ed. L. C. Ho & J.-M. Wang, San Francisco, ASP, p. 561
- Landi et al. (2010) Landi, R.; Bassani, L.; Malizia, A.; Stephen, J. B.; Bazzano, A.; Fiocchi, M.; Bird, A. J., 2010, MNRAS, 403, 945
- Larkin et al. (1998) Larkin, J. E., Armus, L., Knop, R. A., Soifer, B. T., & Matthews, K., 1998, ApJS, 114, 59
- Leitherer et al. (1995) Leitherer, C.; Ferguson, H. C.; Heckman, T. M.; Lowenthal, J. D., 1995, ApJ, 454L, 19.
- Lepp & McCray (1983) Lepp, S., McCray, R., 1983, ApJ, 269, 560
- Lutz et al. (2004) Lutz, D., Maiolino, R., Spoon, H. W. W., Moorwood, A. F. M., 2004, A&A, 418, 465
- Malaguti et al. (1999) Malaguti, G., Bassani, L., Cappi, M., Comastri, A., di Cocco, G., 1999, A&A, 342L, 41
- Maloney et al. (1996) Maloney, P. R., Hollenbach, D. J., & Tielens, A. G. G. M., 1996, ApJ, 466, 561
- Martini et al. (1997) Martini, P., Sellgren, K., & Hora, J., 1997, ApJ, 484, 296
- Markowitz et al. (2007) Markowitz, A.; Takahashi, T.; Watanabe, S.; Nakazawa, K.; Fukazawa, Y.; Kokubun, M.; Makishima, K.; Awaki, H.; Bamba, A.; Isobe, N.; Kataoka, J.; Madejski, G.; Mushotzky, R.; Okajima, T.; Ptak, A.; Reeves, J. N.; Ueda, Y.; Yamasaki, T.;Yaqoob, T., 2007, ApJ, 665, 209.
- Mathis et al. (1977) Mathis, J. S., Rumpl, W., & Nordsieck, K. H. 1977, ApJ, 217, 425.
- Mazzalay et al. (2012) Mazzalay, X.; Saglia, R. P.; Erwin, Peter; Fabricius, M. H.; Rusli, S. P.; Thomas, J.; Bender, R.; Opitsch, M.; Nowak, N.; Williams, Michael J., 2012, arXiv:1210.4171
- Mizutani et al. (1994) Mizutani, K.; Suto, H.; Maihara, T., 1994, ApJ, 421, 475.
- Moore et al. (1996) Moore, D., Cohen, R. D., Marcy, G. W., 1996, ApJ, 470, 280
- Moorwood et al. (1988) Moorwood, A. F. M., & Oliva, E., 1988, A&A, 203, 278
- Mouri et al. (1990) Mouri, H., Kawara K., Taniguchi, Y., Nishida, M., 1990, ApJ, 356, L39.
- Mouri et al. (1993) Mouri, H., Kawara, K., & Taniguchi, Y., 1993, ApJ, 406, 52
- Mouri (1994) Mouri, H., 1994, ApJ, 427, 777
- Mouri et al. (2000) Mouri, H., Kawara, K., & Taniguchi, Y., 2000, ApJ, 528, 186
- Müller Sánchez et al. (2009) Müller Sánchez, F.; Davies, R. I.; Genzel, R.; Tacconi, L. J.; Eisenhauer, F.; Hicks, E. K. S.; Friedrich, S.; Sternberg, A.
- Nandra et al. (2007) Nandra, K.; O’Neill, P. M.; George, I. M.; Reeves, J. N., 2007, MNRAS, 382, 194
- Neumayer et al. (2007) Neumayer, N.; Cappellari, M.; Reunanen, J.; Rix, H.-W.; van der Werf, P. P.; de Zeeuw, P. T.; Davies, R. I., 2007, ApJ, 671, 1329.
- Osterbrock (1989) Oterbrock, D. E., 1989, Astrophysics of Gaseous Nebulae and Galactic Nuclei, (Mill Valley: Univ. Sci.)
- Pareira-Santaella et al. (2010) Pereira-Santaella, Miguel; Diamond-Stanic, Aleksandar M.; Alonso-Herrero, Almudena; Rieke, George H., 2010, ApJ, 725, 2270.
- Prieto et al. (2010) Prieto, M. A.; Reunanen, J.; Tristram, K. R. W.; Neumayer, N.; Fernandez-Ontiveros, J. A.; Orienti, M.; Meisenheimer, K., 2010, MNRAS, 402, 724.
- Quillen et al. (1999) Quillen, A. C., Alonso-Herrero, A., Rieke, M. J., Rieke, G. H., Ruiz, M., & Kullarni, V., 1999, ApJ, 527, 696
- Rayner et al. (2003) Rayner, J. T., Toomey, D. W., Onaka, P. M., Denault, A. J., Stahlberger, W. E., Vacca, W. D., Cushing, M. C., & Wang, S., 2003, PASP, 155, 362
- Reunanen et al. (2002) Reunanen, J., Kotilainen, J. K., & Prieto, M. A., 2002, MNRAS, 331, 154
- Reunanen et al. (2003) Reunanen, J., Kotilainen, J. K., & Prieto, M. A., 2002, MNRAS, 343, 192
- Riffel et al. (2006a) Riffel, R.; Rodríguez-Ardila, A.; Pastoriza, M. G., 2006a, A&A, 457, 61.
- Riffel et al. (2006b) Riffel, Rogemar A.; Storchi-Bergmann, Thaisa; Winge, Claudia; Barbosa, Fausto K. B., 2006b, MNRAS, 373, 2
- Riffel et al. (2008a) Riffel, Rogemar A.; Storchi-Bergmann, T.; Winge, C.; McGregor, P. J.; Beck, T.; Schmitt, H., 2008a, MNRAS, 385,1129.
- Riffel et al. (2008b) Riffel, R.; Pastoriza, M. G.; Rodríguez-Ardila, A.; Maraston, C., 2008b, MNRAS, 388, 803.
- Riffel & Storchi-Bergmann (2011a) Riffel, Rogemar A.; Storchi-Bergmann, Thaisa, 2011a, MNRAS, 411, 469.
- Riffel & Storchi-Bergmann (2011b) Riffel, Rogemar A.; Storchi-Bergmann, Thaisa, 2011b, MNRAS, 417, 2752.
- Riffel et al. (2012) Rogemar. A. Riffel, Thaisa Storchi-Bergmann, Rogério Riffel, Miriani G. Pastoriza, Alberto Rodríguez-Ardila, Oli L. Dors Jr, Jaciara Fuchs, Marlon R. Diniz, Schönell, A. J. Junior, Moiré G. Hennig, Carine Brum, arXiv: 1212.0395
- Rigolopoulou et al. (2002) Rigolopoulou, D., Kunze, D., Lutz, D., Genzel, R., & Moorwood, A. F. M., 2002, A&A, 389, 374
- Rodríguez-Ardila et al. (2004) Rodríguez-Ardila, Pastoriza, M. G., Viegas, S. M., Sigut, T. A. A., Pradhan, A. K., 2004, A&A, 519, 425, 457.
- Rodríguez-Ardila et al. (2005) Rodríguez-Ardila, A.; Riffel, R.; Pastoriza, M. G., 2005, MNRAS, 364, 1041.
- Rodríguez-Ardila & Viegas (2003) Rodríguez-Ardila, A.; Viegas, S. M., 2003, MNRAS, 340, 33.
- Schinnerer et al. (1999) Schinnerer, E., Eckart, A., Tacconi, L. J., 1999, ApJ, 524, L5
- Schlegel et al. (1998) Schlegel, D. J.; Finkbeiner, D. P.; Davis, M.,1998, ApJ, 500, 525
- Schulz et al. (2003) Schulz, H., & Henkel, C., 2003, A&A, 400, 41
- Schmitt et al. (2006) Schmitt, H. R.; Calzetti, D.; Armus, L.; Giavalisco, M.; Heckman, T. M.; Kennicutt, R. C., Jr.; Leitherer, C.; Meurer, G. R., 2006, ApJ, 643, 173.
- Scoville et al. (1982) Scoville, N. Z., Hall, D. N. B., Kleinmann, S. G., Ridgway, S. T., 1982, ApJ, 459, 535
- Simpson et al. (1996) Simpson, C., Forbes, D. A., Baker, A. C., & Ward, M. J., 1996, MNRAS, 283, 777
- Shi et al. (2006) Shi, L.; Gu, Q. S.; Peng, Z. X., 2006, A&A, 450, 15.
- Shu et al. (2007) Shu, X. W.; Wang, J. X.; Jiang, P.; Fan, L. L.; Wang, T. G.2007ApJ…657..167
- Shupe et al. (1998) Shupe, D. L., et al., 1998, ApJ, 498, 267
- Sternberg & Dalgarno (1989) Sternberg, A., & Dalgarno, A., 1989, ApJ, 338, 197
- Storchi-Bergmann et al. (2005) Storchi-Bergmann, T.; Nemmen, R. S.; Spinelli, P. F.; Eracleous, M.; Wilson, A. S.; Filippenko, A. V.; Livio, M., 2005, ApJ, 624L, 13.
- Storchi-Bergmann et al. (2009) Storchi-Bergmann, T.; McGregor, P. J.; Riffel, Rogemar A.; Simões Lopes, R.; Beck, T.; Dopita, M., 2009, MNRAS, 394,1148.
- Storchi-Bergmann et al. (2010) Storchi-Bergmann, T.; Lopes, R. D. Simões; McGregor, P. J.; Riffel, Rogemar A.; Beck, T.; Martini, P., 2010, MNRAS, 402, 819.
- Storchi-Bergmann et al. (2012) Storchi-Bergmann, Thaisa; Riffel, Rogemar A.; Riffel, Rogerio; Diniz, Marlon R.; Borges Vale, Tiberio; McGregor, Peter J., 2012, arXiv:1206.4014
- Stasińska & Szczerba (1999) Stasińska G. & Szczerba R., 1999, A&A, 352, 297
- Sturm et al. (1999) Sturm, E., et al., 1999, ApJ, 512, 197
- Sturm et al. (2002) Sturm, E., Lutz, D., Verma, A., Netzer, H., Sternberg, A., Moorwood, A. F. M., Oliva, E., Genzel, R., 2002, A&A, 393, 821
- Sturm et al. (2006) Sturm, E.; Rupke, D.; Contursi, A.; Kim, D.-C.; Lutz, D.; Netzer, H.; Veilleux, S.; Genzel, R.; Lehnert, M.; Tacconi, L. J.; Maoz, D.; Mazzarella, J.; Lord, S.; Sanders, D.; Sternberg, A., 2006, ApJ, 653, 13.
- Tielens (2005) Tielens A. G. G. M., 2005, The Physics and Chemistry of the Interstellar Medium, (Cambridge, UK: Cambridge University Press)
- Turner et al. (1977) Turner, J., Kirby-Docken, K., Dalgarno, A., 1977, ApJS, 35, 281
- Turner & Pounds (2010) Turner, T. J. & Pounds, K. A., 1989, MNRAS, 240, 833.
- Ueda et al. (2001) Ueda, Y.; Ishisaki, Y.; Takahashi, T.; Makishima, K.; Ohashi, T., 2001, ApJS, 133, 1
- Ueda et al. (2005) Ueda, Y.; Ishisaki, Y.; Takahashi, T.; Makishima, K.; Ohashi, T., 2005, ApJS, 161, 185
- Ulvestad & Wilson (1983) Ulvestad, J. S., Wilson, A. S., 1983, ApJL, 264, 7
- Ulvestad & Wilson (1984) Ulvestad, J. S., Wilson, A. S., 1984, ApJ, 285, 439
- Vacca et al. (2003) Vacca, W. D., Cushing, M. C., & Rayner, J. T., 2003, PASP, 155, 389
- Veilleux & Osterbrock (1987) Veilleux, S., Osterbrock, D. E., 1987, ApJS, 63, 295
- Veilleux et al. (1995) Veilleux, S.; Kim, D.-C.; Sanders, D. B.; Mazzarella, J. M.; Soifer, B. T., 1995, ApJS, 98, 171.
- Veilleux et al. (1997) Veilleux, S., Goodrich, R. W., & Hill, G. J., 1997, ApJ, 477, 631
- Weaver et al. (1995) Weaver, K. A., Mushotzky, R. F., Serlemitsos, P. J., Wilson, A. S., Elvis, M., Briel, U., 1995, ApJ, 442, 597
- Wilson et al. (1993) Wilson, A. S., Braatz, J. A., Heckman, T. M., Krolik, J. H., & Miley, G. K., 1993, ApJ, 419, L61