Measurement from Partial Reconstruction
Martino Margoni
on behalf of the BaBar Collaboration
Università di Padova and INFN sezione di Padova
Padova, ITALY
Proceedings of CKM 2012, the 7th International Workshop on the CKM Unitarity Triangle, University of Cincinnati, USA, 28 September - 2 October 2012
Abstract
We present a new measurement of violation induced by oscillations, based on the full data set collected by the BABAR experiment at the PEPII collider. We use a sample of about 6 million decays selected with partial reconstruction of the meson. The charged lepton identifies the flavor of the first meson at its decay time, the flavor of the other is determined by kaon tagging. We determine the parameter .
1 Introduction
The two-mass eigenstates of the neutral meson system, carrying mass and , are expressed in terms of the flavor eigenstates, and , as .
If is violated in mixing, the probability of a to oscillate to a is different from the probability of a to oscillate to a and thus we expect to observe a sizeable value for the asymmetry:
| (1) |
where .
Any deviation from unity of the ratio would imply that the mass eigenstates are not eigenstates (“mixing-induced violation”). The Standard Model prediction is [1]. A large deviation from would be therefore a clear evidence of New Physics beyond the Standard Model.
2 Analysis Method
We present a measurement based on the partial reconstruction of decays (hereafter ). A state decaying as a () meson produces a positive (negative) charge lepton. The observed asymmetry between the number of positive-charge and negative-charge leptons is therefore:
| (2) |
where [2] is the integrated mixing probability for mesons, and is the charge asymmetry in the reconstruction of decays.
We use kaons from decays of the other () to tag its flavor (). A state decaying as a () meson results most often in a (). If mixing takes place, the and the have then the same electric charge. The observed asymmetry in the rate of mixed events is:
| (3) |
where is the charge asymmetry in kaon reconstruction. A kaon with the same charge as the might also come from the Cabibbo-Favored (CF) decays of the meson produced with the lepton from the partially reconstructed side (). The asymmetry observed for these events is:
| (4) |
3 Extraction of
The data sample used in this analysis consists of an integrated luminosity of 425.7, corresponding to 468 million pairs, collected at the resonance by the BABAR detector.
We select a sample of partially reconstructed mesons by retaining events containing a charged lepton () and a low momentum pion (soft pion, ) from the decay . The lepton momentum must be in the range and the soft pion candidate must satisfy . Throughout the paper the momentum, energy and direction of all particles are computed in the rest frame.
Using conservation of momentum and energy, the invariant mass squared of the undetected neutrino is calculated as where is half the total center-of-mass energy and and are the energy and momentum of the lepton (the meson). The four-momentum can be computed by approximating its direction as that of the soft pion, and parameterizing its momentum as a linear function of the soft-pion momentum. We select pairs of tracks with opposite electric charge for our signal () and we use same-charge pairs () for background studies.
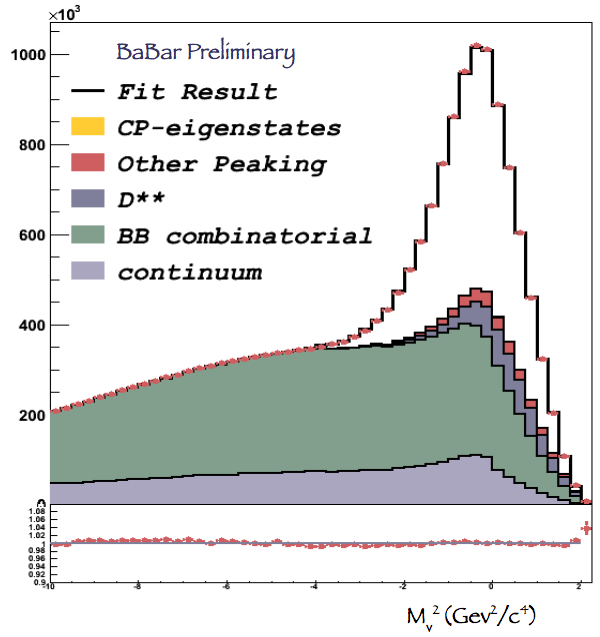
We determine the number of signal events in our sample with a minimum fit to the distribution in the interval GeV2/c4. A total of peaking events are found. The result of the fit is displayed in Fig.1.

We define , where is the projection along the beam direction of the decay point, and is the projection along the same direction of the intersection of the track trajectory with the beam-spot. We measure the proper-time-difference between the two mesons using the relation , where the parameters express the Lorentz Boost from the laboratory to the rest frame.
We distinguish from using proper-time difference and kinematic informations. Due to the short lifetime and small boost of the meson, small values of are expected for the . The and the are emitted at large angles in the rest frame of the decaying : therefore the angle between the and the has values close to , and cos close to . The corresponding distribution for the is uniform.
The measurement proceeds in two steps. We first measure the sample composition of the eight tagged samples defined by lepton type, lepton charge and charge, with the fit to described above. The results of the first stage are used in the second stage, where we perform a binned maximum likelihood fit to a two-dimensional PDF obtained as a product of the and cos( functions.
The distributions for events are parameterized as the convolutions of the theoretical distributions with the resolution function : , where is the actual difference between the times of decay of the two mesons and is the vector of the physical parameters.
The resolution function consists of the superposition of several Gaussian functions convolved with exponentials. We use a different set of parameters for peaking and for combinatoric events.
To describe the distributions for events, , we select a sub-sample of data containing less than 5% decays, and we use the background subtracted histograms in our likelihood.
The individual cos() shapes are obtained from the histograms of the simulated distributions for events, separately for and events.
Events belonging to each of the eight tagged samples are grouped in 100 bins, 25 bins, 4 cos bins, and 5 bins. We further split data in five bins of momentum, , to account for the dependencies of several parameters, describing the resolution function, the cos distributions, and the fractions of events, observed in the simulation.
The rate of events in each bin () and for each tagged sample are then expressed as the sum of the predicted contributions from peaking events, combinatorial and continuum background.
Accounting for mistags and events, the peaking contributions to the equal-charge samples are:
| (5) |
where the reconstruction asymmetries are computed separately for the and samples. We allow for different mistag probabilities for () and ().
The parameters describe the fractions of tags in each sample in terms of the kaon momentum. A total of 171 parameters are determined in the fit.
After unblinding we find: .
We consider several sources of systematic errors: uncertainties on the composition of the peaking and the combinatorial samples, on the description of the and the eigenstate distributions, and on the and parameters. Parameterized simulations are used to check the estimate of the result and its statistical uncertainty. The difference between the nominal result and the average of those obtained from pseudo-experiments is included in the total systematic uncertainty as well as the statistical error of a validation test performed using the simulation.
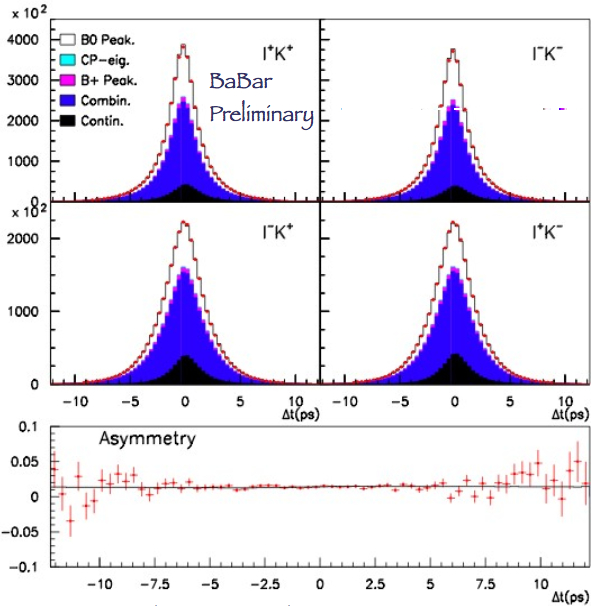
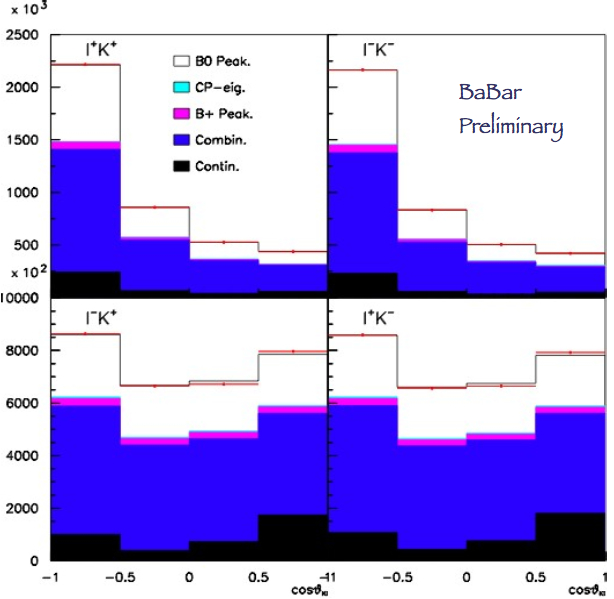
Fig. 2 shows the fit projections for and cos.


In summary, we present a new precise measurement of the parameters governing violation in oscillations. With a partial reconstruction and tagging we find and These results are consistent with and more precise than the -factories results from dilepton measurements. No deviation is observed from the SM expectation [1].
References
- [1] A. Lenz, arXiv:1102.4274.
- [2] J. Beringer et al., (Particle Data Group), Phys. Rev. D86, 010001 (2012).