The Relationship Between the Dense Neutral and Diffuse Ionized Gas in the Thick Disks of Two Edge-On Spiral Galaxies 11affiliation: Based on Observations obtained with the NASA/ESA Hubble Space Telescope operated at the Space Telescope Science Institute, which is operated by the Association of Universities for Research in Astronomy, Inc., under NASA contract NAS5-26555. Also, based on data acquired using the Large Binocular Telescope (LBT). The LBT is an international collaboration among institutions in the US, Italy, and Germany. LBT Corporation partners are the University of Arizona, on behalf of the Arizona university system; Instituto Nazionale do Astrofisica, Italy; LBT Beteiligungsgesellschaft, Germany, representing the Max Planck Society, the Astrophysical Institute of Postdam, and Heidelberg University; Ohio State University, and the Research Corporation, on behalf of the University of Notre Dame, the University of Minnesota, and the University of Virginia. Also, based on observations obtained by the WIYN Observatory which is a joint facility of the University of Wisconsin-Madison, Yale University, Indiana University, and the National Optical Astronomy Observatories.
Abstract
We present high-resolution, optical images (BVI H) of the multiphase interstellar medium (ISM) in the thick disks of the edge-on spiral galaxies NGC 4013 and NGC 4302. Our images from the Hubble Space Telescope (HST), Large Binocular Telescope, and WIYN 3.5-m reveal an extensive population of filamentary dust absorption seen to kpc. Many of these dusty thick disk structures have characteristics reminiscent of molecular clouds found in the Milky Way disk. Our H images show the extraplanar diffuse ionized gas (DIG) in these galaxies is dominated by a smooth, diffuse component. The strongly-filamentary morphologies of the dust absorption have no counterpart in the smoothly distributed H emission. We argue the thick disk DIG and dust-bearing filaments trace physically distinct phases of the thick disk ISM, the latter tracing a dense, warm or cold neutral medium. The dense, dusty matter in the thick disks of spiral galaxies is largely tracing matter ejected from the thin disk via energetic feedback from massive stars. The high densities of the gas may be a result of converging gas flows. This dense material fuels some thick disk star formation, as evidenced by the presence of thick disk H II regions.
Subject headings:
dust, extinction – galaxies: individual (NGC 4013, NGC 4302) – galaxies: ISM – galaxies: spiral – galaxies: structure – ISM: clouds1. Introduction
The feedback of energy and matter from stars to the interstellar medium (ISM) plays a central role in the evolution of galaxies. It impacts the physical/thermal state of the ISM, affecting the ability of the gas to form stars and affects the galactic-scale star formation by ejecting material from the thin disk or altogether from a galaxy (e.g., Dekel & Silk 1986). Most disk galaxies with sufficient star formation rates (or star formation rate surface densities), show extended “thick disks” of warm interstellar matter extending kpc away from the galaxy mid-plane (Rossa & Dettmar 2003a, 2003b). The presence of a thick disk ISM supported against gravity is a direct result of energetic feedback processes (although some additional material may be contributed through infalling matter; see Sancisi et al. 2008). Thus, the study of the statistical properties (e.g., Rossa & Dettmar 2003a, 2003b; Howk & Savage 1999) and detailed physics (e.g., Haffner et al. 2009) of the thick disk ISM can help us understand the role that feedback plays in disk galaxies.
The energetic processes that expel gas from the thin disk also act on the solid phase of the ISM, interstellar dust grains. This has been utilized to study the physical structure as well as the phase structure of the thick disk ISM (Howk & Savage 1997, 1999, 2000; Alton et al. 2000, Thompson et al. 2004). While the energetic expulsion of matter from the disk can impact the dust-to-gas ratio through dust destruction, the fact that prevalent extraplanar dust is seen in of normal spiral galaxies (Rossa & Dettmar 2003a; Howk & Savage 1999) and even in galactic superwinds such as seen in M82 (Kaneda et al. 2010; Roussel et al. 2010; Engelbracht et al. 2006; Hoopes et al. 2005; Scarrott et al. 1991) demonstrates that dust can survive the ejection from the thin disk. In fact, the detection of thick disk dust via the extinction it produces against background starlight in direct broadband images of edge-on galaxies is the most observationally efficient method for detecting extraplanar interstellar matter (Howk & Savage 2000).
The first detailed discussion of the implications of extraplanar dust was in the Howk & Savage (1997) (hereafter HS97) study of the nearby edge-on spiral galaxy NGC 891, although the presence of high- dust clouds in this galaxy were noted earlier (Keppel et al. 1991; Sandage 1961). HS97 showed that the thick disk of NGC 891 was threaded with a network of dusty clouds and filaments observed to heights up to kpc. The most remarkable implication of this work was that the individual dust-bearing clouds have very large masses, often in excess of . Howk & Savage (1999) (hereafter HS99) subsequently surveyed a group of nine nearby edge-on spiral galaxies, demonstrating that high- dust is found in many galaxies and is correlated with the presence of extraplanar diffuse ionized gas (DIG) seen in H imaging. Subsequently, Rossa & Dettmar (2003a, 2003b) showed that of a much larger sample of spiral galaxies exhibit extraplanar dust and verified the correlation between the presence of extraplanar dust and DIG emission. HS99 and Howk & Savage (2000; hereafter HS00) argued that the gas traced by extraplanar extinction features represented a much denser medium than that seen in H emission, with densities an order of magnitude or more higher than DIG material (see also Keppel et al. 1991). The extraplanar dust clouds and filaments, which are not spatially correlated with the DIG, are only visible because they have significantly higher extinction – and likely higher column densities and particle densities – than their surroundings. HS00 hypothesized that the dust structures trace a cold, neutral medium (CNM) in the thick disk based on the large column densities, particle densities, and masses of the clouds.
This conclusion was motivated in part by a detailed comparison of the extraplanar dust filaments and DIG emission by HS00, which demonstrated that they were tracing independent structures in the thick disk ISM of NGC 891.111Keppel et al. (1991) reached the same conclusion on the basis of densities estimated for the DIG and extraplanar dust features. Following the study of NGC 891, Thompson et al. (2004; hereafter THS04), used the Hubble Space Telescope (HST) to investigate the extraplanar dust in the edge-on galaxy, NGC 4217. These authors indicate that in addition to the smoother distribution of the H emission morphology compared to the extraplanar dust structures, they find little spatial correlation between areas of enhanced H emission around regions of concentrated OB associations and high- dust structures. Rossa et al. (2004) similarly used images from (HST) to show the ISM traced by extraplanar dust was distinct in morphology from the DIG in NGC 891, while Rossa & Dettmar (2003a, 2003b) argued for a similar arrangement in their larger sample of galaxies. The dusty extraplanar filaments are physically distinct from the DIG, even though the presence of these two tracers of the extraplanar ISM is strongly correlated (Rossa & Dettmar 2003b; HS99). The small scale structures in the HS00 and subsequent Rossa et al. (2004) imaging, the high column densities ( in many cases), large cloud masses, and high particle densities ( cm-3; HS00, Howk 2005) are all features in great contrast to the other observed phases of the thick disk ISM and point to a denser, cooler medium than the DIG. Thus, HS00 concluded that all of the thermal phases of the ISM found in the thin disks of spiral galaxies were also present in their thick disks.
The only galaxy for which a detailed comparison of the H (DIG) and extraplanar dust morphologies has been undertaken is NGC 891. While the structures traced by these two probes of the extraplanar ISM were almost completely distinct in NGC 891, the universality of the result is not settled. In particular, H images of the DIG are often taken at relatively low spatial resolution, in part due to the faintness of the emitting gas, while the dust structures are lost to confusion at similar resolution. NGC 891 has one of the brightest known H-emitting DIG layers (e.g., Rand 1996, Miller & Veilleux 2003) and has more prominent filaments within the DIG than many galaxies (Heald et al. 2007). For galaxies with lower star formation rates, where the brightness of the DIG and the prominence of filaments diminishes, are there corresponding changes in the extraplanar dust? In this work we present high-resolution images of extraplanar dust and DIG in the edge-on galaxies NGC 4013 and NGC 4302. Our broadband images include observations from HST that elucidate the smallest scale structures in the dusty thick disk, while our H images are among the highest spatial resolution acquired from the ground and have good continuum subtraction. We use these images to extend the detailed comparison of extraplanar dust and DIG properties to these two galaxies, which have fainter DIG emission and a smaller fraction of the emission arising in filaments (i.e., a larger proportion coming from the smooth DIG component). In the end we find no strong physical connection between the DIG and the structures traced by high-contrast dust absorption in these galaxies, similar to what is seen in NGC 891. The DIG and dust-laden clouds trace fundamentally different material in the thick disk.
Our work is organized as follows. We discuss the observations and data reduction in §2. In §3 we discuss the properties of the extraplanar dust and associated gas, while in §4 we describe the properties of the extraplanar H emission (DIG). In §5 we provide a direct comparison of the extraplanar dust morphologies and the DIG detected in H. We discuss in §6 the origins, nature, and properties of the multiphase ISM in both NGC 4013 and NGC 4302 and summarize the major results of our work in §7.
2. Observations and Reductions
The work in this paper is based on optical imaging of two galaxies – NGC 4013 and NGC 4302 – whose properties are listed in Table 1. We use broadband and narrow-band imaging from several sources: 1) HST/Wide Field Planetary Camera 2 (WFPC2)) images of both galaxies in the (WFPC2) equivalents of the BVI bands to study extraplanar dust absorption at the highest resolution; 2) ground-based broadband images of NGC 4013 and NGC 4302 taken with the WIYN 3.5-m and LBT 28.4-m telescopes, respectively, to study extraplanar dust at larger radial and vertical distances from the galaxy centers than allowed by HST; and 3) narrow-band H imaging of the extraplanar DIG in these galaxies, taken with the WIYN 3.5-m, to study the connection (or lack thereof) between the ionized gas and material traced by dust absorption in the thick disks of these galaxies. We discuss the processing of these datasets in this section.
2.1. HST/WFPC2 Observations and Processing
We obtained broadband imaging observations of NGC 4013 and NGC 4302 with the Wide Field Planetary Camera 2 (WFPC2) aboard HST. WFPC2, described fully in Biretta et al. (2002), consists of four cameras. The three Wide Field Cameras (WFCs) together cover an “L”-shaped region 150″150″ with intrinsic spatial sampling of per pixel (f/12.9). The Planetary Camera (PC) covers a 34″34″ square field with per pixel (f/28.3).
Our observations, summarized in Table 2, were acquired as part of GO program 8242 (PI: Savage). We imaged the majority of the galaxy NGC 4302 in one pointing, while we used two separate pointings to cover a significant fraction of NGC 4013. For NGC 4302 and one of the NGC 4013 pointings, we acquired eight exposures in the F450W filter and four exposures in each of the F555W and F814W filters. We obtained four images in each of the three filters for the secondary NGC 4013 pointing. The F450W, F555W, and F814W filters roughly correspond to the Johnson-Cousins B, V, and I bands222We chose the F450W filter as the B-band equivalent because it has a higher over-all throughput than the F439W filter; the transformation to the standard Johnson-Cousins system is well-behaved (see Holtzman et al. 1995)..
The images acquired for each pointing were split equally between two dithered sub-positions, with a linear dither step of 3.5 WF CCD pixels between the positions. We used the Dither II package and its drizzle algorithms (see Fruchter et al. 1998 and Fruchter & Hook 1997) to combine the dithered images onto a finer grid, following THS04. The resulting cosmic ray-cleaned images have an angular sampling of per pixel.

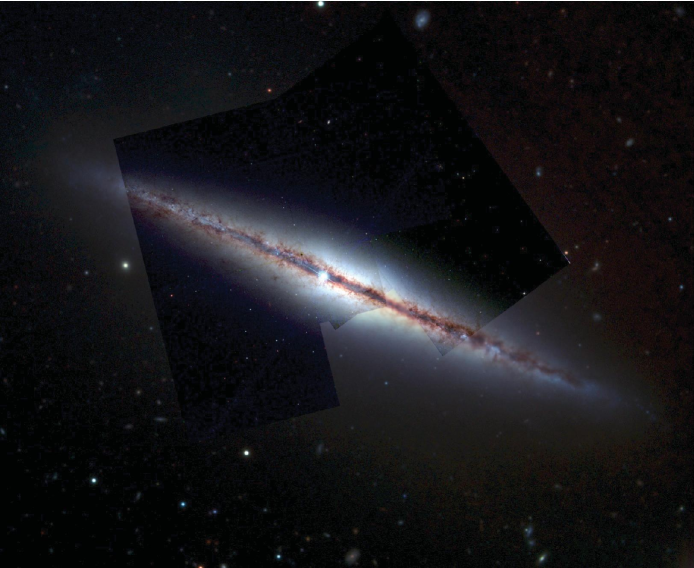
Figures 1 and 2 show composite color images of NGC 4013 and NGC 4302, respectively, created from the WFPC2 BVI images. The WFPC2 images have been combined with ground-based observations in these images. The ground-based images are more sensitive to faint, extended structures (i.e., the faint thick disk stellar emission) and probe a larger field of view. For NGC 4013, the ground-based data are from the WIYN 3.5-m telescope and are discussed in §2.2. The ground-based observations of NGC 4302 were obtained with the 28.4-m Large Binocular Telescope (LBT) and are described in §2.3.
2.2. WIYN Observations and Processing
To study the distribution of the diffuse ionized gas in these galaxies, we acquired narrow-band H and Gunn images of NGC 4013 and NGC 4302 at the WIYN 3.5-m telescope at Kitt Peak National Observatory. These data were collected on 2004 April 18 and 19 (UT) under non-photometric conditions using the WIYN Tip-Tilt Module (WTTM), although without the tip-tilt functionality enabled. A log summarizing the WIYN observations is given in Table 3, including the total exposure time in each filter and the seeing-limited resolution in the final images for each galaxy.
The WTTM 333The WTTM instument described here: http://www.noao.edu/wiyn/WTTM_manual.html. is an optical re-imaging system working at f/7.43. This system feeds a EEV CCD with m pixels. Each pixel subtends on the sky giving a field of view that is vignetted at the corners. The data acquisition, calibration, and reduction of the images were done in a manner similar to that described in HS00. We note that because the field of view of the imager is relatively small compared with the galaxies themselves, the sky background subtraction is somewhat uncertain. None of our conclusions are sensitive to this problem; however, it precludes us from, e.g., properly deriving scale heights of the diffuse ionized gas in these galaxies.
We derived the astrometric plate solution for our images using a grid of stars whose coordinates were measured in the Digitized Sky Survey for the NGC 4302 observations. These agree well with the HST-provided plate solution for the WFPC2 data. The rms error in using the plate solution to derive coordinates is always significantly less than 10. For the NGC 4013 observations, this treatment of the data left a systematic offset between the WIYN and HST data. Due to a lack of DSS-detected stars in the small WFPC2 field, we used stars and galaxies in common between the WFPC2 and WIYN images to bring the WIYN data onto the same reference frame as the HST data. The BVI imaging of NGC 4013 was obtained with the previous generation WIYN Imager, the S2KB Camera. The properties and reductions of these data are as those discussed in HS00. These data are also summarized in Table 3.
The principal purpose of our ground-based WIYN observations is to study the distribution of H emission from the DIG in these galaxies. The WIYN W15 filter was used as an on-band H filter. This filter, centered at Å with a FWHM of Å, contains emission from the H and nearby [N II]444While the images contain both H and [N II] emission, for brevity’s sake we will hereafter refer to our images as H images. The reader should be aware that the bandpass also contains the [N II] transitions. lines plus a stellar continuum contribution. We used the Gunn observations to estimate the stellar continuum and subtract it from the narrow-band images, scaling the band images so that faint Milky Way foreground stars were completely removed from the H images after continuum subtraction. Non-saturated foreground stars and background galaxies are well subtracted in our final line images. We found no evidence for a need to adopt a different scale factor for the bulge of the galaxies compared with the outer disks of the galaxies (e.g., Rand 1996). The Gunn filter used for the continuum estimate encompasses the H line itself and may lead to slight over-subtraction of the line emission. This has little impact on the current paper, in which we limit ourselves to morphological considerations.
2.3. LBT Observations and Processing
We obtained broadband UBVI images of NGC 4302 with the Large Binocular Cameras (LBCs) on the 28.4-m LBT under non-photometric conditions on 2008 May 03. A log summarizing the LBT observations is given in Table 4 including the total exposure time in each filter and the seeing-limited resolution in the final images for NGC 4302. The LBT uses two co-pointed 8.4-m mirrors to feed a pair of nearly-identical LBCs. The LBCs are described in Giallongo et al. (2008). The two cameras operate simultaneously at prime focus, one optimized for blue wavelengths and the other for red (both can provide V-band imaging, the approximate cross-over in sensitivity). Each camera provides a field of view using a four CCD mosaic with pixels. Inter-chip spacings are filled in by dithering the telescope over several exposures. A log of our observations is given in Table 4. We used the LBC-Blue camera to image NGC 4302 in the U and B filters, while the LBC-Red camera provided coverage of in the V and I filters. We use twilight sky exposures to perform the flat field corrections.
Reduction of the LBC images requires combining a series of dithered images, taking into account the distortions that occur over the very wide field of view. We largely follow the techniques described in Sand et al. (2009) using modified versions of scripts from B. Weiner et al. (in preparation). The data are processed in two steps. The first uses standard reductions from the IRAF package mscred to trim and remove the overscan region, subtract bias frames, and apply flat fields (derived from twilight flats). Subsequently, we used the SCAMP (Bertin 2002) and SWARP (Bertin et al. 2002) software packages555http://www.astromatic.net/ to produce the final images. SCAMP was used to derive the astrometric solution for each of the chips in each image. The final solution is based on cross-matching sources identified in the LBT images using SExtractor (Bertin & Arnouts 1996) with an astrometric catalog derived from DR7 of the Sloan Digital Sky Survey (SDSS-DR7; Abazajian et al. 2009). This is a necessary step due to the distortions over the full field given the focal ratio. The absolute astrometric calibration has an rms dispersion compared with SDSS of across the entire field of view. The individual images were subsequently resampled and coadded using SWARP.
3. The Dusty Thick Disks of NGC 4013 and NGC 4302
Visual inspection of Figures 1 and 2 reveals the presence of strong, patchy extinction in the thick disks of these two galaxies. Filaments and clouds of absorbing material are seen to nearly the radial edge of the galaxies’ optical disks and to -heights approaching the largest distances to which stellar light can be seen in the relatively shallow WFPC2 images, although the ground-based LBT and WIYN images reveal the dust extinction extends to lesser heights than the stellar thick disk. This extraplanar extinction is a direct tracer of the thick disk ISM in these galaxies (e.g., Howk 2005). In order to be seen, these dusty regions must have higher column densities than their surroundings with these filaments having excess extinction compared with nearby sight lines, providing significant contrast between these clouds and their local environment in our images. Smoothly distributed dust does not produce such contrast; thus a diffusely distributed component of dust may exist undetected in the thick disks of these galaxies. That the column densities of the observed dust-bearing clouds are higher than their surroundings almost certainly implies the dust features seen in our images have significantly higher volume densities than their surroundings, as well.
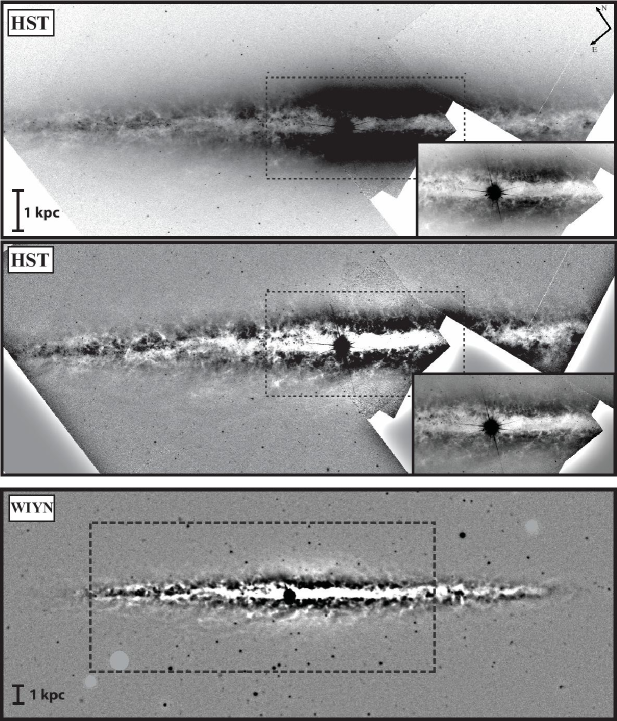
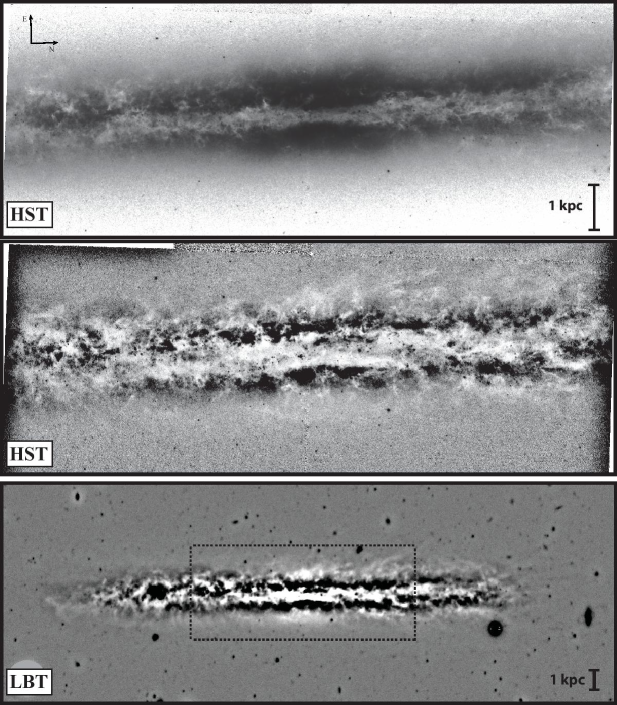
Figure 3 shows the HST and WIYN V-band images of NGC 4013. The top panel shows the HST V-band data and the middle panel shows the unsharp masked version of the top panel. The display of the galaxy in the top panel is not able to show the absorbing clouds against the bulge and further out in a single display, making the unsharp masking necessary. The unsharp masked versions of our images remove the large-scale gradients in the underlying stellar light, revealing structure on scales smaller than the smoothing kernel (FWHM pc) (see HS00 and THS04 for detailed discussions of this approach). We only use these images for display and have taken care to assess and minimize masking-related artifacts. Both HST images include insets showing the central bulge region with a stretch that shows the dust absorption more clearly. The bottom panel shows the unsharp masked display of our final WIYN data. The WIYN image gives almost full radial coverage of the galaxy, revealing extraplanar dust structures extending along nearly the entire radial length of the disk of NGC 4013. Extraplanar dust clouds can be identified against the background stellar light z kpc from the midplane. Those dust clouds at the largest heights show less prominent substructure and generally have lower values, but they are still well detected in our WIYN images. We see no evidence for disparities in the amount of extraplanar dust comparing opposite sides of the plane.
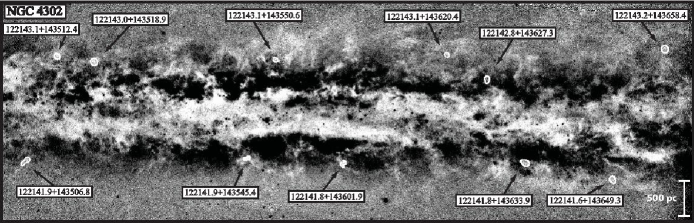
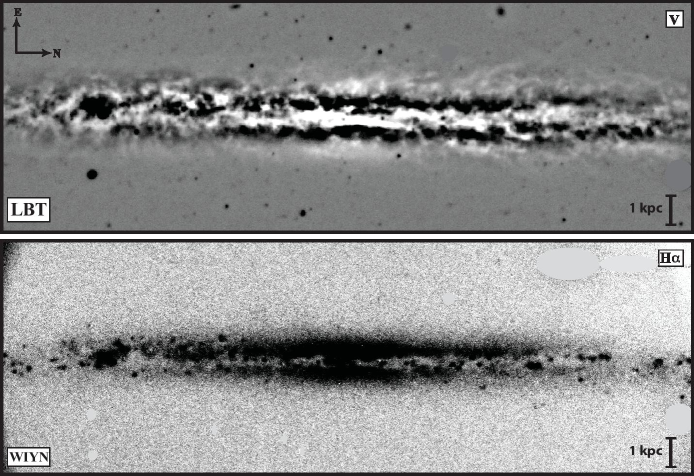
Similarly, Figure 4 shows the HST and LBT V-band images for NGC 4302. The top panel shows the HST V-band data and the middle panel shows the unsharp masked version of the top panel. The HST images cover kpc projected radial distance from the center on either side, while the LBT images show kpc radial span of the optical disk and more. The dashed box in the LBT V-band indicates the extend of the HST image shown in the upper panels. Extraplanar dust clouds can be identified against the background stellar light z kpc from the midplane, detected in the LBT images. The FHWM of the Gaussian used to produce the unsharp masked images for NGC 4302 were the same as in NGC 4013.
3.1. Quantifying Dust Extinction
Using the HST V-band data for our measurements (top panels of Figure 3 and 4) and following HS00 and THS04, we provide spatially-averaged estimates of the apparent opacities of a small number of extraplanar dust structures. From these we derive the “apparent” extinction, column densities, particle density, and masses of these dust-bearing structures. We define the “apparent” extinction, , for a given wave band as
| (1) |
here is the average surface brightness measured toward a dust cloud (dc), and is the surface brightness of the local background (bg). Defined in this way, the apparent extinction is a lower limit to the true extinction, , because includes both extincted starlight from behind as well as unextincted light emitted in front of the feature. One can, in theory, use for multiple wavelengths with an assumed extinction curve to estimate the fraction of light originating in front of the dust feature (e.g., Gallagher & Hunter 1981, Knapen et al. 1991, HS97). In this case, the fraction of arising in front of the clouds is and the true extinction is a function of and . However, HS00 found that this approach does not always lead to self-consistent results, likely due to the effects of spatial averaging of probing differing depths into clouds at different wavebands and of scattering. HS97 (who used a narrower range of wavelengths) provided evidence for a significant amount of stellar light arising in front of the dust clouds in NGC 891.
Here we follow HS00 and THS04 in assuming (equivalent to assuming ). This has the advantage that our calculations of the physical properties of the structures seen in our images will provide lower limits to the true properties. HS00 discuss the degree to which departs from this assumption for several values of . For example, for , the V-band extinction . We do not report the extinction in the other bands.
For each dust feature we measure the ratio of surface brightnesses using intensity distributions measured vertically or horizontally, with respect to the disk, averaging the results for a given cloud. We estimated the background surface brightness appropriate for each feature by fitting a spline to the intensity distribution of the star light in each cut. This technique is different than that used in our previous works where we were more concerned with the impact of the smearing due to the seeing. The current measurements will average the values over more of the clouds than those earlier measurements, leading to somewhat smaller extinction values.
3.2. Physical Properties of Individual Dust Structures
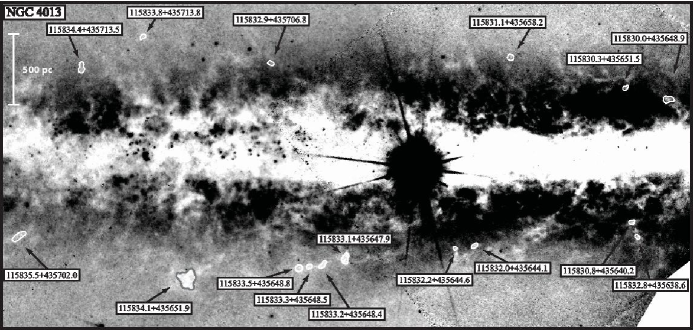
Table 5 summarizes the physical properties of several cloud complexes in the thick disks of the two target galaxies from the HST V-band data. Figures 5 and 6 identify the clouds discussed in Table 5, they are displayed in the unsharp-masked WFPC2 images to better show the small-scale features of the selected clouds. Several measured quantities are given, including their positions, physical dimensions, height above the midplane, and values. Estimates of the column densities, densities, and masses associated with the clouds are also given, as outlined below. In this work we have favored small, relatively isolated structures in order to study the densities implied by the small-scale structure observed in the WFPC2 imaging. The choice to work with isolated clouds tends to favor lower extinction clouds at relatively large . The smaller sizes (to emphasize high densities) tend to favor lower masses.
The values of in Table 5 are in the range 0.1–0.3 mag. These values represent spatial regions of the clouds lower than the values appropriate for the cores of the structures. Given the values of are also lower than the true extinction, realistic values of for much of the clouds are likely significantly larger than those values given in Table 5.
Transforming the apparent extinctions discussed above into physical properties of the clouds requires an assumption about the gas-to-dust relationship in the thick disk. Following earlier works, we assume the clouds follow dust to gas relationships appropriate for the disk of the Milky Way (HS97, HS99, HS00). This is a necessary step for estimating the physical conditions of the dust features from the measured apparent extinctions, one whose consequences are discussed at length in HS00. We adopt the average relationship between total hydrogen and the color excess of diffuse clouds in the Galactic disk as estimated by Bohlin et al. (1978): atoms cm-2 mag-1. To relate this to the extinction, we assume , roughly the mean for diffuse clouds in the Galactic disk (e.g., Cardelli et al. 1989). This gives the total hydrogen (H I + H2) column density from the apparent extinction:
| (2) |
The inequality arises since . Since both NGC 4013 and NGC 4302 are relatively massive spiral galaxies, the assumption of a Milky Way gas-to-dust ratio will probably yield a reliable estimate of the associated gas column density. However, if significant dust destruction has occurred in any particular feature, the derived will be an underestimate, while if the dust has been separated from the gas then will be an overestimate. We favor scenarios in which little dust destruction occurs in moving the dust from the thin to thick disk or where some destruction has occurred in which the dust is separated from the gas. We thus quote the column densities as lower limits.
We give lower limits to the masses of for the features in Table 5, calculated as , where is the projected area of the dusty clouds. We assume to correct for the contribution to the mass from helium and the heavy elements. The definition of the cloud areas is a critical and highly-subjective component of the mass estimates. In the present work we have favored small clouds and have been conservative in our derivation of the projected areas. The implied masses should be treated as lower limits.
In addition to the columns and masses, we also include a very crude density estimate in Table 5. This estimate assumes the clouds we see are largely cylindrically-symmetric such that , where is the width of the minor axis of the clouds. The only support for this assumption is the general prevalence of filamentary absorbing structures seen in our images, although this impression could be affected by the general confusion caused by overlapping clouds along the line of sight. In general the morphologies of the absorbing clouds are complex, but we move forward using this simplistic assumption for estimating the densities.
Keeping in mind the uncertainties discussed above, the properties of the clouds summarized in Table 5 are nonetheless intruiging. The features all have estimated columns cm-2, simply as a matter of selection (it is difficult to identify clouds with ). We infer cloud masses for all but the smallest two clouds in Table 5, and the densities implied for those clouds included in the table are of order cm-3. Additionally, we examined some of the darkest narrow filaments in the WFPC2 images located in regions too confused to show well in Figures 5 and 6, so they are not included in Table 5. Several of these clouds have column densities approaching or exceeding cm-2, giving mean densities cm-3, which is extraordinary for thick disk clouds.

The column densities and densities measured for the thick disk clouds in NGC 4013 and NGC 4302 are similar to those seen in NGC 891 and NGC 4217 (HS97, HS00, THS04, Howk 2005). The derived densities likely depend on the resolution with which one observes the structures, as higher resolution images not only smear less background light into the structure but also allow the identification of smaller-scale filaments. The masses given in Table 5 are smaller than have been reported in earlier works (HS99 HS00, THS04), but that is largely a function of our newly adopted measurement technique and the choices we have made for emphasizing the smaller subcomponents rather than the largest complexes. Complexes of absorption with implied total masses well in excess of certainly exist in these galaxies. Overall, we do not see any clear evidence that the dust-bearing thick disk clouds in these galaxies are significantly different in character than those seen in NGC 891 (HS00) or NGC 4217 (THS04).
3.3. Apparent morphologies of dust-bearing gas clouds
Our images allow us to identify large-scale dust-bearing clouds in the thick disks of these galaxies and study their internal structure. Our high angular resolution HST images reveal substructure within the cloud complexes, down to the limit of our resolution, but only for the inner sections of both galaxies. Our LBT and WIYN data allow us to identify dust clouds at larger radial and vertical distances due to their greater field of view and depth compared with the HST images. Similar to clouds in the Milky Way, in which structure is seen on many scales, the thick disks of NGC 4013 and NGC 4302 contain narrow filamentary structures, large complexes of clouds (specifically in NGC 4302), as well as small, very dense clouds seen to our resolution limit.
3.3.1 NGC 4013
The extraplanar dust-bearing clouds in NGC 4013 are generally highly structured filaments, although we see a broad range of morphologies in both the HST and WIYN images in Figure 3. The typical dust filaments are pc by a few pc in size (see Table 5 and Figure 3). We note that the dust filaments are unlikely to be associated with a flare in the outer galaxy (see detailed discussion in HS99, HS00) or as a result of the warp in NGC 4013, which is perpendicular to our line of sight (Bottema 1996) and therefore would not give rise to the symmetrical distribution of clouds seen in our images.
There is a strong preference for the highest- absorbing structures (z kpc) in NGC 4013 to appear bent toward the northeast, especially on the eastern side of the galaxy (see bottom panel in Figure 3). Such an arrangement could occur if there is a rotational lag that increases with height (e.g. Heald et al. 2007). This is consistent with the sense of rotation of NGC 4013, with the southwest side receding from us (Bottema 1996). NGC 4013 is a member of the spiral-rich Ursa Major group of galaxies. Ursa Major is considered a loose group with no central concentration and no sign of strong H I deficiencies, suggesting this group lacks a strong intracluster medium (Angiras et al. 2007). As a member of the Ursa Major group, NGC 4013 is relatively isolated. Thus the bending of filaments is not likely the result of movement through an intracluster medium in this case (Martínez-Delgado et al. 2009). We find no evidence for obvious supershell structures in NGC 4013, although identifying such structures within the complex distribution of clouds might be difficult.
We see a set of very large-scale complexes of dust above and below the bulge of the galaxy in Figure 3. These large dust complexes, traced out to z kpc on either side of the bulge, show significant small-scale structure within them, including dense clouds similar to those cometary shaped clouds identified in HS00. Figure 7 shows one of these complexes to the southeast of the bulge. This large complex ( pc) extends from within pc of the plane, bending toward the east with increasing height above the plane. It shows several cometary-like substructures at heights z pc. Figure 7(b) provides a close-up image of this large complex, which has a mean extinction value of and total mass of order . Figure 7(c) shows two of the the cometary-like clouds, clouds and from Table 5. Contours are included to guide the eye (but are based on the unsharp masked image and are not quantitatively useful). Cloud has a head-tail type structure; the head of the cloud has and implied density cm-3. The association of these cometary structures with the larger complex suggests the complex is interacting with an ambient medium as it falls toward the disk through a corona or outflowing wind from the disk.
All of the head-tail clouds we see in NGC 4013 seem to be associated with larger complexes, like that shown in Figure 7. The head-tail clouds do not seem to be common, although the clouds may still be interacting with an ambient medium. Such morphologies are reminiscent of those seen in some high-velocity clouds (HVCs) passing through the diffuse halo of the Milky Way. Putman et al. (2011) investigated the H I cm emission line morphologies of isolated HVCs, finding only % of them show head-tail morphology, suggesting such morphologies are short lived. If the extraplanar clouds in our images are analogous to the HVCs, those with cometary morphologies may be moving at larger velocities and interacting more strongly with the thick disk ISM. While the HVCs of the Milky Way do not appear to contain dust with the exception of the Magellanic Stream (Lu et al. 1998, Sembach et al. 2001, Richter et al. 2001, Fox et al. 2010), and their origins therefore are different from the thick disk dusty clouds studied here, the physics that dictates the head-tail morphology is likely quite similar. That is, the magnetohydrodynamical processes that shape those cometary structures likely do not strongly depend on the dust content of the clouds.
Our HST images reveal a vast array of small-scale absorbing features with dimensions approaching our resolution limits. The smallest-scale dust structures are smaller than a few pc in size. We have measured the sizes and opacities of a number of these very small structures and estimate they have mag and cm-3. Indeed, each complex exhibits significant substructure. To demonstrate this we show in Figure 8 an expanded view of NGC 4013 cloud , located at z pc from the midplane.
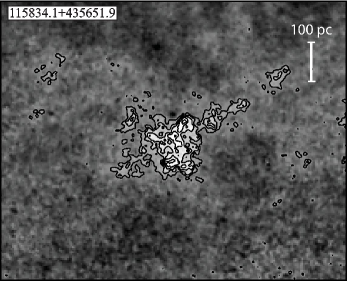
Prominent substructures are clearly seen. The contours in Figure 8 range from . For comparison our spatially-averaged value for this cloud is (Table 5). This demonstrates the impact of our averaging technique when making our measurements. Two particular subclouds which are similar in size and opacity, have mag, implying column densities of cm-2 and particle densities of cm-3. These are lower limits for the column densities and imply that these dust structures have properties similar to Milky Way diffuse clouds, yet are located kpc away from the midplane.
While the dust in highly-structured clouds is most readily apparent in our images, one can find very low-extinction, more diffuse material in the thick disk in our images (particularly the WIYN and LBT images, which have greater sensitivity to low surface brightness fluctuations). The lowest extinction clouds visible in our images of NGC 4013 have mag. If we couple that with a rough measure of the area occupied by these low column density clouds (with very low contrast), the total mass implied in this galaxy is of order M⊙. This is likely similar to the total mass in the population of denser, more readily apparent complexes discussed above (see HS00).
3.3.2 NGC 4302
The extraplanar dust-bearing clouds in NGC 4302 are filamentary with some large dust complexes also notable in the thick disk in both the HST and LBT images in Figure 4. The LBT unsharp masked display (bottom panel of Figure 4) shows extensive extraplanar dust-bearing clouds along the entire length of the plane detectable to z kpc. While large complexes of extraplanar dust are seen on both sides of the planes, the intensity of starlight as a function of shows a clear asymmetry across the plane in the bulge region in NGC 4302. The apparent deficit of starlight at z kpc on the west side of the plane corresponds to a large diffuse complex of dust on this side of the disk. This diffuse complex is not easily seen in the HST unsharp masked images given its size and relatively little substructure, but is visible in the unsharp masked LBT image (bottom panel of Figure 4). This extinction complex on the western side of the bulge area may be the cause for a measured asymmetry in H emission image as well (see §4).
A common characteristic in the majority of extraplanar clouds in NGC 4302 is the apparent bending of the large complexes toward the north at large -height, out to z kpc. This may be connected with the motion of NGC 4302 through the Virgo Cluster, as discussed by Chung et al. (2007). These authors postulate the extensive tail of the H I disk extending along the northern edge of NGC 4302 is due to the galaxy’s motion toward the south as it falls into the Virgo Cluster. Our images may be showing a physical manifestation of this movement through the intracluster medium in the shaping of the largest dust features. We note that NGC 4298, projected close on the sky to NGC 4302, is also located in the Virgo Cluster. NGC 4302 shows no sign of a strong interaction with NGC 4298.
The ratio of thick-disk to thin-disk stellar scale heights is smaller in NGC 4302 than many other edge-on galaxies (as it is in the H; Rand 1996). Combined with the line-of-sight overlap of structures, this makes it difficult to cleanly identify large scale extraplanar dust structures. Our images do not provide strong evidence for any obvious supershells or galactic chimney features extending from the midplane of NGC 4302. Figure 6 shows the unsharp masked HST images of this galaxy with the clouds from Table 5 marked. As in NGC 4013, we see small-scale structures in the dusty clouds in NGC 4302 to the resolution limit of our HST images ( pc). The implied densities of the small-scale clouds range from to cm-3 for the narrowest, darkest thick disk clouds.
Similar to the case of NGC 4013, there are diffuse, lower column density structures seen over a significant amount of the thick disk region of NGC 4302. These tend to have minimum extinctions of mag, implying a total thick disk mass in this more diffuse matter of M⊙.
4. Ionized Gas in the Thick Disks of NGC 4013 and NGC 4302
Extraplanar diffuse ionized gas (DIG) has been previously studied in both NGC 4013 (Rand 1996, Miller & Veilleux 2003) and NGC 4302 (Pildis et al. 1994, Rand 1996, Rossa & Dettmar 2000, Collins & Rand 2001, Heald et al. 2007). We have revisited these galaxies in an effort to achieve higher resolution, greater depth, and/or more consistent continuum subtraction a previous works. Our overall goal is to compare the H and dust morphologies to study their connection in these galaxies, which requires high resolution imagery. We detect thick disk H emission, with resolution, in both galaxies.
4.0.1 NGC 4013
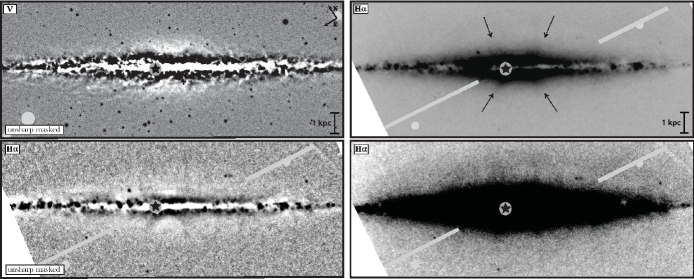
Extraplanar DIG at large -heights can be seen over nearly the whole of the star-forming disk (to R kpc) in NGC 4013 (see the bottom-right panel of Figure 9, which emphasizes the faintest H emission). The extraplanar H emission in NGC 4013 is considerably fainter and shows much less prominent filamentary emission than in NGC 891 (Rand 1996). Rand (1996) gives H emission scale heights of kpc (for the eastern side); however, he also notes significant continuum subtraction difficulties affect his images. Miller & Veilleux (2003) fit a scale height of kpc (for the ”southeastern” side). Figure 9 shows our H images of NGC 4013 in four panels; the top-left panel is an unsharp-masked WIYN V-band image to show the dust absorption at the same resolution as the H emission while the bottom-left panel is an unsharp-masked H image to show the small scale features (as before, the smoothing kernel has FWHM). Both right panels in Figure 9 are H emission, stretched to emphasize the brightest emission (top-right panel) and the faintest emission (bottom-right panel). Our images are consistent with the description of the DIG morphology for NGC 4013 given by Rand (1996): diffuse with few filaments. Over the majority of the disk, the DIG morphology is smooth and lacks bright, narrow filamentary structures like those seen in the H emission of NGC 891 and NGC 5775 (Rand 1996, HS00). What filaments exist in Figure 9 are relatively subtle, the brightest of which have peak intensities of of the local smooth DIG. Even the brightest filaments in NGC 4013 are comparatively fainter than those in NGC 891, which have of the brightness of the local diffuse DIG emission (HS00). Given the faintness of the smooth DIG layer in NGC 4013, the filaments have a much lower absolute intensity as well.
One of the most notable morphological features of the DIG in NGC 4013 is the large “H”-shaped structure emanating from both sides of the bulge region (see Rand 1996). This “H” structure consists of four large-scale filaments present at similar positions on either side of the bulge, at projected radial distances pc and visible in our images to z kpc. Rand (1996) argued this feature was a relic nuclear (bipolar) outflow from an earlier nuclear starburstor AGN. García-Burillo et al. (1999) mapped the “H” structure in CO emission (see their Figure 3) and argued for a close association between the extraplanar DIG filaments and the extraplanar CO emission. Schinnerer et al. (2004) also mapped CO emission from the plane of NGC 4013, connecting the “H” structure in a high-density CO ring in the disk. These works both invoke a superwind outflow as the origin of this structure, in agreement with Rand’s conclusion.
4.0.2 NGC 4302
Figure 10 shows the continuum-subtracted H emission in NGC 4302. The images of this galaxy are not as deep as for NGC 4013, but they have better resolution than most previous H images of this galaxy (Pildis 1994, Rand 1996, Rossa & Dettmar 2000, 2003a, 2003b). NGC 4302 has one of the faintest detectable DIG layers (Rand 1996, Rossa & Dettmar 2000) Collins & Rand (2001) measure the emission scale height kpc. Rand (1996) characterizes the extraplanar DIG morphology of NGC 4302 as “faint and diffuse”; our images are consistent with both of those characterizations. In our images the thick disk DIG is smoothly distributed within the first z kpc of the plane, but only within R kpc and kpc radially from the bulge in northern and southern halves of the galaxy, respectively. The H emission abruptly decreases to undetectable levels at larger radii. We detect slightly brighter extraplanar DIG on the eastern side compared to the western side of the galaxy, most notably around the bulge region. This asymmetry is also seen in continuum star light and is due to enhanced extinction from large extraplanar dust complexes on the western side of the plane at z kpc (discussed in §3.3). We find no bright plumes or filamentary structures. There are some very weak DIG filaments, the brightest of which measure only above the local (very faint) diffuse background. Thus, the DIG in NGC 4302 shows little to no structure or filaments, and what substructure is detected seems to be the result of dust extinction affects.
Dettmar (1995) and Heald et al. (2007) found that the presence of H emission in NGC 4302 was weak and diffuse, especially in comparison to NGC 891, although both galaxies have prominent extraplanar dust. Our H images are the highest resolution available for both NGC 4013 and NGC 4302 and show both have smoothly distributed DIG layers with much less prominent filaments than the DIG of NGC 891 and even less than NGC 5775 (Rand 1996, HS00). Both NGC 4013 and NGC 4302 also have comparably weaker H emission than NGC 891 and NGC 5775, which are known for their bright H emission and have larger DIG emission scale heights (Collins & Rand 2001). Thus the galaxies can be ranked in order of decreasing DIG scale height: NGC 5775, NGC 891, NGC 4013, NGC 4302. This is the same order one would have if ranking by decreasing H intensity and decreasing prominence of DIG filaments.
5. The Relationship Between Extraplanar Ionized Gas and Dust
NGC 4013 and NGC 4302 show both dust and DIG in the thick disk. Is there any relationship between the physical structures probed by these tracers of the thick disk ISM? NGC 891 is the only galaxy for which a detailed comparison between the dust-bearing cloud structures and the DIG in the thick disk has been made at high resolution, although several works have noted the distinct morphologies of thick disk dust and DIG in NGC 891 (Dettmar 1990, HS97, HS00, Rossa & Dettmar 2003a, 2003b, Rossa et al. 2004, THS04). Howk & Savage (HS00) argued the dusty clouds in the thick disk of NGC 891 trace a dense medium, in part because of these differing morphologies. They also estimated typical densities for the extraplanar dust-bearing clouds of cm-3, significantly higher than DIG structures at any distance from the midplane. Furthermore, HS00 found very few cases where structures traced in H emission and dust absorption could be even loosely associated. They found no direct physical connection between the extraplanar dust-bearing structures and the DIG seen in H emission. Rossa et al. (2004) reached the same conclusion after comparing the thick disk dust extinction and H emission in high resolution HST imaging of NGC 891. Keppel et al. (1991) also noted the emission measure from clouds as dense as those probed by the extraplanar dust should be much higher than that observed from the DIG in NGC 891, suggesting the dusty clouds trace a different medium.
Our observations allow us to explore the relationship between extraplanar dust extinction and H emission at high resolution in two additional galaxies. Extraplanar dust filaments are very prominent in the thick disk of both galaxies, whereas the extraplanar DIG layer lacks prominent filaments or structures in both. Figures 9 and 10 show the H emission images on the same physical scales as the broadband ground based images, allowing for a direct comparison of the dense thick disk dust cloud structures and the H emitting DIG structures.
In NGC 4013 we see filamentary dust structures in the thick disk in our broadband HST and WIYN images along the entire radial length of the galaxy, with extensive and highly-structured dust filaments seen near the bulge region. Our images show absorbing dust structures out to heights z kpc on both sides of the plane of NGC 4013. On the largest scales, the extraplanar dust and DIG show distinct distributions. The DIG is relatively smooth with weak and few filaments. The DIG filaments that do exist are not reflected in the dust. The large extraplanar dust complexes themselves are not directly identifiable in the H emission. The lack of a morphological connection between extraplanar dust clouds and the DIG is consistent between the largest and smallest scales in NGC 4013.
In NGC 4302 we come to the same conclusion: the morphologies of the absorbing dust structures and H emitting structures show no obvious physical relationship. In NGC 4302 our broadband images show filamentary dust-bearing clouds extending to kpc along the length of the galaxy. The thick disk DIG layer has very few filamentary structures and is smoothly distributed along the inner R(north) kpc and R(south) kpc; at larger R the extraplanar H emission quickly disappears. This drop-off in the DIG emission contrasts with the behavior of the extraplanar dust filaments, which are seen extending to large -heights to nearly the edge of the optical disk. The H morphology we see in NGC 4302 is a result of large dust complexes extinguishing emission, yet no physical DIG structures are traced by any dust filaments seen in our HST and LBT images. Overall, the dust clouds are structured on very small scales and strongly filamentary, while the extraplanar ionized gas is primarily diffuse and smooth.
When comparing the morphologies of the dust and DIG in the thick disk, neither NGC 4013 nor NGC 4302 show evidence for a direct physical relationship between the thick disk dust seen in the broadband images and the extraplanar ionized gas seen in H emission. NGC 4302 shows the strongest contrast in the physical appearance of the dust and DIG as it has one of the weakest extraplanar DIG layers yet has a very dusty thick disk. In a sense, we expect very little connection between the dust structures and DIG given the importance of the smooth components of the DIG in these two galaxies (Rand 1996, Rossa & Dettmar 2000, Heald et al. 2007). The smaller-scale structures in the dust-bearing clouds, their larger column densities, and even the differences in their large-scale distribution emphasize that the dust traces a phase of the thick disk ISM distinct from the DIG.
NGC 4013 and NGC 4302 are two edge-on galaxies that display a lack of a direct physical correlation between thick disk dust and ionized gas. This physical difference between the morphology of the extraplanar DIG and dust is not unique to NGC 891. At the same time, there is a correlation between the presence of extraplanar dust and DIG disks of galaxies. As first noted by HS99 in a small sample of galaxies and subsequently in the much larger survey of Rossa & Dettmar (2003a, 2003b), when DIG is detected in a galaxy, extraplanar dust is also visible 90% of the time. Thus, although there is no evidence for a morphological relationship between the dust and DIG, there is a strong correlation between the presence of extraplanar dust and DIG in galaxies, a result reflected in NGC 4013 and NGC 4302.
6. The Multiphase Thick Disks of Spiral Galaxies
We have presented deep broadband and H images of the edge-on spiral galaxies NGC 4013 and NGC 4302. Our images reveal significant numbers of dusty extraplanar clouds via the extinction they produce against the background thick disk and bulge starlight in both galaxies. These galaxies were chosen in part because the morphology, brightness, and scale height of the DIG emission in these galaxies was significantly different than the other galaxy for which a detailed comparison of the extraplanar dust and DIG is available, NGC 891 (HS00, Rossa et al. 2004). Thus, our program is designed to understand whether the changes in the morphology and properties of the DIG are reflected in any way in the extraplanar dust. While various studies have argued that the thick disk dust absorption is tracing a different medium or phase than the DIG (Keppel 1991, HS99, HS00, Rossa et al. 2004) with distinct morphologies, we are testing whether this dense medium responds at all to the processes that shape the DIG properties.
We find no evidence that the morphologies and properties (quantity, sizes, masses, etc.) of the extraplanar dust-bearing clouds are subject to the strong changes like those seen in the DIG morphologies. Table 7 presents , star formation rate (SFR), and star formation surface density () for NGC 4013 and NGC 4302 in comparison to previously studied edge-on galaxies NGC 5775, NGC 891, and NGC 4217. The star formation surface density (SFR per unit area) SFR/, where /. Ordering these galaxies by SFR (derived from the ) Table 7 shows a connection between the morphology of the extraplanar DIG and the SFR. Thus, as the importance (prominence, brightness, etc.) of the DIG filaments and scale height decrease along the sequence of NGC 5775, NGC 891, NGC 4217, NGC 4013, and NGC 4302, the morphological and physical properties of the observable dust seem to vary little. This is in part a selection effect, since the detection of the extraplanar dust in our images relies on the small-scale structure of the absorbing structures. The thick disk dust is only visible because it is more opaque than its surroundings, and this likely implies the clouds in our images have significantly higher particle densities than their surroundings. However, this also emphasizes our point: the properties of the dust are disconnected from that of the DIG in the thick disk.
In fact, one can see morphological and structural changes in the DIG that are not mirrored in the extraplanar dust within individual galaxies. In NGC 891 the southwest half of the disk has a smaller DIG scale height, with many fewer and less prominent filaments than the northeastern half of the disk (HS00). However, there is relatively little change in the properties and incidence of dust between these regions, save that there are a very few DIG filaments in the northeastern half that are physically related to extraplanar dust structures. (Such an arrangement is only seen in this portion of NGC 891 and in some portions of the strongly-star forming galaxy NGC 4631; see Wang et al. 2001.) Similarly, the present observations show the DIG layer in NGC 4302 cuts off sharply at a projected radial distance from the nucleus of R – kpc, while the extraplanar dust can be seen well beyond these projected radii. Additionally, the thick disk near the bulge region of NGC 4013 shows highly structured filaments whereas the extraplanar DIG morphology is smooth even in the brightest H emission.
Apparently the factors that shape the morphology and quantity of the extraplanar DIG do not affect the dusty extraplanar clouds seen in our images. While there is a strong correlation between the existence of extraplanar DIG and extraplanar dust within a galaxy (HS99, Rossa & Dettmar 2003b), the ionized gas traced by H emission and dense clouds traced in optical continuum absorption have very little to do with one another. What drives this distinct behavior of the DIG and dense, dusty clouds? One possibility is that the SFR or star formation surface density (SFR per unit area) plays a role in shaping the morphology of the DIG layer. Rossa & Dettmar (2003a) found DIG morphology was connected to star formation activity in a galaxy, with the transition from higher to lower or SFR being associated with a progression from DIG with prominent filamentary structures through fainter, more diffuse DIG. The sequence then of NGC 5775, NGC 891, NGC 4217, NGC 4013, to NGC 4302 is one of decreasing SFR as well as decreasing DIG scale height and H filament prominence. While this is a limited sample, we also see changes in star formation affect the DIG morphology on smaller scales. Rossa & Dettmar (2003a, 2003b) note that star formation on the local and global scales were factors in the presence of extraplanar DIG in their survey. For example, the southwestern half of NGC 891 has a smaller DIG scale height and fewer prominent filaments than the northeastern half (HS00) while also having a lower SFR as evidenced by radio continuum and far infrared measurements (Dahlem et al. 1994, Wainscoat et al. 1987). The edges of NGC 4302 beyond the end of the DIG layer are also representative of this trend.
By what mechanism could the star formation or its surface density affect the morphology of the DIG in this way? The answer is unclear. It could be that the filaments seen in the DIG are tracing ionized fragments of supershells whose presence and brightness require very recent star formation in clusters to maintain the ionization, while the smoother DIG component is ionized by longer-lived field OB stars (e.g., Hoopes & Walterbos 2000). However, Rand (1998) found that the bright filaments in NGC 891 did not show unusual line ratios (e.g., [N II]/H, [S II]/H) for the DIG. In fact, the filaments seemed to show the same overall behavior as the more diffuse DIG, with lower forbidden line to H ratios associated with brighter emission. Thus, if the filaments are associated with recent superbubbles, they still share common ionization and excitation characteristics with the general DIG. At this point this assignment of cause is largely speculation. It seems likely that SFR and/or likely play a significant role in not only determining whether a galaxy has significant DIG emission (Rossa & Dettmar 2003a, 2003b, Rand 1996), but also in shaping the DIG structure (Rossa & Dettmar 2003b).
As with the extraplanar DIG, a minimum star formation rate or seems to be required before extraplanar dust is observable (Rossa & Dettmar 2003a, 2003b), but above that threshold there is little discernable effect on the morphology (Table 7). Furthermore, there is no evidence that the positional changes in that modify the DIG morphology affect the dense extraplanar clouds. In comparing the DIG morphology sequence outlined in Table 7 to the dust morphologies, the DIG changes in connection with the SFR, while the extraplanar dust is both present and consistently similar between all of the galaxies. That the dust clouds have little associated H emission likely means they are not directly illuminated by ionizing radiation (Keppel et al. 1991), since they are optically thick to such radiation. Perhaps they have a different evolutionary timescale for production than the DIG (e.g., Alton et al. 2000), and the stars that would have ionized the clouds have already died off. It may also be that they have a distinct radial distribution compared with the DIG. We see only the foreground dust-bearing clouds with the direct imaging techniques, but perhaps there are few such clouds at the smaller radial distances at which the DIG dominates. It is unlikely we could show this without velocity information for the extraplanar dust clouds, which is not likely unless they can be measured through CO emission (e.g., García-Burillo et al. 1999).
Discussions of the origin of the matter making up the dense clouds seen in our images and the phase structure of these clouds have been presented elsewhere (HS97, HS99, HS00, Howk 2005). Here we expand on those discussions briefly to reflect new thinking (both our own and in the literature). The interstellar thick disk clouds seen via their dust absorption within kpc of the midplanes of a number of spiral galaxies are almost certainly dominated by material that has been expelled from the thin disk via stellar feedback, perhaps both mechanical and radiative. In this case, the signpost used to trace the matter – the dust – identifies the clouds as arising from metal-rich material. This has two important implications. First, the great quantities of dust in these clouds implies that they are dominated by metal-rich thin disk matter that has been expelled rather than by infalling (metal poor) matter as invoked to explain the change in DIG rotation curves with (e.g., Fraternali & Binney 2006, Heald et al. 2007).
Second, the presence of dust-rich matter in the thick disk implies that the processes that lift the dust from the thin disk are not so violent that they destroy a large fraction of the dust. If a significant amount of dust is destroyed, the masses calculated for our observed clouds scale upwards. If only 10% of the dust survived the trip to the thick disk the total mass in these clouds would approach the total gas mass of the ISM in these galaxies (HS00), which is unrealistic. The existence of dust in the thick disk fueled by feedback-driven expulsion is clearly not a new discovery. It does not cause difficulties with existing models for galactic fountain-type phenomena. The walls of a supershell may extend to quite large distances from the plane, but much of the mass was incorporated into those walls while the shell expanded relatively slowly (e.g., Weaver et al. 1977) destroying little of the associated dust. Furthermore, it is possible that radiation pressure plays a role in this process (Murray et al. 2011, Franco et al. 1991), which would leave all of the dust intact. A completely independent method of probing the existence of dust surviving far out of the plane is through the infrared wavelengths. NGC 891 has detectable mid-infrared radiation out to kpc, which is dominated by emission from diffuse interstellar dust (Burgdorf, Ashby, & Williams 2007). Thus, extraplanar dust is present many kpc further from the star-forming disk than our images reveal. Its existence to kpc (and even beyond; see Ménard et al. 2010) implies the dust is not all destroyed as it is lifted from the thin disk.
The thick disk clouds traced by the extraplanar dust absorption in our optical images are physically distinct from the DIG. They trace material with densities larger than that of the DIG by an order of magnitude or two. The large gas densities ( cm-3; HS00, Howk 2005, this work) and high gas column densities ( to ) traced by the extraplanar dust are largely consistent with expectations for gas associated with a warm neutral or cold neutral medium. Both are likely present in these clouds, given the level of substructure and evidence for core-halo type structure in some clouds (see also HS00). Although in principle one might be able to use the distribution of apparent extinction in isolated regions of these galaxies to disentangle the relative contributions of these phases, the results are ambiguous given the fitting uncertainties in the background light distribution and the presence of clouds deeper in the galaxy with a larger fraction of unabsorbed starlight.
HS00 and HS99 have argued that the extraplanar dust may to a large degree trace a thick disk CNM based on assessments of the physical properties and a comparison of the cloud masses with Galactic molecular clouds (Blitz 1990, 1991). There is complementary evidence in our work for the presence of a thick disk CNM in the form of the extraplanar CO emission detected in NGC 4013 (García-Burillo et al. 1999) and the probable presence of thick disk H II regions tracing recent star formation (HS00, Rossa & Dettmar 2003a). Candidate thick disk H II regions can be seen in both NGC 4013 and NGC 4302 (point-like knots of H emission visible in Figure 9 and 10). In particular, Figure 9 shows a prominent candidate to the north of the bulge of NGC 4013 (spectroscopy of this nebula is focus of K. Rueff et al., in preparation). Potential areas of star formation suggest a CNM as a component of the thick disk ISM in these galaxies. While the masses of the clouds reported in Table 5 are somewhat lower than those studied in earlier works, this difference is in part due to the conscious choice to study smaller clouds in order to emphasize the small-scale structure revealed by our high resolution images. The properties of the extraplanar dust-bearing structures in our images are consistent with a significant CNM present in the thick disks of these spiral galaxies. However, the fact that the clouds vastly outnumber the H II regions so far identified suggests that the fraction of the former that trace molecular clouds able to support star formation (as opposed to “diffuse clouds” in the Galactic parlance) may be small.
While the thick disk gas traced by these extraplanar dust structures largely originates in the thin disk, the production or maintenance of a thick disk CNM can come about in several ways. HS00 and HS99 discussed the possibility that the CNM is consistent with standard theories for multiphase thermal equilibrium of the ISM (e.g., McKee & Ostriker 1977, Wolfire et al. 1995a,b, Wolfire et al. 2003). Here we add that more dynamical origins may be even more important. As feedback-driven outflows escape from the thin disks of galaxies, they sweep up significant masses of material. Some of this material is compressed at a rate insufficient to shock the gas to high temperatures and/or at a time when the shell walls might radiatively cool. In this case, the shell serves to compress the gas, triggering the formation of a cold or even molecular medium (e.g., McCray & Kafatos 1987). This is, of course, the origin of the self-propagating star formation theories.
In a similar vein, recent work has highlighted the instabilities that can arise in converging flows of neutral material. This can serve to compress and cool the gas (e.g., Heitsch et al. 2008), and the convergence of the walls of adjacent shells may be a trigger for cloud formation (Ntormousi et al. 2011). Our observations of extraplanar dust always show numerous and very complicated structures within the first kpc of the galaxy midplanes, with few readily-identifiable supershells. Some of this is undoubtedly due to line of sight confusion. However, given the difficulty of distinguishing physically connected structures in our images, it is not a stretch to imagine some of the complexity we see in the dust occurs as walls of adjacent supershells or other structures converge. Converging flow-type scenarios provide a sustainable method for forming CNM clouds in the thick disk and for reshaping the structures in a less-ordered fashion. The precise mechanism of the formation of CNM clouds in the thick disk is little constrained by our data. However, we note that the associations of cool (Moss et al. 2012) or even molecular gas (Dawson et al. 2011a,b) with high-latitude supershells in the Milky Way offer supporting evidence that the ejection of the gas from the thin disk may also be in part responsible for triggering the formation of a cool medium. The global characteristics and physical conditions for the material traced by the extraplanar dust in our images suggest the presence of a thick disk CNM in addition to warm neutral and ionized gas. In future works we will explore the thick disk star formation, perhaps from this CNM gas, implied by extraplanar H II regions.
7. Summary
We have presented HST /WFPC2 and ground-based WIYN 3.5-m and LBT m images of the edge-on spiral galaxies NGC 4013 and NGC 4302. These images were used to study the distribution of extraplanar dust and ionized gas in these galaxies. The major results of our work are as follows.
1. Our new images reveal extensive distributions of extraplanar dust clouds in NGC 4302 and NGC 4013, with absorbing structures traced to heights kpc in both galaxies. The thick disk dust-bearing gas clouds are seen in large complexes as well as narrow filaments, with significant substructure seen to the limit of our HST resolution ( pc).
2. We derive the properties of several extraplanar dust clouds in each galaxy (Table 5). We estimate hydrogen column densities for individual dust clouds N(H) cm-2 and masses , with the larger complexes having quite a bit higher masses. The implied particles densities range from cm-3 for the larger clouds, with substructure clouds having even larger densities, cm-3. The properties of these individual absorbing structures lead us to conclude the dust clouds trace a dense phase of the thick disk ISM.
3. Our high-resolution H images show the extraplanar ionized gas layers of both galaxies have a diffuse, smooth distribution, with very few filamentary structures. Candidate thick disk H II regions can be seen in both NGC 4013 and NGC 4302. In NGC 4302, the H emission abruptly cuts off at projected radii of R kpc and kpc in the northern and southern halves of the galaxy, respectively.
4. Comparing the morphologies of the extraplanar dust clouds to the extraplanar DIG emission we find little evidence for a direct physical connection between the dust and the DIG. The dust-bearing clouds are strongly filamentary while the DIG layers lack filaments and are smoothly distributed. The features and physical properties of the extraplanar dust and DIG in NGC 4013 and NGC 4302 are distinct.
5. The thick disk ISM extending kpc away from galactic disks is a multi-phase system, including a dense, cold phase traced by dust extinction and perhaps formed through thermal instabilities and/or in converging flows. This thick disk in NGC 4013 and NGC 4302 is ultimately fueled by galactic fountain-like expulsion from the star-forming thin disk that does not destroy the dust as it raises material to high-.
References
- (1) Abazajian, K.N., et al. 2009, ApJS, 182, 543
- (2) Alton P. B., Xilouris E. M., Bianchi S., Davies J., Kylafis N., 2000, A&A, 356, 795
- (3) Angiras, R. A., Jog, C. J., Dwarakanath, K. S., & Verheijen, M. A. W. 2007, MNRAS, 378, 276
- (4) Bertin, E., & Arnouts, S. 1996, A&AS, 117, 393
- (5) Bertin, E., Mellier, Y., Radovic, M., et al. 2002, ASP Conference Series, Eds. D.A. Bohlender, D. Durand, T.H. Handley, v.281, p.228
- (6) Biretta, J. A., et al. 2002, WFPC2 Instrument Handbook, version 7.0 (Baltimore: STScI)
- (7) Blitz, L. 1991, IAUS, 144, 41
- (8) Blitz, L. 1990, ASPC, 12, 273
- (9) Bohlin, R.C., Savage, B.D., & Drake, J.F. 1978, ApJ, 224, 132
- (10) Bottema, R. 1996, A&A, 306, 345
- (11) Burgdorf, M., Ashby, M. L. N., & Williams, R. 2007, ApJ, 668, 918
- (12) Cardelli, J.A., Clayton, G.C., & Mathis, J.S. 1989, ApJ, 345, 245
- (13) Chung, A., van Gorkom, J. H., Kenney, J. D. P., & Vollmer, B. 2007, ApJ, 659, L115
- (14) Collins, J. A., & Rand, R. J. 2001, ApJ, 551, 57
- (15) Corbelli, E., Bianchi, S., Cortese, L., et al. 2012, A&A, 542, A32
- (16) Dahlem, M., Dettmar, R.-J., & Hummel, E. 1994, A&A, 290, 384
- (17) Dawson, J. R., McClure-Griffiths, N. M., Dickey, J. M., & Fukui, Y. 2011a, ApJ, 741, 85
- (18) Dawson, J. R., McClure-Griffiths, N. M., Kawamura, A., et al. 2011b, ApJ, 728, 127
- (19) Dekel, A., & Silk, J. 1986, ApJ, 303, 39
- (20) Dettmar, R.-J. 1990, A&A, 232, L15
- (21) Dettmar, R.-J. 1995, ASPC, 80, 398
- (22) Engelbracht, C. W., Kundurthy, P., Gordon, K. D., et al. 2006, ApJ, 642, L127
- (23) Fox, A. J., Wakker, B. P., Smoker, J. V., Richter, P., Savage, B. D., & Sembach, K. R. 2010, ApJ, 718, 1046
- (24) Franco, J., Ferrini, F., Barsella, B., & Ferrara, A. 1991, ApJ, 366, 443
- (25) Fraternali, F., & Binney, J. J. 2006, MNRAS, 366, 449
- (26) Fruchter, A. S., & Hook, R. N. 1997, Proc. SPIE, 3164, 120
- (27) Fruchter, A. S., Hook, R. N., Busko, I. C., & Mutchler, M. 1998, in 1997 HST Calibration Workshop, ed. S. Casertano, R. Jedrzejewsky, T. Keyes, & M. Stevens (Baltimore: STScI)
- (28) Gallagher, J. S., & Hunter, D. A. 1981, AJ, 86, 1312
- (29) García-Burillo, S., Combes, F., & Neri, R. 1999, A&A, 343, 740
- (30) Giallongo, E., Ragazzoni, R., Grazian, A., et al. 2008, A&A, 482, 349
- (31) Haffner, L. M., Dettmar, R.-J., Beckman, J. E., et al. 2009, RvMP, 81, 969
- (32) Heald, G. H., Rand, R. J., Benjamin, R. A., & Bershady, M. A. 2007, ApJ, 663, 933
- (33) Heitsch, F., Hartmann, L. W., Slyz, A. D., Devriendt, J. E. G., & Burkert, A. 2008, ApJ, 674, 316
- (34) Holtzman, J. A., Burrows, C. J., Casertano, S., et al. 1995, PASP, 107, 1065
- (35) Hoopes, C. G., & Walterbos, R. A. M. 2000, ApJ, 541, 597
- (36) Hoopes, C. G., Heckman, T. M., Strickland, D. K., et al. 2005, ApJ, 619, L99
- (37) Howk, J.C., & Savage, B.D. 1997, AJ, 114, 2463 (HS97)
- (38) Howk, J.C., & Savage, B.D. 1999, AJ, 117, 2077 (HS99)
- (39) Howk, J.C., & Savage, B.D. 2000, AJ, 119, 644 (HS00)
- (40) Howk, J. C. 2005, ASPC, 331, 287
- (41) Kaneda, H., Ishihara, D., Suzuki, T., et al. 2010, A&A, 514, A14
- (42) Keppel, J.W., Dettmar, R.-J., Gallagher, J.S., & Roberts, M.S. 1991, ApJ, 374, 507
- (43) Kewley, L. J., Geller, M. J., Jansen, R. A., & Dopita, M. A. 2002, AJ, 124, 3135
- (44) Knapen, J. H., Hes, R., Beckman, J. E., & Peletier, R. F. 1991, A&A, 241, 42
- (45) Lu, L., Sargent, W. L. W., Savage, B. D., Wakker, B. P., Sembach, K. R., & Oosterloo, T. A. 1998, AJ, 115, 162
- (46) Martínez-Delgado, D., Pohlen, M., Gabany, R. J., Majewski, S. R., Peñarrubia, J., & Palma, C. 2009, ApJ, 692, 955
- (47) McCray, R., & Kafatos, M. 1987, ApJ, 317, 190
- (48) McKee, C.F. & Ostriker, J.P. 1977, ApJ, 218, 148
- (49) Ménard, B., Scranton, R., Fukugita, M., & Richards, G. 2010, MNRAS, 405, 1025
- (50) Miller, S. T., & Veilleux, S. 2003, ApJS, 148, 383
- (51) Moss, V. A., McClure-Griffiths, N. M., Braun, R., Hill, A. S., & Madsen, G. J. 2012, MNRAS, 421, 3159
- (52) Murray, N., Ménard, B., & Thompson, T. A. 2011, ApJ, 735, 66
- (53) Ntormousi, E., Burkert, A., Fierlinger, K., & Heitsch, F. 2011, ApJ, 731, 13
- (54) Pildis, R.A., Bregman, J.N., & Schombert, J.M. 1994, ApJ, 423, 190
- (55) Putman, M. E., Saul, D. R., & Mets, E. 2011, MNRAS, 418, 1575
- (56) Rand, R.J. 1996, ApJ, 462, 712
- (57) Rand, R.J. 1998, ApJ, 501, 137
- (58) Richter, P., Sembach, K. R., Wakker, B. P., & Savage, B. D. 2001, ApJ, 562, L181
- (59) Rossa, J., & Dettmar, R.-J. 2000, A&A, 359, 433
- (60) Rossa, J., & Dettmar, R.-J. 2003a, A&A, 406, 505
- (61) Rossa, J., & Dettmar, R.-J. 2003b, A&A, 406, 493
- (62) Rossa, J., Dettmar, R.-J., Walterbos, R. A. M., & Norman, C. A. 2004, AJ, 128, 674
- (63) Roussel, H., Wilson, C. D., Vigroux, L., et al. 2010, A&A, 518, L66
- (64) Sancisi, R., Fraternali, F., Oosterloo, T., & van der Hulst, T. 2008, A&ARv, 15, 189
- (65) Sand, D.J., Olszewski, E.W., Willman, B., et al. 2009, ApJ, 704, 898
- (66) Sandage, A. 1961, The Hubble Atlas of Galaxies, (Washington: Carnegie Institution of Washington)
- (67) Scarrott, S. M., Eaton, N., & Axon, D. J. 1991, MNRAS, 252, 12P
- (68) Schinnerer, E., Rand, R. J., & Scoville, N. Z. 2004, IAUS, 217, 166
- (69) Sembach, K. R., Howk, J. C., Savage, B. D., & Shull, J. M. 2001, AJ, 121, 992
- (70) Thompson, T. W. J., Howk, J. C., & Savage, B. D. 2004, AJ, 128, 662
- (71) Wainscoat, R.J., de Jong, T., Wesselius, P.R. 1987, A&A, 181, 225
- (72) Wang, Q. D., Immler, S., Walterbos, R., Lauroesch, J. T., & Breitschwerdt, D. 2001, ApJ, 555, L99
- (73) Weaver, R., McCray, R., Castor, J., Shapiro, P., & Moore, R. 1977, ApJ, 218, 377
- (74) Wolfire, M.G., Hollenbach, D., McKee, C.F., Tielens, A.G.G.M., & Bakes, E.L.O. 1995a, ApJ, 443, 152
- (75) Wolfire, M.G., McKee, C.F., Hollenbach, D., & Tielens, A.G.G.M. 1995b, ApJ, 453, 673
- (76) Wolfire, M. G., McKee, C. F., Hollenbach, D., & Tielens, A. G. G. M. 2003, ApJ, 587, 278
- (77)
| Name | RA | Dec. | Vrad | Dist.bbWe adopt distances from the Extragalactic Distance Database (Tully et al. 2009). | SFRccThe star formation rate, SFR, were calculated following Kewley et al. (2002), using the and the Kennicutt (1998) SFR calibration (see SFR discussion in §6). | Type | ||
|---|---|---|---|---|---|---|---|---|
| [J2000] | [J2000] | [arcmin] | [km s-1] | [km s-1] | [Mpc] | [yr-1] | ||
| NGC 4013 | 11 58 31 | +43 56 48 | 4.7 | 831 | 407 | 17.0 | 1.5 | Sb |
| NGC 4302 | 12 21 42 | +14 35 54 | 4.7 | 1149 | 377 | 16.8 | 0.9 | Sc |
| Filter | Total Exp. Time [seconds] | ||
|---|---|---|---|
| NGC 4013bbThe NGC 4013 images have non-uniform exposure times per pixel. Two separate visits with HST had distinct pointing centers and orientations. The central and northern sections of the galaxy, respectively, have three and two times the exposure time of the southern-most region. | NGC 4302 | ||
| F450W (-band) | 4000 | 4000 | |
| F555W (-band) | 3000 | 2000 | |
| F814W (-band) | 3000 | 2000 | |
| Filter | Total Exp. Time | SeeingbbSeeing values empirically measured in the final images. | ResolutionccResolution based on assumed distances from Table 1. |
|---|---|---|---|
| [seconds] | [arcsec] | [pc] | |
| NGC 4013 | |||
| 2250 | 0.6 | 49 | |
| 2900 | 0.9 | 74 | |
| 1800 | 0.8 | 66 | |
| 3600 | 0.8 | 66 | |
| HddWIYN W015 filter | 14400 | 0.8 | 66 |
| NGC 4302 | |||
| 3600 | 1.0 | 82 | |
| HddWIYN W015 filter | 9000 | 0.8 | 65 |
| Filter | Total Exp. Time | SeeingaaSeeing values empirically measured in the final images. | ResolutionbbResolution based on assumed distances from Table 1. |
|---|---|---|---|
| [seconds] | [arcsec] | [pc] | |
| 2000 | 1.2 | 98 | |
| 1000 | 1.1 | 90 | |
| 1000 | 1.0 | 81 | |
| 2000 | 0.9 | 73 |
| CloudaaCloud I.D. based on R.A. and Dec. | Dimensions | bbProjected vertical distance from the midplane. | ccAverage apparent -band extinction. | ddColumn density derived using measured and the Milky Way value for / cm-2 mag-1. These are lower limits since . | eeMean density derived from and the minor axis width. | MassffApproximate mass based upon the estimated column density and projected area. Includes a factor of 1.37 correction for He. |
|---|---|---|---|---|---|---|
| [J2000] | [pcpc] | [pc] | [mag.] | [cm-2] | [cm-3] | [M⊙] |
| NGC 4013 | ||||||
| 115835.55702.0 | 90 60 | 590 | 0.20 | 2.1 | ||
| 115834.45713.5 | 50 45 | 640 | 0.17 | 2.2 | ||
| 115833.85713.8 | 70 70 | 890 | 0.15 | 1.3 | ||
| 115834.45651.9 | 170 150 | 930 | 0.22 | 0.9 | ||
| 115832.95706.8 | 40 30 | 690 | 0.22 | 4.5 | ||
| 115833.55648.8 | 90 55 | 850 | 0.12 | 1.4 | ||
| 115833.35648.5 | 55 25 | 820 | 0.18 | 4.4 | ||
| 115833.25648.4 | 65 60 | 810 | 0.13 | 1.3 | ||
| 115833.15647.9 | 110 70 | 650 | 0.21 | 1.9 | ||
| 115832.25644.6 | 30 30 | 690 | 0.20 | 4.4 | ||
| 115832.05644.1 | 60 50 | 660 | 0.19 | 2.3 | ||
| 115831.15658.2 | 55 40 | 740 | 0.17 | 2.7 | ||
| 115830.35651.5 | 45 40 | 510 | 0.18 | 2.8 | ||
| 115830.85640.2 | 130 70 | 500 | 0.23 | 2.0 | ||
| 115832.85638.6 | 70 60 | 600 | 0.16 | 1.8 | ||
| 115830.05648.9 | 55 55 | 430 | 0.25 | 2.9 | ||
| NGC 4302 | ||||||
| 122141.93506.8 | 90 80 | 590 | 0.14 | 1.1 | ||
| 122143.13512.4 | 110 90 | 900 | 0.19 | 1.3 | ||
| 122143.03518.9 | 110 100 | 820 | 0.22 | 1.4 | ||
| 122141.93545.4 | 90 65 | 560 | 0.33 | 3.2 | ||
| 122143.13550.6 | 60 50 | 860 | 0.26 | 3.3 | ||
| 122141.83601.9 | 130 90 | 660 | 0.21 | 1.5 | ||
| 122143.13620.4 | 90 70 | 950 | 0.17 | 1.5 | ||
| 122142.83627.3 | 95 60 | 600 | 0.19 | 1.9 | ||
| 122141.83633.9 | 95 65 | 610 | 0.31 | 2.0 | ||
| 122141.63649.3 | 105 95 | 820 | 0.24 | 1.5 | ||
| 122143.23658.4 | 95 90 | 1040 | 0.12 | 0.9 | ||
| Galaxy | aaThe values were calculated using and µm fluxes from Sanders et al. (2003). | SFRbbThe star formation rates were calculated following Kewley et al. (2002) using the calculated and the Kennicutt (1998) star formation calibration. For NGC 5775, NGC 891, and NGC 4217 we adopt distances of Mpc, Mpc, and Mpc, respectively. | ddThe star formation surface density, SFR/, where /. | Dust | DIG | DIG |
|---|---|---|---|---|---|---|
| [ ] | [yr-1] | [yr-1 kpc-2] | Morphology | Morphology | Reference | |
| NGC 5775 | 32.5 | 9.9 | 12.0 | Highly structured filamentseeDescription based on images from the Hubble Legacy Archive. | Many bright filaments | 1 |
| NGC 891 | 12.4 | 3.8 | 3.4 | Highly structured filaments | Bright filaments, faint + diffuse | 2,3,4 |
| NGC 4217 | 8.1 | 2.5 | 4.6 | Highly structured filaments | Two faint patches | 5 |
| NGC 4013 | 4.8 | 1.5 | 2.8 | Highly structured filaments | Faint filaments; faint + diffuse | 6 |
| NGC 4302 | 2.6ccThe images do not resolve NGC 4302 and NGC 4298. We estimate the fractional contribution to both bands using the relative µm fluxes for these two galaxies from more recent Herschel images (Corbelli et al. 2012). | 0.9 | 1.4 | Large complexes + filaments | Faint + diffuse | 5,6 |
References. — (1) Collins et al. 2000; (2) HS00; (3) Rand, Kulkarni, & Hester (1990); (4) Dettmar (1990); (5) Rand (1996); (6) This work.