A tentative detection of an emission line at for the candidate UDFj-3954628400footnotemark: 0
Abstract
We present deep WFC3 grism observations of the candidate galaxy UDFj-39546284 in the HST Ultra Deep Field (UDF), by combining spectroscopic data from the 3D-HST and CANDELS surveys. The total exposure time is 40.5 ks and the spectrum covers . We search for faint emission lines by cross-correlating the 2D G141 spectrum with the observed morphology, a technique that is unique to slitless spectroscopy at HST resolution. We find a 2.7 detection of an emission line at 1.599 —just redward of the filter—with flux . Assuming the line is real, it contributes % of the observed flux and has an observed equivalent width Å. If the line is confirmed, it could be Ly- at . However, a more plausible interpretation, given current results, could be a lower redshift feature such as [O III]4959,5007 at . We find two other 3D-HST [O III] emitters within 1000 km s-1 of that redshift in the GOODS-South field. Additional support for this interpretation comes from the discovery of a bright “[O III] blob” with a secure G141 grism redshift of . This object has a strikingly large observed equivalent width of nearly 9000 Å that results in similar “dropout” colors as UDFj-39546284.
Subject headings:
galaxies: formation — galaxies: high-redshift1. Introduction
Over the past few years deep imaging programs with the WFC3 camera on the Hubble Space Telescope (HST) have opened up the Universe at for systematic study (e.g., Bouwens et al., 2011a, 2012a; Oesch et al., 2012; Ellis et al., 2013; Coe et al., 2013). Photometric data can provide strong constraints on the redshifts and properties of very high redshift galaxies (e.g., Bouwens et al., 2011b, 2012b). However, the interpretation is hampered by the lack of spectroscopic information that provides unambiguous redshift determination and the contributions of emission lines to the broad band fluxes. The equivalent widths of rest-frame optical lines increase with redshift (e.g., Fumagalli et al., 2012), and the emission line contribution can be significant even in the broad IRAC filters (e.g., Labbé et al., 2010; Ono et al., 2010).
Obtaining high quality spectra of these very distant objects is a formidable challenge because of their faintness and because key emission and absorption features are redshifted into the observer’s near-IR. Apart from a gamma ray burst at (Salvaterra et al., 2009; Tanvir et al., 2009) the only claimed (and disputed; Bunker et al., 2013) detection is a Ly- line at in a z-dropout galaxy in the UDF (Lehnert et al., 2010).
Here we describe a deep WFC3 G141 grism spectrum of one of the most intriguing high redshift candidates yet discovered: UDFj-39546284. This object was identified as the first robust candidate by Bouwens et al. (2011a): it was only detected in in the HUDF09 dataset (see also Oesch et al., 2012). Recent observations from the HUDF12 program (Ellis et al., 2013) confirm the detection and show that it is undetected in (Ellis et al., 2013; Bouwens et al., 2013). The mag dropout (2) in the filter pushes its likely redshift to , although alternative explanations cannot be ruled out (Ellis et al., 2013). Here we report a 2.7 detection of an emission line for UDFj-39546284 that would account for most or all of its flux. Though this line could be Ly- at , we argue that it is more likely to be [O III]4959,5007 at based in part on the discovery of a bright low-redshift analog with one of the highest [O III] equivalent widths ever observed (8700 Å) and broad-band colors similar to UDFj-39546284. Magnitudes are in the AB system throughout.
2. Observations & Analysis
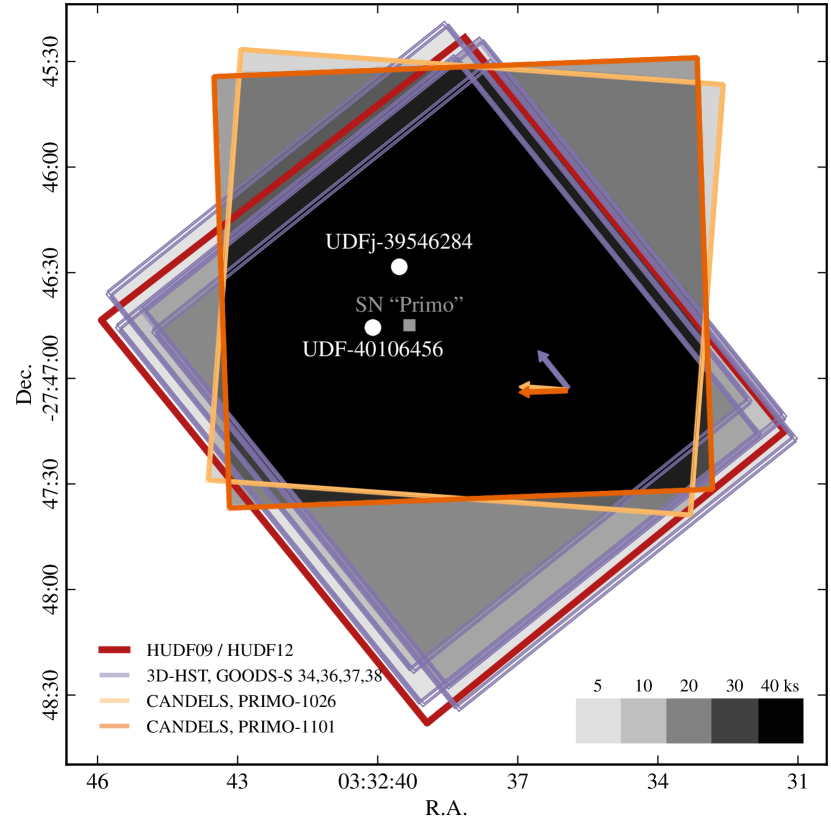
The UDF was observed with the WFC3/G141 grism as part of the 3D-HST survey (GO-12177; PI: van Dokkum; Brammer et al., 2012a). The observations comprise four separate visits at the same orientation with G141 integrations of 4.7 ks (two orbits) each. The UDF was also observed by the CANDELS supernova follow-up program (GO-12099, PI: Riess) when a supernova at , nicknamed “Primo”, was discovered in the first epoch of CANDELS imaging in the GOODS-South field(see Rodney et al., 2012). The field was observed in two visits on 2010 Oct 26 and 2010 Nov 01 with G141 integrations of 6.6 and 15 ks, respectively. The position angle of the grism dispersion axis is rotated by 6.4 degrees between the two visits, which together are rotated 50 degrees with respect to the 3D-HST visits. The relation of the G141 pointings to the deep HUDF09+HUDF12 imaging area is shown in Fig. 1.
The Primo and 3D-HST visits were pre-processed separately and identically using the threedhst pipeline111http://code.google.com/p/threedhst/ (Brammer et al., 2012a). The individual exposures of each visit were then combined into a mosaic by interlacing the pixels to a subgrid of pixels that are exactly half their original size. Interlacing pixels from input images which have 0.5 pixel offsets (by design in 3D-HST and rounded for CANDELS-Primo) results in a one-to-one correspondence between input and output pixels (e.g., van Dokkum et al., 2000) and offers the key benefit of preserving the individual pixel errors.
With the HUDF12 image defining the 1.6 flux densities and spatial morphologies, we compute a full quantitative contamination model of all objects in the field to . The modeling technique, first presented in Brammer et al. (2012b), includes the first 4 spectral orders, among them the compact zeroth order that can resemble emission lines. The models of bright objects with are refined based on their observed spectra, while fainter objects are assumed to have continua flat in units of . Therefore, emission lines in fainter galaxies are not included in the contamination model.
To generate a deep 2D spectrum from all UDF grism integrations, we first extract two-dimensional spectra from each visit. These spectra are aligned in two dimensions to the nearest pixel in the subsampled grid and the aligned pixels are then combined with inverse variance weights including a term to down-weight contaminated pixels. Stacked spectra from the central 3 arcmin2 of the UDF have a combined exposure time of 40.5 ks.
3. A Tentative Emission Line in UDFj-39546284
3.1. The Deep Near-IR Spectrum
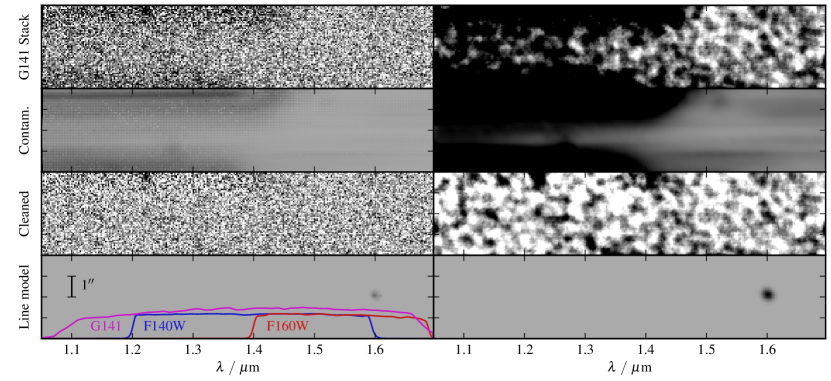
The two-dimensional 40.5 ks G141 spectrum of UDFj-39546284 is shown in Fig. 2. While some contamination remains in the stacked spectrum, the orientations of the UDF/G141 visits turn out to be nearly perfect for avoiding significant contamination of the UDFj-39546284 spectrum, particularly at . The contamination-subtracted spectrum is remarkably clean with none of the systematics that typically plague ground-based NIR spectroscopy (see, e.g., Lehnert et al., 2010). The cluster of bright pixels at the top of the spectrum is likely a faint contaminant emission line not included in the model; it lies well away from any contribution from UDFj-39546284.
The “salt-and-pepper” appearance of the 2D spectrum is the result of the uncorrelated noise of the individual pixels. The distribution of cleaned pixel values is gaussian with electrons s-1. Random gaussian deviates scaled by the propagated pixel errors have electrons s-1. This slight overestimation of the errors by is significantly lower than the factors of 60–70% that result from typical applications of the Drizzle algorithm (Fruchter et al., 2009).
3.2. A Emission Line Detection at
Slitless HST grism spectra offer a distinct advantage compared to ground-based data for detecting weak emission line features: the 2D spectrum provides an image of the galaxy at the wavelength of the emission line (see, e.g., Brammer et al., 2012b), and the morphology of the galaxy is known a priori from the deep broad-band WFC3 imaging. As long as the emission line morphology and the broad-band morphology are similar (which is generally the case at ; Nelson et al., 2012), or the line contributes significantly to the broad-band flux (which is the case here; see below), we can search for features in the 2D spectrum whose morphology corresponds to that of the broad-band image.
While there are no obvious emission lines in the raw 2D spectrum, there is a clump of pixels at m which is marginally enhanced compared to its surroundings. To improve the signal-to-noise of this feature, we cross-correlate the 2D spectrum with a kernel defined by the central of the deep thumbnail of UDFj-39546284. This kernel is constructed by extracting kernels for each of the individual UDF/G141 visits with different orientations and combining them weighting by the median error in their corresponding 2D grism spectra. Thus, the object profile is slightly smoothed but will reflect the 2D morphology of lines in the stacked spectrum. The cross-correlation spectrum is shown in the right-hand panels of Fig. 2, and the strength of the feature at 1.6 is enhanced compared to the raw 2D spectrum. We verified that the weak feature is not visible in a similar analysis of any single UDF/G141 visit, confirming that the feature does not arise from a flux excess in one of them individually, such as a group of hot pixels or an un-flagged cosmic ray.
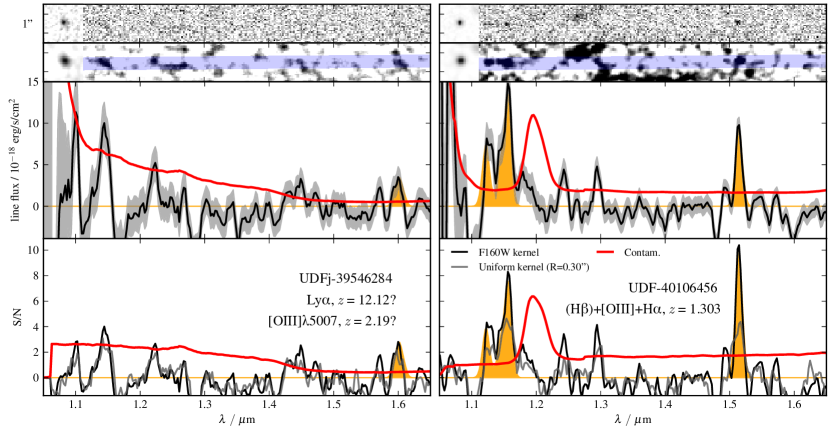
We show a one-dimensional spectrum extracted along the trace in Fig. 3. We compute an associated uncertainty at each pixel along the trace, highlighted in blue, by cross-correlating the squared error array with the same kernel. Furthermore, we compute a 2D model spectrum as in Fig. 2 with known position and integrated line flux, and extract its cross correlation spectrum in the same way as the observed spectrum. The feature at is detected at 2.7 with an integrated line flux of . The probability of finding a gaussian noise feature with equal or greater significance is 10% for 30 independent resolution elements (3000Å).
3.3. The Reality of the Feature
There are regions in the 2D cross-correlation spectrum with apparently similar significance to the feature at 1.6 . Many of them can be rejected because they do not fall precisely along the trace of the grism spectrum. There are enhancements found near the trace at and , though these wavelengths suffer from higher contamination perhaps consisting of faint emission lines not included in the contamination model. The HST/WFC3 broad-band photometry places strong constraints on the possibility that these lines come from UDFj-39546284: either of the bluer lines alone would result in or two magnitudes brighter than the HUDF12 limits.
In contrast, the line is consistent with the HUDF12 photometry. Within the same aperture used to measure the line flux, we measure for the kernel. This is 27% brighter than the Ellis et al. (2013) magnitude measured within an aperture, but is only 73% of the total magnitude measured by Bouwens et al. (2013). These differences are consistent with aperture corrections of the extended source, which shows a faint extended tail to the NE in the image (Bouwens et al., 2013). A pure emission line with the observed flux would result in ; the line accounts for % (1) of the flux. This corresponds to a (1,2) limit on the observed-frame equivalent width of the line of Å.
We test our technique by analyzing faint lines of another UDF galaxy with a secure redshift, UDF-40106456(right panels of Fig. 3). This galaxy has and unambiguous emission lines of H and [O III]4959,5007 at visible in the stacked 2D spectrum before cross-correlation. Using the cross-correlation technique we find a significant detection of H even though the line is barely visible in the original spectrum. Two spurious features are detected at 1.24m and m with comparable flux as the tentative line in UDFj-39546284. These are both clearly associated with residual contamination from another source at the top of the 2D spectrum. The H line flux of UDF-40106456 is , just three times brighter than the UDFj-39546284 emission line. The detection significance is S/N10 and the cross-correlation technique enhances the detection significance by a factor of two compared to simple photometry along the trace within an equivalent aperture. This example demonstrates that the cross-correlation technique works and is able to recover extremely faint emission lines.
4. Line identification
4.1. Is UDFj-39546284 at
If the galaxy is at , as is suggested based on its strong photometric break between the and filters (Ellis et al., 2013; Bouwens et al., 2013), the line—if real—can be identified as Ly- redshifted to . The rest-frame equivalent width of Ly- would not be unreasonably high at Å (accounting for the Lyman break in ); such values can be reached in young, low metallicity starbursts at high redshift (Schaerer, 2003). However, such strong Ly- emission might be unexpected early in the reionization epoch when the neutral fraction is high (Santos, 2004; but see also Dijkstra et al., 2011). More to the point, if the line is real it can account for most or all of the flux, meaning that the photometric break does not necessarily reflect a strong continuum break and the photometric redshift is unreliable. Therefore the line could also be a longer-wavelength feature at much lower redshift, a possibility discussed by Ellis et al. (2013).
4.2. Low redshift solutions—[O III] at
Although we cannot exclude other low redshift identifications such as [O II] at or H at , a likely possibility is that the line is [O III]4959,5007 at . A population of extreme [O III] emission line galaxies at was recently identified by van der Wel et al. (2011) from their significant line contribution to the photometry in the CANDELS survey. Additional galaxies with [O III] rest-frame equivalent widths reaching 2000 Å have been identified in WFC3 grism spectroscopy by Atek et al. (2011) and Brammer et al. (2012b). The strongest emitters in van der Wel et al. (2011) have , with [O III] in the band. While such colors can mimic those of high-redshift dropout galaxies (Atek et al., 2011), even more extreme equivalent widths at 3000 Å (rest-frame) are required to reach observed for UDFj-39546284.
4.3. Discovery of a Possible Analog: An Extreme [O III] Emitter at
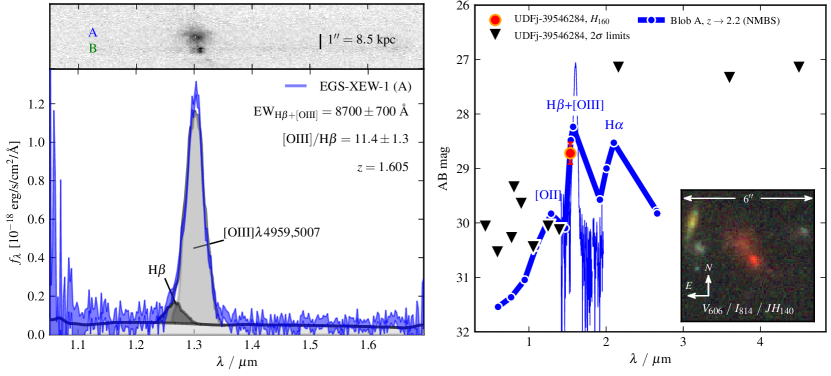
We have discovered a very bright example of such an extreme emission line galaxy in G141 grism observations of the EGS field (GO-12547, PI: Cooper). This remarkable object, EGS-XEW-1, located at =14:17:58.2, =+52:31:35 and shown in Fig. 4, is an “[O III] blob” at with and a complex morphology comprised of diffuse (A) and compact (B) components separated by 1′′. The exposure times and dithered pixel sampling for the Cooper et al. grism program are nearly identical to those of 3D-HST, and the spectra were processed with the 3D-HST interlacing software as described above. The diffuse component, which is extended over more than 1′′ (8.5 kpc), has a combined observed-frame equivalent width of nearly 9000 Å for the blended H and [O III]4959,5007 emission lines. The more compact component has EW= Å.
The broad-band SED of EGS-XEW-1 is compared to that of UDFj-39546284 in the right panel of Fig. 4. The spectral break that results from a line such as the one observed in EGS-XEW-1 is just large enough to satisfy the 2 limit on the dropout color of UDFj-39546284. However, if UDFj-39546284 had exactly the same spectrum as EGS-XEW-1, the [O II]3727 line would probably be detected in the bluer WFC3 HUDF12 photometry. Interestingly, EGS-XEW-1 has much redder UV colors than observed for the high equivalent width starbursts at similar redshifts (van der Wel et al., 2011; Brammer et al., 2012b), which, if also true for UDFj-39546284, could help explain the lack of Ly- observed for that source (Ellis et al., 2013). While not a perfect match, EGS-XEW-1 provides a directly-observed route to a plausible low-redshift interpretation for the UDFj-39546284 photometry.
5. Discussion and Conclusions
We have described a deep HST grism spectrum of the candidate galaxy UDFj-39546284. Using the known emission line morphology to increase the line sensitivity of the slitless grism spectrum, we detect a tentative emission line at with flux and observed-frame equivalent width Å.
While the current observations do not conclusively forbid the interpretation of UDFj-39546284, a number of independent factors conspire to suggest that the 2.7 line is in fact real and that the true redshift of UDFj-39546284 is . First, the line is observed at just the right wavelength and flux to satisfy both the HUDF detection and the 1.4 mag dropout at in the bluer HST bands. If the feature were observed just 4 pixels (93 Å) bluer it would violate the constraints on by a magnitude. Second, Bouwens et al. (2013) demonstrate that without a significant contribution of Ly- to the flux, the implied rest-frame UV luminosity for is some 20 higher than would be expected from the evolution of the luminosity function at –10. Third, recent deep spectroscopic surveys of photometric dropouts find a decreasing fraction Ly- emitters with increasing redshift when the universe was increasingly neutral (Pentericci et al., 2011; Caruana et al., 2012). Fourth, we show that spatially-extended objects with Å exist at . Finally, we find at least two [O III] emitters within 1000 km s-1 of the solution for UDFj-39546284 in the 3D-HST coverage of the full GOODS-South field, the nearest separated by 69′′ (570 kpc); the fact that other galaxies exist at this exact redshift increases the probability that the line is real and is [O III]4959,5007.
If the physical properties of UDFj-39546284 are similar to either the [O III] blob EGS-XEW-1 or to the high equivalent width starbursting dwarf galaxies studied by van der Wel et al. (2011), UDFj-39546284 at would represent a new class of object 750 times fainter than the former or 30 times fainter than the latter. Scaling from the typical stellar masses of the van der Wel et al. (2011) galaxies, UDFj-39546284 would have a stellar mass of order , similar to the mass of a single massive star cluster (e.g., Reines et al., 2008). The extended morphology would then indicate the distribution of ionized gas surrounding the cluster.
The most urgent question is whether the line is real and associated with UDFj-39546284 as opposed to coming from a nearby contaminating object spectrum or simply being a clump of positive noise fluctuations. If the line is real and is [O III] at , it should be possible to detect the 4959 and 5007 Å lines of the doublet separately, either in (much) deeper grism data or in deep ground-based spectroscopy. H may also be visible in the -band at a similar flux as [O III] (Fig. 4). Regardless of the reality of the emission line, we have shown that the broad-band SED of UDFj-39546284 provides a reasonable match to a low redshift SED, specifically the observed spectrum of EGS-XEW-1, an “[O III] blob” at , redshifted to . This study demonstrates that the G141 grism on WFC3 can provide clean spectra with well-understood noise properties in deep integrations up to at least 40 ks (17 orbits).
References
- Atek et al. (2011) Atek, H., Siana, B., Scarlata, C., et al. 2011, ApJ, 743, 121
- Bouwens et al. (2012a) Bouwens, R., Bradley, L., Zitrin, A., et al. 201a, arXiv/1211.2230, ApJ, submitted
- Bouwens et al. (2011a) Bouwens, R. J., Illingworth, G. D., Labbe, I., et al. 2011a, Nature, 469, 504
- Bouwens et al. (2012b) Bouwens, R. J., Illingworth, G. D., Oesch, P. A., et al. 2012b, ApJ, 754, 83
- Bouwens et al. (2011b) —. 2011b, ApJ, 737, 90
- Bouwens et al. (2013) Bouwens, R. J., Oesch, P. A., Illingworth, G. D., et al. 2013, arXiv/1211.3105, ApJL, submitted
- Brammer et al. (2012a) Brammer, G. B., van Dokkum, P. G., Franx, M., et al. 2012a, ApJS, 200, 13
- Brammer et al. (2012b) Brammer, G. B., Sánchez-Janssen, R., Labbé, I., et al. 2012b, ApJ, 758, L17
- Bunker et al. (2013) Bunker, A. J., Caruana, J., Wilkins, S. M., et al. 2013, arXiv/1301.4477, MNRAS, in press
- Caruana et al. (2012) Caruana, J., Bunker, A. J., Wilkins, S. M., et al. 2012, MNRAS, 427, 3055
- Coe et al. (2013) Coe, D., Zitrin, A., Carrasco, M., et al. 2013, ApJ, 762, 32
- Dijkstra et al. (2011) Dijkstra, M., Mesinger, A., & Wyithe, J. S. B. 2011, MNRAS, 414, 2139
- Ellis et al. (2013) Ellis, R. S., McLure, R. J., Dunlop, J. S., et al. 2013, ApJ, 763, L7
- Fruchter et al. (2009) Fruchter, A., Sosey, M., Hack, W., et al. 2009, The MultiDrizzle Handbook, v3.0, Tech. rep.
- Fumagalli et al. (2012) Fumagalli, M., Patel, S. G., Franx, M., et al. 2012, ApJ, 757, L22
- Labbé et al. (2010) Labbé, I., González, V., Bouwens, R. J., et al. 2010, ApJ, 716, L103
- Lehnert et al. (2010) Lehnert, M. D., Nesvadba, N. P. H., Cuby, J.-G., et al. 2010, Nature, 467, 940
- Nelson et al. (2012) Nelson, E. J., van Dokkum, P. G., Brammer, G., et al. 2012, ApJ, 747, L28
- Oesch et al. (2012) Oesch, P. A., Bouwens, R. J., Illingworth, G. D., et al. 2012, ApJ, 745, 110
- Ono et al. (2010) Ono, Y., Ouchi, M., Shimasaku, K., et al. 2010, ApJ, 724, 1524
- Pentericci et al. (2011) Pentericci, L., Fontana, A., Vanzella, E., et al. 2011, ApJ, 743, 132
- Reines et al. (2008) Reines, A. E., Johnson, K. E., & Hunt, L. K. 2008, AJ, 136, 1415
- Rodney et al. (2012) Rodney, S. A., Riess, A. G., Dahlen, T., et al. 2012, ApJ, 746, 5
- Salvaterra et al. (2009) Salvaterra, R., Della Valle, M., Campana, S., et al. 2009, Nature, 461, 1258
- Santos (2004) Santos, M. R. 2004, MNRAS, 349, 1137
- Schaerer (2003) Schaerer, D. 2003, A&A, 397, 527
- Tanvir et al. (2009) Tanvir, N. R., Fox, D. B., Levan, A. J., et al. 2009, Nature, 461, 1254
- van der Wel et al. (2011) van der Wel, A., Straughn, A. N., Rix, H.-W., et al. 2011, ApJ, 742, 111
- van Dokkum et al. (2000) van Dokkum, P. G., Franx, M., Fabricant, D., et al. 2000, ApJ, 541, 95
- Whitaker et al. (2011) Whitaker, K. E., Labbé, I., van Dokkum, P. G., et al. 2011, ApJ, 735, 86