Crossover from weak to strong disorder regime in the duration of epidemics
Abstract
We study the Susceptible-Infected-Recovered model in complex networks, considering that not all individuals in the population interact in the same way between them. This heterogeneity between contacts is modeled by a continuous disorder. In our model the disorder represents the contact time or the closeness between individuals. We find that the duration time of an epidemic has a crossover with the system size, from a power law regime to a logarithmic regime depending on the transmissibility related to the strength of the disorder. Using percolation theory, we find that the duration of the epidemic scales as the average length of the branches of the infection. Our theoretical findings, supported by simulations, explains the crossover between the two regimes.
keywords:
Complex Systems , Epidemic , Percolation , Disorder1 Introduction
Complex Networks has became a topic of interest among scientists in the last years, due to the fact that many real systems such as protein interaction, Internet, communication systems [1, 2, 3], among others, can be properly described by complex networks, making this theoretical framework inherently interdisciplinary. On complex networks, nodes can represent the individuals of a population in the case of social networks, computers in communication systems, etc, and the links represent the interaction between them. The research on networks goes from the study of its topology to the study of transport processes that use the networks as the underlying substrate to propagate. In particular, many researchers have focused on the propagation of seasonal diseases on social networks due to the appearance of new infections such as SARS, Avian Flu and the recently influenza A(H1N1) epidemic.
Several models have been developed to characterize the spreading of this kind of diseases, one of the most used models is the Susceptible-Infected-Recovered (SIR) model, first introduced by Kermack and McKendrick [4] in the full mixing approximation and then extended to complex networks [5, 6]. In this model the individuals of the population can be in three different states S (susceptible) - I (Infected) - R (recovered or removed). A S individual becomes infected with a probability by contact with an infected individual. Infected individuals recover after times steps since they were infected, and cannot infect or change their state thereafter. The system reaches the steady state when all the infected individuals recover. In this model, the size of the disease defined as the number of recovered individuals, depends only on the effective probability of transmission between individuals, given by
| (1) |
where is the density distribution of , with for a constant probability of infection.
It has been shown that the steady state of the SIR model on statics complex networks can be mapped into a link percolation problem [6, 7] where the order parameter of the SIR is the fraction of recovered individuals, and the control parameter is the transmissibility which plays the role of the fraction of links in percolation. Thus there exist a critical threshold (or ) in the SIR (or percolation) model above which a nonzero fraction of individuals (size of biggest cluster) are infected (). It was shown that in finite systems, the critical threshold of link percolation depends strongly on the network size N with in mean field approximation, i.e. finite size effects are strong [8]. Then in finite systems, for the disease becomes an epidemic, while for the disease reaches a small fraction of the population (outbreaks) [6, 9, 10, 11].
Usually, the study of a disease transmission or any type of transport process like information flows [12], rumor spreading [13] through a network is made assuming that all the contacts are equivalent. However this assumption does not give a very realistic description of real networks, such as social networks [14] where not all individuals in a society have the same interaction between them. A way to improve the description of real networks, is to consider the heterogeneity of the social contacts. This can be done by considering weighted (disordered) networks, where the weights in the contacts could represent the closeness or the contact time between the individuals [15, 16, 17]. The contact time is a parameter that can be controlled by health policies as a strategy to mitigate the duration of the spreading of the disease. Using different strategies like broadcasting, brochures, etc, the public health agencies can induce people to change their contact time or the closeness of the contact, for example, encouraging people to reduce their contact time. This strategy that is a social distancing, was used already by some governments in the recent wave of influenza A(H1N1) epidemic in 2009 [18]. It is known that the disorder can dramatically alter some topological properties of networks such as the average length of the optimal paths [15, 19, 20, 21]. In the optimal path problem defined as the path between any two nodes that minimizes the total weight along the path [15, 19, 20], it was shown that the average length of the optimal path scales as in the strong disorder limit (SD), where for homogeneous networks, and as in the weak disorder regime (WD), where the SD limit is related to percolation at criticality [15, 19, 22]. However, the exact mapping between the order parameter of both second order phase transitions, percolation and SIR, is not affected by the disorder when the disorder is not correlated [8]. Nevertheless, the disorder could affect the duration of a disease.
In this paper we introduce disorder in the links and show how a broad disorder affects the duration of an epidemic in the SIR model.
Using theoretical arguments, supported by intensive simulations, we find that, the average time of the duration of the epidemic goes as the average length of the branches of the infection. Thus, relating with the optimal path problem we find that has a crossover from WD to SD regimes.
2 SIR model with disorder
In our model, we assign to each link between any two nodes a random number drawn from the distribution
| (2) |
where is the parameter that controls the broadness of the distribution of link weights i.e. the strength of the disorder and is defined in the interval . With this distribution we randomly assign a weight to each link of the network, of the form,
| (3) |
where is a random number taken from an uniform distribution . Thus is the probability of infection between any pair of nodes. This type of weight has been widely used [19, 22, 21, 23] because it is a well known example of many distributions that produce WD and SD crossover. The strong disorder limit can be thought in a disordered medium as a potential barrier so that is the time to cross this barrier in a thermal activation process, then , where is the Boltzmann constant and is the absolute temperature. Therefore, we can see as the inverse of the time needed to cross this barrier .
With this weight distribution the transmissibility (See Eq. 1) is given by,
| (4) |
In our initial stage all the individuals are in the susceptible state. We choose a node at random from the biggest connected cluster, or giant component (GC) and infect it (patient zero), then the process follows the rules of the SIR model but in a weighted network. After the system reaches the steady state, we compute the duration of the infection defined as the time where the last infected individual recovers and the length of the branches of the infection as a function of . As the substrate for the disease spreading we use only an Erdös Rényi network (ER) [24], characterized by a Poisson degree distribution where is the connectivity and is the average degree. However, the results obtained are similar for all networks with a finite value of in the mean field approach.
3 Crossover from WD to SD for the duration times of the epidemics
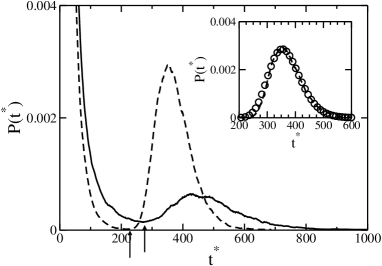
We only consider those propagation that lead to epidemic states, and disregarded the outbreaks (See Fig. 1). Fig. 1 shows as a function of , the arrows shows the separation between outbreaks and epidemic regimes. The criteria used to distinguish between outbreaks and epidemics is the observation of the behavior of the cluster size distribution that decays as a power law close to for the outbreaks and has a maximum for the epidemics. The same criteria is used in percolation to distinguish finite cluster sizes from giant component with size . We find that in the epidemic regime can be well represented by a Log-Normal distribution,
| (5) |
where and are the average and the standard deviation of the distribution of . Log-normal distributions have been observed in several phenomena, such as the size of crushed ore [25], fragmentation of glass [26], income distribution [27], events in medical histories [28], food fragmentation by human mastication [29], etc. By fitting our data with a log-normal distribution we obtain (see the inset of Fig. 1).
From Fig. 1 we can see that increases with for a fixed value of , this behavior can be understood if we take into account that when increases, the barrier that the disease needs to overcome in order to propagate is bigger. Therefore, even though the transmissibility decreases as increases for fixed , the epidemic will last longer due to the disorder, allowing the health services to make earlier interventions.
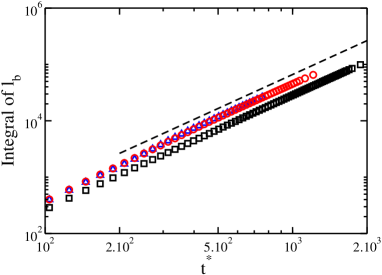
We also study the average length of the branches of the infection . The length of a branch is defined as the number of links between the patient zero and the last patient in that branch. In Fig. 2 we plot the integral of as a function of in log-log scale, from which it is easy to see that, independent of the disorder, the epidemic region has a slope , thus . If we compare between the disordered and the undisordered substrate, we can see that in the disordered one, the length of the branches are larger than in the undisordered case, even for the same values of and . This is due to the fact that the link of smallest crossing probability that the disease has to traverse is smaller than the required value of for the same values of and in the undisordered case (see Eq.(1)).
For the SIR problem, at the threshold in the mean field approximation, the fraction of recovered individuals grows with time as [30] up to , then at , , and for , constant due to finite size effects. Percolation in complex networks predicts that at criticality , the size of the epidemics scales with the chemical length as [31].
| (6) |
with in the mean field approximation, then
| (7) |
where . For the WD regime where ,
| (11) |
then at
| (12) |
Using the fact that in WD , and , we obtain that also in this regime
| (13) |
Thus from the theoretical arguments presented above,
| (14) |
In order to corroborate Eq. (14), we compute as a function of for fixed values of , and , and found that for , behaves as a power law with exponent compatible with the one found for SD in the optimal path problem. The slight difference between the exponent obtained and the theoretical one (1/3) is due to finite size effects [8]. Notice that the power law regime of SD holds only until . In Fig. 3 (a), we plot the ratio as a function of . We can see that for values of for which , this ratio goes to a constant in agreement with our prediction. However for we can see from Fig. 3 (b) that behaves logarithmically with in agreement with the WD regime of Eq. (14). Thus, we can see clearly that there is a crossover from WD to SD in full agreement with our theoretical prediction.
4 Conclusions
In this paper we study the SIR model on a broad disordered network, where the disorder represents the duration of the interactions between the individuals of a population, and the broadness of the disorder is a control parameter.
We found that as the broadness of the disorder increases, the spreading of the disease is delayed. Thus, recommending people to decrease the duration of the contact as a social distancing could be a good strategy to delay the spreading of an epidemic. Moreover, this social distancing strategy, is more suitable than a quarantine, where contacts are broken, due to the fact that it is less expensive from an economic point of view.
Using percolation arguments, we found that the duration time of the epidemic goes as the average length of the branches of the infection. Our theoretical results are strongly supported by simulations. Thus, in the same way as in the optimal path problem, the duration of the disease has a crossover with the system size, from a power law regime (SD) to a logarithmic regime (WD).
Acknowledgments
This work was financially supported by UNMdP and FONCyT (Pict 0293/2008). The authors thank Lucas D. Valdez for useful comments and discussions.
References
- Jeong et al. [2011] H. Jeong, S. Mason, A.-L. Barabási, Z. N. Oltvai, Nature 41 (2011) 411.
- Watts and Strogatz [1998] D. J. Watts, S. H. Strogatz, Nature 393 (1998) 440–442.
- Pastor-Satorras and Vespignani [1992] R. Pastor-Satorras, A. Vespignani, Evolution Structure of the internet, Oxford University Press, Oxford, 1992.
- Kermack and McKendrick [1927] W. O. Kermack, A. G. McKendrick, Proc. Roy. Soc. Lond. A 115 (1927) 700–721.
- Dorogovtsev and Mendes [2003] S. N. Dorogovtsev, J. F. F. Mendes, Evolution of Networks, Oxford University Press, Oxford, 2003.
- Newman [2002] M. E. J. Newman, Physical Review E 66 (2002) 016128.
- Grassberger [1983] P. Grassberger, Math. Biosci. 63 (1983) 157–172.
- Wu et al. [2007] Z. Wu, C. Lagorio, L. A. Braunstein, R. Cohen, S. Havlin, H. E. Stanley, Physical Review E 75 (2007) 066110.
- Miller [2007] J. C. Miller, Phys. Rev. E 76 (2007) 010101.
- Kenah and Robins [2007] E. Kenah, J. M. Robins, Phys. Rev. E 76 (2007) 036113.
- Lagorio et al. [2009] C. Lagorio, M. Migueles, L. Braunstein, E. López, P. Macri, Phys. A 388 (2009) 755–763.
- Helbing et al. [2006] D. Helbing, M. Treiber, A. Kestingand, Physica A 363 (2006) 62–72.
- Nekovee et al. [2007] M. Nekovee, Y. Moreno, G. Bianconi, M. Marsili, Physica A 374 (2007) 457–470.
- Barabási and Albert [1999] A.-L. Barabási, R. Albert, Science 286 (1999) 509.
- Braunstein et al. [2007] L. A. Braunstein, Z. Wu, Y. Chen, S. V. Buldyrev, T. Kalisky, S. Sreenivasan, R. Cohen, E. López, S. Havlin, H. E. Stanley, I. J. Bifurcation and Chaos 17 (2007) 2215–2255.
- Opsahl et al. [2008] T. Opsahl, V. Colizza, P. Panzarasa, J. Ramasco, Phys Rev Lett 101 (2008) 168702.
- Barrat et al. [2004] A. Barrat, M. Barthelemy, R. Pastor-Satorras, A. Vespignani, Proc. Natl. Acad. Sci. USA 101 (2004) 3747.
- Balcan et al. [2009] D. Balcan, H. Hu, B. Goncalves, P. Bajardi, C. Poletto, J. J. Ramasco, D. Paolotti, N. Perra, M. Tizzoni, W. V. den Broeck, V. Colizza, , A. Vespignani, BMC Medicine 7 (2009) 45.
- Braunstein et al. [2003] L. A. Braunstein, S. V. Buldyrev, R. Cohen, S. Havlin, H. E. Stanley., Phys. Rev. Lett. 91 (2003) 168701.
- Sreenivasan et al. [2004] S. Sreenivasan, T. Kalisky, L. Braunstein, S. Buldyrev, S. Havlin, H. Stanley., Phys. Rev. E 70 (2004) 046133.
- Porto et al. [1998] M. Porto, S. Havlin, H. E. Roman, A. Bunde, Phys. Rev. E 58 (1998) 5205.
- Cieplak et al. [1996] M. Cieplak, A. Maritan, J. R. Banavar, Phys. Rev. Lett. 76 (1996) 3754.
- Braunstein et al. [2001] L. A. Braunstein, S. V. Buldyrev, S. Havlin, H. E. Stanley, Phys. Rev. E 65 (2001) 056128.
- Erdös and Rényi [1959] P. Erdös, A. Rényi, Publications Mathematicae 6 (1959) 290–297.
- Kolmogorov and Akad [1941] A. N. Kolmogorov, D. Akad, Nauk SSSR. 31 (1941) 99–101.
- Ishii and Matsushita [1993] T. Ishii, M. Matsushita, J. Phys. Soc. Jpn. 61 (1993) 3474–3477.
- Montroll and Shlesinger [1983] E. W. Montroll, M. F. Shlesinger, J. Stat. Phys. 32 (1983) 209–230.
- Lawrence [1988] R. J. Lawrence, The Lognormal as Event-Time Distribution - Theory and Applications, Inc. Cambridge, 1988.
- Kobayashi et al. [2007] N. Kobayashi, K. Kohyama, C. Kobori, Y. Sasaki, M. Matsushita, J. Phys. Soc. Jpn. 76 (2007) 044002.
- Ben-Naim and Krapivsky [2004] E. Ben-Naim, P. L. Krapivsky, Phys. Rev. E 69 (2004) 050901.
- Cohen et al. [2000] R. Cohen, K. Erez, D. ben-Avraham ben-Avraham ben-Avraham ben-Avraham ben-Avraham ben-Avraham ben Avraham, S. Havlin, Phys. Rev. Lett. 85 (2000) 4626–4628.