IRS-TR 12003: Constructing Low-Resolution Truth Spectra of the Standard Stars HR 6348 and HD 173511
Abstract
This report describes the generation of fully calibrated spectra of the K giants HR 6348 and HD 173511 from data obtained with the low-resolution modules of the Infrared Spectrograph (IRS), with an emphasis on the spectra from the Long-Low (LL) module. The spectra were calibrated using Kurucz models and IRS observations of the A dwarfs Lac and UMi. The calibration process required mitigation for fringing in the first-order LL spectrum and a faint red excess in Lac which may arise from a low-contrast debris disk. The final calibrated spectrum of HR 6348 has a spectroscopic fidelity of 0.5% or better below 29 \mum, with an uncertainty increasing to 1% at 33–37 \mum. The final calibrated spectrum of HD 173511 has a spectroscopic fidelity of 0.5% at all wavelengths below 35.8 \mum.
1 Introduction
IRS-TR 12002 (Sloan & Ludovici 2012b) described the generation of a “truth” spectrum of the K giant HR 6348 for use with Short-Low (SL) module of the IRS. Truth spectra are fully calibrated spectra of a standard star which can in turn be used to calibrate other spectra. The approach was to use SL observations of HR 6348, combined with observations and Kurucz models of the A dwarfs Lac and UMi. This report describes the procedure for the Long-Low (LL) module and the assembly of full low-resolution spectra using both SL and LL. The resulting spectra for HR 6348 and HD 173511 can be used as truth spectra for the calibration of all LL observations. The method for LL is generally similar to that for SL.
The detector settings for LL were altered at the beginning of IRS Campaign 45 (29 October, 2007), requiring different calibrations for data taken through Campaign 44 and data taken from Campaign 45 to 61, when the cryogenic Spitzer mission ended.
2 Procedure
As described in IRS-TR 12002, we begin the calibration process with a Kurucz model of an early A dwarf supplied to the IRS Team by M. Cohen, shifted to the wavelength grids and resolutions of SL and LL, and scaled photometrically to match the Red Peak-Up (PU) photometry of Lac and UMi.
We first generated a calibrated LL spectrum of HR 6348 using data from Campaign P in the Science Verification phase and Campaigns 1–44 during normal science operations. We then used this spectrum to calibrate all of the other data from the same time period and from those data constructed a calibrated spectrum of HD 173511. This star has a spectral class of K5 III; its later spectral class leads to a deeper SiO absorption band at 8 \mum compared to HR 6348, and for this reason we have avoided its use to calibrate SL. It is still a good standard for LL, and because of the limited calibration data available from the change in detector settings for LL in Campaign 45 to the end of the cold Spitzer mission, both stars are needed to produce a spectral correction with a high signal/noise ratio.
The procedure follows the general outline used in SL, where we combined the calibrations of HR 6348 using Lac and UMi order by order, assembled the orders, and then mitigated for any remaining detectable artifacts. However, the detailed procedure differs in several ways from SL, due to differences in instrumental performance and stellar emission in the two wavelength regimes.
We used all of the HR 6348 spectra observed from IRS Campaign P through Campaign 44. For SL, we excluded poorly pointed data, but for LL, the throughput is largely unchanged from one pointing to the next because the pointing errors are small compared to the larger size of the LL slit (10”).
We also changed how we combine the spectra from the two nod positions. In SL, we carefully compared the separate spectra, avoiding structure in one nod position not seen in the other. In LL, however, the spectra from the two nods show similar structure on fine wavelength scales, and we have simply averaged them.
In SL, we used a spline-smoothing algorithm to force the spectra calibrated with Lac and UMi to a similar averaged shape, and again carefully avoided structure in one calibration not seen in the other. Here again the LL procedure differs. Both calibrations showed similar degrees of structure, so both were used at all wavelengths. However, the overall shapes of the two spectra differ, with the spectrum of HR 6348 dropping more steeply to longer wavelengths when calibrated with Lac than with UMi. From 15 to 37 \mum, the two calibrations have a 3% difference in slope.
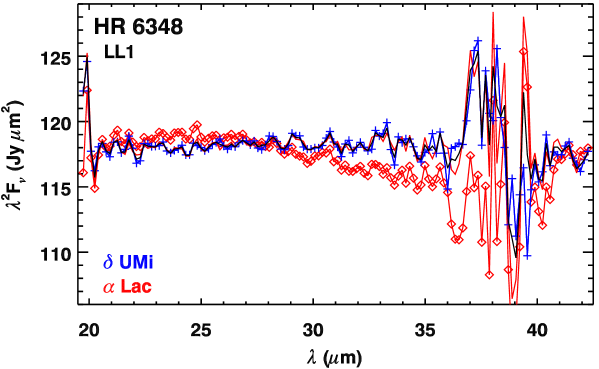
Figure 1 shows the spectrum of HR 6348 as calibrated with the two A dwarfs in LL Order 1 (LL1). The calibration based on Lac actually falls more steeply than a Rayleigh-Jeans tail (which would be horizontal in the units plotted) and is not physically realistic. The most likely explanation is that the IRS spectrum of Lac includes a red excess, which while low-contrast, appears to be real. It probably arises from a debris disk. Consequently, we use the spline averaging in all three LL orders to force the overall shape of the calibration based on Lac to align with the calibration based on UMi while preserving the spectral structure on finer wavelength scales.
3 Long-Low Order 1
Figure 1 illustrates the construction of the LL1 spectrum of HR 6348. For wavelengths between 20 and 36 \mum, the structure in the spectrum generally deviates by less than 1% from a Rayleigh-Jeans tail. Moving past 36 \mum, the quality of the data grow rapidly worse with increasing wavelength. The apparent improvement at 40 \mum is misleading. Beyond 40 \mum, a second-order spectrum overlaps the first order, leading to contamination of the spectrum with emission from wavelengths of 20 \mum.
4 Long-Low Order 2
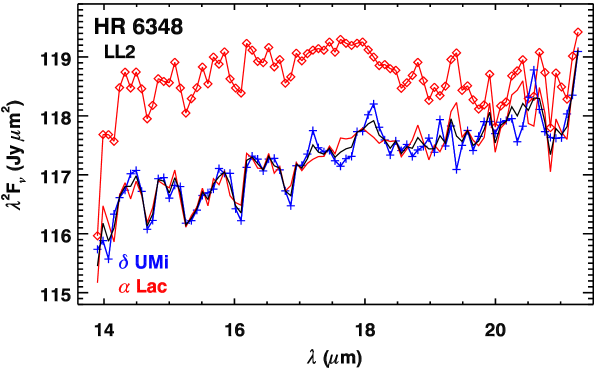
Figure 2 shows the construction of the LL2 spectrum of HR 6348. The procedure is identical to LL1, with the calibration using Lac forced to the general shape of the UMi calibration to compensate for the red excess in the former. Excluding the endpoints of the spectrum, all of the structure is less than 1% of the continuum, peak-to-peak. Below 17 \mum, the structure is intrinsic to HR 6348 and is due to OH band absorption.
5 Long-Low Bonus Order
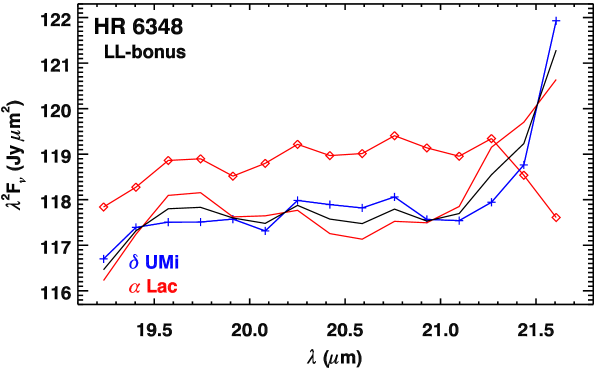
Figure 3 illustrates the construction of the spectrum of HR 6348 in the LL-bonus order. The procedure is identical to that used in the other two orders.
| Table 1—Wavelength Ranges | ||
|---|---|---|
| Spectral segment | Full range (\mum) | Useful range (\mum) |
| LL2 | 13.90–21.27 | 13.98–20.54 |
| LL-bonus | 19.23–21.61 | 19.40–21.10 |
| LL1 | 19.74–42.27 | 20.59–36.85 |
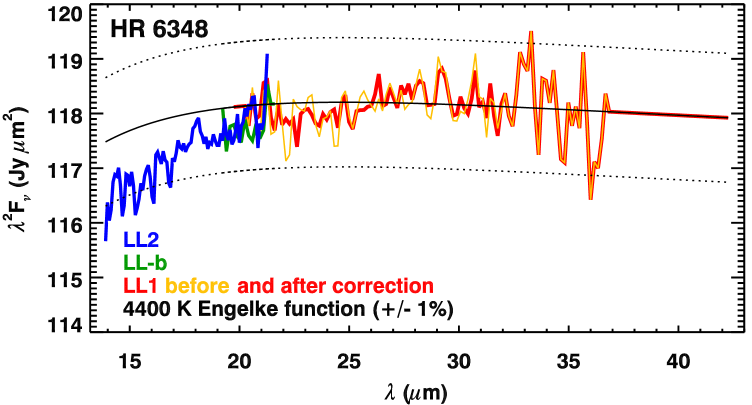
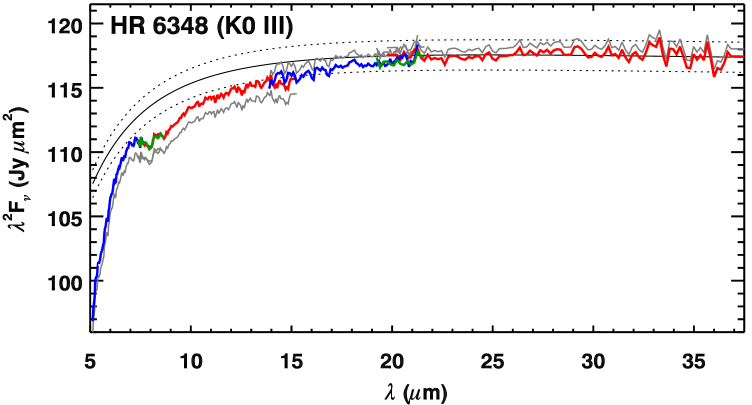
Figure 4 presents the full LL spectrum of HR 6348 after mitigating for the remaining problems. A 4400 K Engelke function fitted to the range of valid data in LL1 serves as a good reference (Engelke 1992). We have also used it to replace invalid data at the ends of some of the segments. In LL1, this includes all data past 37 \mum, where the combination of dropping responsivity in the detector and the 1/ dependence of the emission from the star leaves the S/N of our coadded spectrum too low to be trustworthy. We have also used the fitted Engelke function to replace other data outside the useful range of the LL orders where those data are unreliable. These ranges include the first four wavelength elements of LL1 (19.74–20.25 \mum), and for the LL-bonus order, the first element (19.23 \mum) and the last two (21.43–21.61 \mum). We have left the remaining data outside the useful ranges alone because they are close enough to the expected values that replacement is unwarranted.
Figure 4 plots the LL1 data before and after a correction for residual fringing. This fringing arises from interference caused by partial delamination of the LL1 filter prior to launch. It generally cancels out when a spectral correction is applied, but residuals can remain due to differences in pointing between a science target and the suite of calibrators. In HR 6348, this residual fringing survives at a level of 0.6%. Because the OH band structure apparent in LL2 continues into LL1 with a periodicity similar to the fringing, we cannot use the HR 6348 data to determine a fringing solution. Instead, we have used LL1 spectra of two red standards, Mrk 231 and IRAS 07598+6508. For these sources, we fitted the continuum with a sixth-order polynomial and assumed that any deviations were due to fringing. We reduced the peak-to-peak amplitude of the resulting correction by a factor of two before applying it to HR 6348 to account for the stronger fringing observed in the red standards. We also limited our correction to wavelengths below 32 \mum because at longer wavelengths, the correction appeared to add more structure and/or noise to the spectrum than it removed.
6 Quality Assessment
The Engelke function in Fig. 4 provides a means of assessing the quality of the data in LL1, where the largest diversions are due to noise. The decreasing S/N from 21 to 37 \mum is readily apparent. Below 29 \mum, the data are generally within 0.5% of the Engelke function, and beyond 29 \mum, the bounds are about 1.0%. As mentioned above, the noise beyond 37 \mum has led us to use an Engelke function as the best means of estimating the true spectrum of HR 6348 despite its limitation of including no spectral structure.
The LL-bonus spectrum is within 0.5% of the Engelke function, although at these wavelengths, the actual spectrum of HR 6348 appears to be deviating from the shape of the Engelke function. This trend continues into LL2, and because it reflects the differences in the shapes of the spectra of HR 6348 and the A dwarf UMi, it indicates that the Engelke function does not accurately portray the shape of an early K giant over such a broad wavelength range. Most of the structure in the spectrum of LL2 arises from OH molecules and is probably real. The exception is the apparent emission feature at 18 \mum, which is likely to be an artifact. Even then, it is smaller than 0.5%. We conclude that below 29 \mum, the spectroscopic (point-to-point) fidelity of our calibrated LL spectrum of HR 6348 is 0.5% or better. Beyond, the spectroscopic fidelity grows worse, with a limit of 1% at 33 \mum and indeterminant beyond 37 \mum.
7 Assembling a Full Low-Resolution Spectrum of HR 6348
To produce a full low-resolution spectrum of HR 6348, we (1) combined the LL spectrum described here with the SL spectrum described by IRS-TR 12002, (2) shifted the LL1 spectrum multiplicatively to match the Red PU photometry determined by IRS-TR 11002 (Sloan & Ludovici 2011), and (3) shifted the remaining orders multiplicatively to eliminate discontinuities between them.
| Table 2—Multiplicative corrections for HR 6348 | |
|---|---|
| Spectral segment | Multiplicative correction |
| SL2 and bonus | 1.0108 |
| SL1 | 1.0103 |
| LL2 and bonus | 0.9937 |
| LL1 | 0.9950 |
Figure 5 illustrates the process, and Table 2 lists the multiplicative corrections applied to each segment. The correction for LL1 is determined by forcing synthetic photometry from the spectrum to match the actual Red PU photometry (IRS-TR 11002). The normalizations of SL2 to SL1 and LL2 to LL1 take advantage of the fact that the bonus orders are observed simultaneously with the second-order spectra and overlap the first-order spectra. The normalization between SL1 and LL2 was determined by hand to eliminate any discontinuities across the boundary. The largest order-to-order correction, between SL1 and LL2, was 1.7%, with SL1 having to come up to meet LL2, as is usually the case due to the pointing-induced loss of flux in the smaller SL slit.
We recommend that this spectrum of HR 6348 serve as the truth spectrum to calibrate all of the SL data obtained by the IRS, and all LL data prior to the change in detector settings at the beginning of IRS Campaign 45.
8 HD 173511
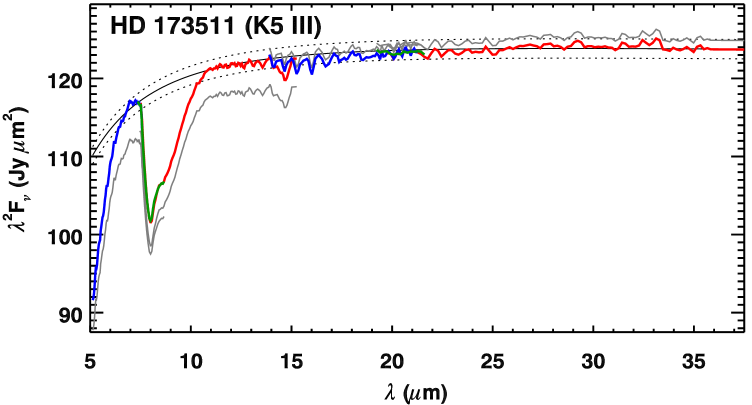
The limited number of observations of HR 6348 from Campaign 45 to the end of the cryogenic mission drives the need for a second standard to calibrate the LL data after the change in detector settings. Using HR 6348 as the standard, we calibrated all SL observations of HD 173511 and all LL observations up to Campaign 44 (inclusive). Following the usual rejection procedures for the SL data (see IRS-TR 12001, Sloan & Ludovici 2012a) and using all of the LL data, we generated the spectrum shown in gray in Figure 6.
| Table 3—Multiplicative corrections for HD 173511 | |
|---|---|
| Spectral segment | Multiplicative correction |
| SL2 and bonus | 1.0438 |
| SL1 | 1.0304 |
| LL2 and bonus | 0.9931 |
| LL1 | 0.9907 |
As with HR 6348, we have replaced some data at the ends of the orders in the spectrum of HD 173511. We use a 3800 K Engelke function to replace all data from 35.83 \mum to the red in LL1. We replaced the first four elements of LL1 (19.74–20.25 \mum) with data from LL2, and the two red-most elements in LL2 (21.18–21.27 \mum) and the two red-most elements in the bonus order (21.44-21.61 \mum) with data from LL1.
The renormalization of the spectrum follows the procedure for HR 6348. To reproduce the Red PU and MIPS 24-\mum photometry, we shifted LL1 by almost 1% (see Table 2 in IRS-TR 11002). We then brought the remaining spectral segments into alignment. Table 3 gives the multiplicative corrections. The 3–4% shifts in SL, while larger than for HR 6348, are typical corrections for low-resolution IRS spectra.
The resulting spectrum should have a spectroscopic fidelity similar to HR 6348 in all orders except LL1. The OH bands are stronger in HD 173511 than in HR 6348, and we have not attempted to determine if the observed structure in LL1 is due to OH or to fringing. Despite this uncertainty, the deviations from a smooth spectrum in LL1 are smaller than 0.5% for 33 \mum and only slightly worse past that point. Beyond 35.8 \mum, we have applied a 3800 K Engelke function and do not estimate the fidelity.
We recommend the use of this truth spectrum, in conjunction with HR 6348, to calibrate LL IRS observations obtained in Campaign 45 or later (i.e. 2007 October 29 and on).
9 Conclusion
This report describes the construction of a truth spectrum for the early K giant HR 6348 from IRS observations of it and the A dwarfs Lac and UMi. This spectrum required mitigation for (1) artifacts in the vicinity of Pfund- at 7.45 \mum, (2) a red excess apparent in the LL spectrum of Lac, possibly due to a debris disk, and (3) fringing in LL1 in the spectrum of HR 6348. Using HR 6348 as a standard, we also calibrated a truth spectrum for the late K giant HD 173511.
| Table 4—Intended and actual flux densities | ||||||
| Target | Intended | Actual | Intended | Actual | ||
| (mJy) | (mJy) | (%) | (mJy) | (mJy) | (%) | |
| HR 6348 | 235.0 | 235.0 | 0.00 | 209.4 | 209.5 | 0.05 |
| HD 173511 | 246.9 | 246.7 | 0.08 | 220.0 | 220.2 | 0.09 |
Table 4 compares the intended flux densities to the actual results of synthetic photometry for IRS Red Peak-Up and MIPS at 24 \mum for the truth spectra of both K giants. In the 22–24 \mum range, the differences are less than 0.1%, as designed. The accuracy of the spectra at other wavelengths depends on the accuracy of the shape. To longer wavelengths, the spectra follow an Engelke function to within 1% or better (Fig. 5 and 6).
To shorter wavelengths, both spectra diverge by more than 1% from the expected continuum shape. HR 6348 drops more steeply to shorter wavelengths. For HD 173511, if we assume that the local peak at 7 \mum, between the CO absorption to the blue and SiO absorption the red, is slightly below the actual continuum in that region (due to overlap of wings of the two molecular bands), then this spectrum does not drop steeply enough, perhaps by 2%. These small errors in the shape of the SL are a natural consequence of small throughput errors from the individual pointings coadded to generate the plotted spectra, and these throughput errors, which are a function of both wavelength and pointing, have been the subject of many previous technical reports (see IRS-TR 12001 for a recent analysis). Ultimately, they must lead to limits on the photometric fidelity (i.e., overall shape) of the shape of any spectrum observed with SL.
The truth spectra described here are available electronically. They can be obtained at: http://isc.astro.cornell.edu/IRS/TruthSpectra.
References
- [1] Engelke, C. W. 1992, AJ, 104, 1248
- [Sloan & Ludovici(2011)] Sloan, G.C. & Ludovici, D. A. 2011, “IRS-TR 11002: Calibration of the Acquisition Images from the Red Peak-Up Sub-Array.”
- [Sloan & Ludovici(2012a)] Sloan, G.C. & Ludovici, D. A. 2012a “IRS-TR 12001: Spectral Pointing-Induced Throughput Error and Spectral Shape in Short-Low Order 1.”
- [Sloan & Ludovici(2012b)] Sloan, G.C. & Ludovici, D. A. 2012b “IRS-TR 12002: Constructing a Short-Low Truth Spectrum of the Standard Star HR 6348.”