Unveiling a network of parallel filaments in the Infrared Dark Cloud G14.225–0.506
Abstract
We present the results of combined NH3 (1,1) and (2,2) line emission observed with the Very Large Array and the Effelsberg 100 m telescope of the Infrared Dark Cloud G14.225–0.506. The NH3 emission reveals a network of filaments constituting two hub-filament systems. Hubs are associated with gas of rotational temperature 15 K, non-thermal velocity dispersion 1 km s-1, and exhibit signs of star formation, while filaments appear to be more quiescent (11 K, 0.6 km s-1). Filaments are parallel in projection and distributed mainly along two directions, at PA10 and 60, and appear to be coherent in velocity. The averaged projected separation between adjacent filaments is between 0.5 pc and 1 pc, and the mean width of filaments is 0.12 pc. Cores within filaments are separated by 0.330.09 pc, which is consistent with the predicted fragmentation of an isothermal gas cylinder due to the ‘sausage’-type instability. The network of parallel filaments observed in G14.225–0.506 is consistent with the gravitational instability of a thin gas layer threaded by magnetic fields. Overall, our data suggest that magnetic fields might play an important role in the alignment of filaments, and polarization measurements in the entire cloud would lend further support to this scenario.
Subject headings:
stars: formation — ISM: clouds — ISM: individual objects (G14.225–0.506)1. Introduction
Filaments are ubiquitous structures in star forming complexes (e. g., Schneider & Elmegreen, 1979; Wiseman & Ho, 1998; Hatchell et al., 2005; Goldsmith et al., 2008; Wang et al., 2008; Jackson et al., 2010; Schneider et al., 2010; Molinari et al., 2010; André et al., 2010; Arzoumanian et al., 2011), and often intersect in high-density regions of low aspect ratio and associated with star formation, known as hub-filament systems (e. g., Myers, 2009; Liu et al., 2012). However, their formation and their role in the star formation process is not well understood yet.
In nearby (200–500 pc) molecular clouds, recent photometric results from Herschel suggest that large-scale turbulence might be responsible for the formation of filaments (Arzoumanian et al., 2011), while spectroscopic studies, sensitive to smaller scales, show that filaments present subsonic non-thermal motions (Hacar & Tafalla, 2011; Pineda et al., 2011), indicative of a dissipation of turbulence at smaller scales. While this is consistent with observations in more distant and massive star-forming regions, such as G28.34+0.06 (Wang et al., 2008), a number of studies reveal supersonic non-thermal motions and suggest the formation of filaments by the convergence of flows or by filament-filament collisions on large scales (Schneider et al., 2010; Csengeri et al., 2011; Heitsch et al., 2008; Jiménez-Serra et al., 2010; Henshaw et al., 2012; Miettinen, 2012; Nakamura et al., 2012). In addition, theoretical studies propose that magnetic fields could play a role in the formation of filaments (e. g., Nagai et al., 1998; Nakamura & Li, 2008). It is clear, then, that several formation mechanisms have been invoked to explain the formation and alignment of filaments and therefore further spectroscopic studies of filamentary regions are essential to investigate the origin and evolution of such structures.
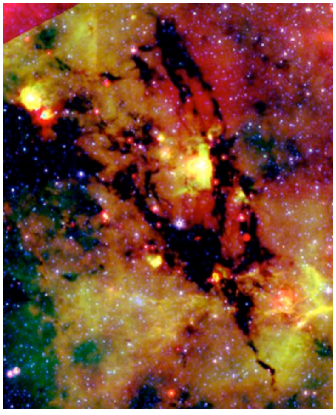
Filaments are prevailing structures in Infrared Dark Clouds (IRDCs, cf. Rathborne et al. 2006). In this Letter we present combined Very Large Array (VLA) and Effelsberg 100 m telescope observations of the NH3 (1,1) and (2,2) transitions toward the IRDC G14.225–0.506 (hereafter G14.2). Most of the studies performed so far toward this region focus on the brightest infrared sources, IRAS 18153–1651 (hereafter I18153) and IRAS 18152-1658 (hereafter I18152) with a luminosity of 1.1 and 4 , respectively, and located at a distance of 2.3 kpc (Jaffe et al., 1981, 1982). Single-dish observations show that I18153 is associated with H2O maser emission (Jaffe et al., 1981; Palagi et al., 1993), and dense gas emission (Plume et al., 1992; Anglada et al., 1996; Bronfman et al., 1996). More recent VLA observations reveal H2O maser emission in 9 different positions (Wang et al., 2006), which indicates that star formation is already ongoing in some parts of the cloud. IRDC G14.2 has been identified, using Spitzer data, by Peretto & Fuller (2009) as a cloud containing an important amount (100) of density enhancements or fragments displaying a filamentary morphology. The filamentary appearance of G14.2 (Fig. 1) and its relatively nearby distance makes this region a good selection to investigate the physical properties of filaments and their formation mechanism at high spatial resolution.
 |
2. Observations
The observations of the NH3 (1,1) and (2,2) transitions were conducted using the VLA111 The Very Large Array (VLA) is operated by the National Radio Astronomy Observatory (NRAO), a facility of the National Science Foundation operated under cooperative agreement by Associated Universities, Inc. in the D configuration on November 12 2005 (project AW666). We performed a 34-pointing mosaic covering an area of . The integration time was 4.5 minutes per pointing. The adopted flux density of the flux calibrator 3C 286 was 2.41 Jy at a wavelength of 1.3 cm. The time variation of the gains was calibrated using J1832–105, with a bootstrapped flux of 0.970.01 Jy, and the bandpass calibrator used was 3C 273. We used the 4IF spectral line mode, which allows simultaneous observations of the NH3 (1, 1) and (2, 2) lines with two polarizations for each line. The bandwidth used was 3.12 MHz, divided into 63 channels with a channel spacing of 48.8 kHz (0.6 km s-1 at 1.3 cm), centered at 21 km s-1. The visibility data sets were calibrated using the AIPS software package of the NRAO.
To recover extended structures filtered out by the interferometer, we performed NH3 observations with the Effelsberg 100 m telescope (project 101-07). The observations were carried out between April 4 and 7 2008. We used the 18-26 GHz HEMT receiver tuned to a frequency of 23.7 GHz with the 16384 channel Fast Fourier Transform Spectrometer, allowing simultaneous observations of the NH3 (1,1) and (2,2) lines. The total bandwidth used was 100 MHz, which provides a velocity resolution of 0.075 km s-1. The observations were conducted in frequency switching mode with a frequency throw of 7.5 MHz. At the observed wavelength, the half-power beamwidth of the telescope is 40′′. The map covered an area of and was made by observing the positions of a grid with half-beam spacing. Pointing was checked at hourly intervals, with a pointing accuracy better than 8′′. To convert the arbitrary noise tube units of the Effelsberg data to main beam brightness temperature we observed as a primary flux calibrator NGC 7027 and a nearby quasar as a secondary flux calibrator. Data reduction was performed using the CLASS package, which is part of the GILDAS222http://www.iram.fr/IRAMFR/GILDAS sofware. We combined the visibility data from the VLA and Effelsberg 100 m telescope for both NH3 (1, 1) and NH3 (2, 2) lines following the MIRIAD procedure outlined in Vogel et al. (1984). We applied a -taper function of 23 during imaging. The resulting synthesized beams were (PA) for NH3 (1,1) and (PA) for NH3 (2,2). The rms was 8 m per 0.6 km s-1 spectral channel.
 |
 |
3. Results and Analysis
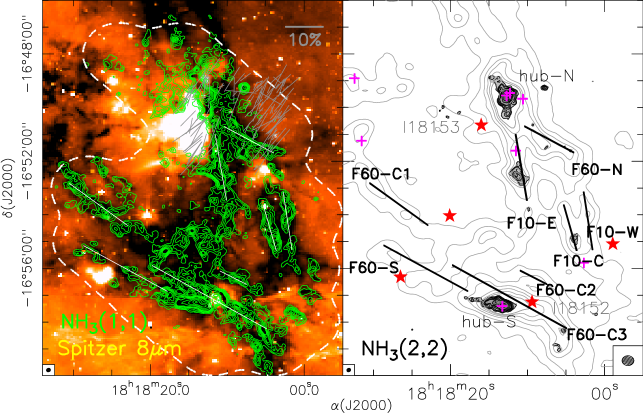
Figure 2 (top left) shows the combined (VLA+Effelsberg) zero-order moment map of the NH3 (1,1) emission overlaid on the 8 m Spitzer image. The overall morphology of the NH3 (1,1) dense gas consists of extended and clumpy filamentary structures, strikingly mimicking the extinction feature seen in the Spitzer image. While the NH3 (1,1) emission is spatially extended, the NH3 (2,2) emission is compact (Fig. 2-top right), suggesting that the extended emission is at lower temperatures. We identified the most prominent filaments based on the morphology of the NH3 (1,1) together with the fact that these structures are coherent in velocity. We used the following criteria: i) filaments must have aspect ratio larger than 6; ii) the signal-to-noise ratio should be larger than 9333Signal-to-noise ratio computed in the zero-order moment map of NH3 (1,1), where the rms noise level has been estimated using /, where is the rms noise of the channel maps and =0.6 km s-1.; and iii) they must appear in at least two velocity channels and spanning a maximum velocity range of 3 km s-1. Fig. 2 (top right) shows, for comparison, the 870 m continuum emission from the LABOCA bolometer at the APEX telescope (Busquet, 2010), supporting our identification.
We identified a network of 8 filaments and two hubs (named hub-N and hub-S in Fig. 2), which were recognized using the NH3 (2,2) emission as denser regions in which some filaments intersect. The NH3 filaments, which cover a total area of 4.78.7 pc, appear approximately parallel, in projection, in two preferred directions, at PA of 10 and 60, and they contain chains of dense cores444Cores have been identified in the zero-order moment map of NH3 (1,1) if at least the level is closed, where is the rms noise of the map. aligned along the filament axis and distributed at somewhat regular spacings of about 30′′ or 0.330.09 pc at the distance of the cloud. The averaged projected separation between adjacent filaments is between 0.5 pc and 1 pc. In Table 1 we report on the length and width at Full Width Half Maximum () of each filament obtained from NH3 (1,1) data. On average, we found that the aspect ratio is 15:1, with a typical width of 0.12 pc. This value is close to the filament width of 0.1 pc reported for the IC 5146, Aquila, and Polaris molecular clouds from Herschel observations (Arzoumanian et al., 2011).
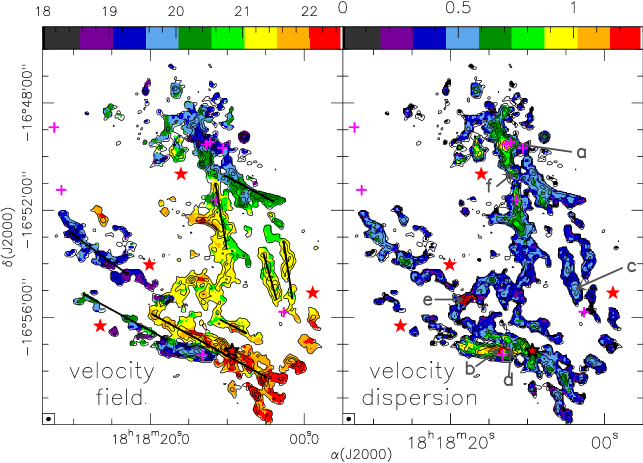
In Fig. 2 (bottom left) we present the first-order moment map of the NH3 (1,1) main line. Within each filament the velocity variations are small, in the range of 1–2 km s-1 (see Table 1), similar to other filamentary IRDCs (e. g., Jackson et al., 2010). This network of filaments seems to be separated into two main velocity components, one at 18.3–20.8 km s-1 and another one at 20.8–23.2 km s-1, which overlap in the hubs. The second-order moment map is presented in Fig. 2 (bottom right), and shows that the velocity dispersion is locally enhanced (1 km s-1) toward hubs. Additionally, a high velocity dispersion (1.6 km s-1) is seen toward an arc-shaped structure connecting filament F10-E with the southern filaments, in a small region intersecting filament F60-C1 and labelled as position ‘e’ in Fig. 2. In this region the large values of the velocity dispersion are due to the presence of two velocity components separated by 3 km s-1 (see Fig. 3-e). The presence of two velocity components is also found in regions where filaments intersect hubs (see Fig. 3-d,f). In contrast, all the other filaments appear more quiescent, with a typical velocity dispersion of 0.4–0.6 km s-1.
 |
| lengtha | widtha | aspect | b c | c | c | c d | c e | e | f | f | g | ||
|---|---|---|---|---|---|---|---|---|---|---|---|---|---|
| Filament | (pc) | (pc) | ratio | (km s-1) | (K) | (km s-1) | ( pc-1) | ( pc-1) | (pc) | (pc) | |||
| F10-W | 1.48 | 0.11 | 13.5 | 20.8–22.0 | 102 | 0.49 | 2.38 | 105 | 112 | 1.1 | 0.270.08 | 0.16–0.40 | 6 |
| F10-C | 1.18 | 0.14 | 8.4 | 20.8–22.0 | 101 | 0.50 | 2.31 | 147 | 115 | 0.8 | 0.330.07 | 0.16–0.41 | 4 |
| F10-E | 1.63 | 0.15 | 10.9 | 20.2–22.0 | 161 | 0.98 | 3.63 | 87 | 448 | 5.1 | 0.320.11 | 0.21–0.80 | 10 |
| F60-N | 1.23 | 0.09 | 13.7 | 19.5–20.8 | 122 | 0.54 | 2.31 | 149 | 135 | 0.9 | 0.250.09 | 0.18–0.44 | 7 |
| F60-C1 | 1.81 | 0.12 | 15.1 | 18.3–20.2 | 103 | 0.63 | 3.10 | 120 | 185 | 1.5 | 0.380.11 | 0.16–0.52 | 8 |
| F60-C2 | 0.66 | 0.09 | 7.3 | 20.8–22.6 | 103 | 0.61 | 3.03 | 74 | 174 | 2.3 | 0.490.09 | 0.16–0.50 | 5 |
| F60-C3 | 3.34 | 0.12 | 27.8 | 21.4–23.2 | 101 | 0.73 | 3.67 | 218 | 248 | 1.1 | 0.250.12 | 0.16–0.60 | 14 |
| F60-S | 2.12 | 0.10 | 21.2 | 18.3–20.8 | 103 | 0.98 | 5.02 | 132 | 447 | 3.4 | 0.380.11 | 0.16–0.80 | 6 |
| Hub-N | 1.12 | 0.23 | 4.9 | 17.7–20.8 | 151 | 0.98 | 3.80 | 266 | 446 | 1.7 | … | … | |
| Hub-S | 1.15 | 0.23 | 5.0 | 18.3–20.8 | 151 | 1.09 | 4.31 | 328 | 548 | 1.7 | … | … |
-
a
Deconvolved size at Full Width Half Maximum () not corrected for projection effects.
-
b
has been derived following the appendix of Busquet et al. (2009).
-
c
Averaged values within the area at .
-
d
Mass per unit length, where the mass, (H2) 2.8, has been estimated assuming an NH3 abundance of (average value measured in IRDCs; Pillai et al. 2006) and using the area of the filament at . The uncertainty in the mass is a factor of 3.
-
e
Virial mass per unit length , and virial paramter (Bertoldi & McKee, 1992)
-
f
: observed separation between cores within a filament. : predicted core separation , where is the scale height, with the isothermal sound speed (estimated by converting to kinetic temperature using the expression of Tafalla et al. (2004)), the gravitational constant, and the gas density at the center of the filament, adopted to be cm-3. The first value corresponds to the core separation using and the second value was obtained replacing by .
-
g
Number of cores within each filament.
To obtain the main physical properties (rotational temperature , total velocity dispersion , and mass per unit length ) of each filament, we extracted an averaged spectrum of NH3 (1,1) and (2,2) over the filament area at . The results are reported in Table 1. The rotational temperature ranges between 10 K and 16 K. The total velocity dispersion of the gas ranges from 0.5 km s-1 up to 1.1 km s-1, and the non-thermal velocity dispersion over the isothermal sound speed, , ranges between 2 and 5, implying that filaments in G14.2 are characterized by supersonic non-thermal motions. In Table 1 we also list the mass and virial mass per unit length, the observed separation between cores, and the number of cores in each filament. Finally, the total surface density estimated by taking the spectrum averaged over all NH3 filaments is 1.9 g cm-2.
 |
 |
4. Discussion and Conclusions
In the previous section we presented the main properties of the two hub-filament systems in G14.225–0.506. Hubs are more compact (aspect ratio 5 vs 15), warmer (15 K vs 11 K), and show larger velocity dispersion and larger masses per unit length than filaments. Interestingly, hubs are associated with H2O maser emission (Wang et al. 2006) and mid-infrared sources (see Figs. 1, 2), and they are the main sites of stellar activity within the cloud.
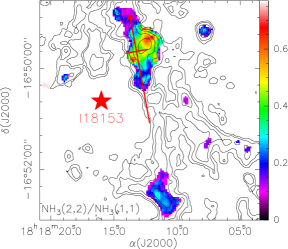
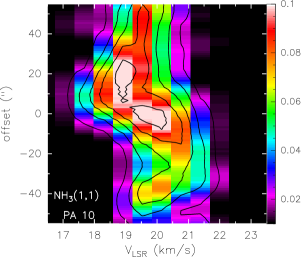
The stability of the filaments can be studied by estimating the virial parameter = (Bertoldi & McKee, 1992), which is 2 for all the filaments and hubs except for F10-E, and five out of eight filaments are near virial equilibrium (1). This indicates that most of the filaments are unstable (collapsing) and probably undergoing fragmentation, compatible with the clumpy structure of G14.2. It is worth noting that filament F10-E has and velocity dispersion values similar to the hub properties. Filament F10-E presents some striations converging toward it. However, while hub-N and hub-S seem to be places where two different velocity structures converge, F10-E shows only one velocity component. We speculate that I18153, an UC HII region with 104 (Sánchez-Monge, private communication), may compress the gas, heating and injecting turbulence to this filament (5). The interaction of this UC HII region with the dense gas is also seen in hub-N, where the NH3 (2,2)/NH3 (1,1) map shows a local heating (Fig. 4). The position-velocity (PV) plot along this hub (see Fig. 4) reveals an inverted C-like structure, consistent with an expanding shell (Arce et al., 2011).
We investigated the fragmentation of filaments in the magnetohydrodynamic ‘sausage’-type instability scenario (Chandrasekhar & Fermi 1953, see also Jackson et al. 2010), which predicts periodic separation between fragments (or cores) for a given density and isothermal sound speed. For an isothermal gas cylinder of finite radius , the core separation can be expressed as =22 for , where is the scale height (see Table 1 for the formal expression). This is the case of G14.2, since and are 0.12 pc and 0.04 pc, respectively. Adopting a density of cm-3, we estimated the predicted core separation using first the isothermal sound speed, yielding 0.16–0.21 pc, and then replacing by the total velocity dispersion , which gives 0.4–0.8 pc (see Table 1). The observed separation, 0.33 pc, is in agreement with these two extreme cases. It is noteworthy that most of the cores appear to be elongated along the direction of the filament, which could imply the possibility of further fragmentation at smaller scales as observed in the IRDC G28.34+0.06-P1 (Zhang et al., 2009; Wang et al., 2011).
One of the most intriguing features of G14.2 is the network of filaments that are aligned in parallel. The filaments appear to take two preferred directions, one group at a PA of 10, and the others at a PA of 60. This network of filaments may arise from a layer of self-gravitating gas. Instability analysis has been performed for a layer of an isothermal infinite sheet under dynamical perturbation (Ledoux, 1951; Schmid-Burgk, 1967; Elmegreen & Elmegreen, 1978; Larson, 1985; Nagai et al., 1998; Myers, 2009). The gas is unstable to perturbations, which leads to high density columns in the plane as a result of gravitational instability. The spacings between the high density columns of gas correspond to the wavelength of the fastest growth mode. In the absence of magnetic fields, the growth of instability does not have a preferred direction in the plane. As a result, a grid of connected filaments appears in the gas layer. If the gas layer is threaded by magnetic fields, the growth of the instability develops unrestricted in one direction and is suppressed along the orthogonal direction. Nagai et al. (1998) analyzed a pressure confined isothermal gas layer threaded by uniform magnetic fields. They found that in the regime of smaller external pressure (i. e., the scale height , where is the thickness of the gas layer) the instability grows faster along the field lines. As a consequence, high density columns, or filaments develop with their longitudinal axis perpendicular to the field lines. In the high pressure regime (i. e., ), the fastest growth of instability is perpendicular to the field lines and gives rise to filaments parallel to the magnetic fields.
Recent numerical simulations (Van Loo, private communication) confirm the linear analysis in Nagai et al. (1998). The simulations show that an array of high density columns develop in the gas layer with magnetic fields. In addition, lower density filamentary structures are also present, inter-connecting the main filaments. The highest density structures are found at the intersections of major and minor filaments, as in this work. Furthermore, the simulations show that gravitational instability develops within a filament during the filament formation. This means that fragmentation of a filament into cores occurs simultaneously with the fragmentation of the sheet, but according to Toalá et al. (2012) with different free-fall times.
The array of filamentary structures in G14.225–0.506 may arise from gravitational instability of a thin gas layer with magnetic fields. In fact, preliminary near-infrared polarimetric observations around hub-N (Busquet et al. in prep.) reveal that the magnetic field is perpendicular to filaments at PA60 (see Fig. 2). Therefore, according to Nagai et al. (1998) G14.2 would be in the regime of small external pressure (). Using the total surface density (see Sect. 3), the scale height of the initial gas layer is 0.09 pc. This value should be regarded with caution, and to definitively assess its validity one would need observations of a low-density gas tracer to be sensitive to the gas layer. The wavelength of the fastest mode can be expressed as (Eq. 60 in Nagai et al. 1998). Using our estimation of , the predicted separation is 1.1 pc, in agreement with the observed filament separation (between 0.5 and 1 pc). It is not clear how such a large gas layer (4.78.7 pc) may form initially. The convergence of dynamic flows could be responsible for the formation of such a large gas layer that subsequently could fragment into parallel filaments as a result of magnetic modulation. Our NH3 data, although showing two velocity components, do not reveal evidence of converging/interacting flows and further observations of low-velocity shock tracers, like SiO or CH3CN (Jiménez-Serra et al., 2010; Csengeri et al., 2011), and a tracer of low density material are required to definitely identify signatures of converging flows. Overall, our data suggest that magnetic fields might play an important role in the alignment of filaments, and polarization measurements in the entire cloud would lend further support to this scenario.
References
- André et al. (2010) André, P., Men’shchikov, A., Bontemps, S., Könyves, V., Motte, F. et al. 2010, A&A, 518, L102
- Anglada et al. (1996) Anglada, G., Estalella, R., Pastor, J., Rodríguez, L. F., & Haschick, A. D. 1996, ApJ, 463, 205
- Arce et al. (2011) Arce, H. G., Borkin, M. A., Goodman, A. A., Pineda, J. E., & Beaumont, C. N. 2011, ApJ, 742, 105
- Arzoumanian et al. (2011) Arzoumanian, D., André, P., Didelon, P., Könyves, V., Schneider, N., et al. 2011, A&A, 529, L6
- Bertoldi & McKee (1992) Bertoldi, F. & McKee, C. F. 1992, ApJ, 395, 140
- Bronfman et al. (1996) Bronfman, L., Nyman, L. -A., & May, J. 1996, A&ASS, 115, 81
- Busquet (2010) Busquet, G. 2010, Ph.D. Thesis, Universitat de Barcelona
- Busquet et al. (2009) Busquet, G., Palau, A., Estalella, R., Girart, J. M., Anglada, G., & Sepúlveda, I. 2009, A&A, 506, 1183
- Chandrasekhar & Fermi (1953) Chandrasekhar, S., & Fermi, E. 1953, ApJ, 118, 116
- Csengeri et al. (2011) Csengeri, T., Bontemps, S., Schneider, N., Motte, F., Gueth, F., & Hora, J. L. 2011, ApJ, 740, L5
- Elmegreen & Elmegreen (1978) Elmegreen, B., & Elmegreen, D. 1978, ApJ, 220, 1051
- Goldsmith et al. (2008) Goldsmith, P. F., Heyer, M., Narayanan, G., Snell, R., Li, D., & Brunt, C. 2008, ApJ, 680, 428
- Hacar & Tafalla (2011) Hacar, A. & Tafalla, M. 2011, A&A, 533, A34
- Hatchell et al. (2005) Hatchell, J., Richer, J. S., Fuller, G. A., Qualtrough, C. J., Ladd, E. F. & Chandler, C. J. 2005, A&A, 440, 151
- Heitsch et al. (2008) Heitsch, F., Hartmann, L. W., Slyz, A. D., Devriendt, J. E. G., & Burkert, A. 2008, ApJ, 674, 316
- Henshaw et al. (2012) Henshaw, J. D., Caselli, P., Fontani, F., Jimenez-Serra, I., Tan, J. C., & Hernandez, A. K. 2012, MNRAS, 295
- Jackson et al. (2010) Jackson, J. M., Finn, S. C., Chambers, E. T., Rathborne, J. M., & Simon, R. 2010, ApJ, 718, L185
- Jaffe et al. (1981) Jaffe, D. T., Güsten, R., & Downes, D. 1981, ApJ, 250, 621
- Jaffe et al. (1982) Jaffe, D. T., Stier, M. T., & Fazio, G. G. 1982, ApJ, 252, 601
- Jiménez-Serra et al. (2010) Jiménez-Serra, I., Caselli, P., Tan, J. C., Hernandez, A. K., Fontani, F., Butler, M. J., & van Loo, S. 2010, MNRAS, 406, 187
- Larson (1985) Larson, R. 1985, MNRAS, 214, 379
- Ledoux (1951) Ledoux, P. 1951, AnAp, 14, 438
- Liu et al. (2012) Liu, H. B., Jiménez-Serra, I., Ho, P. T. P., Chen, H.-R. , Zhang, Q., & Li, Z.-Y. 2012, ApJ, 756, 10
- Miettinen (2012) Miettinen, O. 2012, A&A, 542, A101
- Molinari et al. (2010) Molinari, S., Swinyard, B., Bally, J., Barlow, M., Bernard, J.-P., et al. 2010, A&A, 518, L100
- Myers (2009) Myers, P. C. 2009, ApJ, 700, 1609
- Nagai et al. (1998) Nagai, T., Inutsuka, S.-I., & Miyama, S. M. 1998, ApJ, 506, 306
- Nakamura & Li (2008) Nakamura, F., & Li, Z.-Y. 2008, ApJ, 687, 354
- Nakamura et al. (2012) Nakamura, F., Miura, T., Kitamura, Y., Shimajiri, Y., Kawabe, R. et al. 2012, ApJ, 746, 25
- Palagi et al. (1993) Palagi, F., Cesaroni, R., Comoretto, G., Felli, M., & Natale, V. 1993, A&ASS, 101, 153
- Peretto & Fuller (2009) Peretto, N. & Fuller, G. A. 2009, A&A, 505, 405
- Pillai et al. (2006) Pillai, T., Wyrowski, F., Carey, S. J.& Menten, K. M. 2006, A&A, 450, 569
- Pineda et al. (2011) Pineda, J. E., Goodman, A. A., Arce, H. G. , Caselli, P., Longmore, S., & Corder, S. 2011, ApJ, 739, L2
- Plume et al. (1992) Plume, R., Jaffe, D. T., & Evans II, N. J. 1992, ApJS, 78, 505
- Rathborne et al. (2006) Rathborne, J. M., Jackson, J. M., & Simon, R. 2006, ApJ, 641, 389
- Schmid-Burgk (1967) Schmid-Burgk, J. 1967, ApJ, 149, 727
- Schneider & Elmegreen (1979) Schneider, S., & Elmegreen, B. G. 1979, ApJS, 41, 87
- Schneider et al. (2010) Schneider, N., Csengeri, T., Bontemps, S., Motte, F., Simon, R., Hennebelle, P., Federrath, C., & Klessen, R. 2010, A&A, 520, A49
- Tafalla et al. (2004) Tafalla, M., Myers, P. C., Caselli, P., & Walmsley, C. M. 2004, A&A, 416, 191
- Toalá et al. (2012) Toalá, J. A., Vázquez-Semadeni, E., & Gómez, G. C. 2012, ApJ, 744, 190
- Vogel et al. (1984) Vogel, S. N., Wright, M. C. H., Plambeck, R. L. & Welch, W. J. 1984, ApJ, 283, 655
- Wang et al. (2011) Wang, K., Zhang, Q., Wu, Y., & Zhang, H. 2011, ApJ, 735, 64
- Wang et al. (2006) Wang, Y., Zhang, Q., Rathborne, J. M., Jackson, J., & Wu, Y. 2006, ApJ, 651, L125
- Wang et al. (2008) Wang, Y., Zhang, Q., Pillai, T., Wyrowski, F., Wu, Y. 2008, ApJ, 672, L33
- Wiseman & Ho (1998) Wiseman, J. J. & Ho, P. T. P. 1998, ApJ, 502, 676
- Zhang et al. (2009) Zhang, Q., Wang, Y., Pillai, T., & Rathborne, J. 2009, ApJ, 696, 268