Spatial correlations in finite samples revealed by Coulomb explosion
Abstract
We demonstrate that fast removal of many electrons uncovers initial correlations of atoms in a finite sample through a pronounced peak in the kinetic-energy spectrum of the exploding ions. This maximum is the result of an intricate interplay between the composition of the system from discrete particles and its boundary. The formation of the peak can be described analytically, allowing for correlations beyond a mean-field reference model. It can be experimentally detected with short and intense light pulses from 4th-generation light sources.
pacs:
36.40.Gk, 79.77.+gCorrelation effects beyond the mean-field description are important in understanding the detailed structure of matter. A major scheme has been the “exchange-correlation hole” indispensable in electronic-structure theory fu95 . While this research focuses on bound, mostly even on the ground state, very intense light pulses now available for XUV to X-ray energies mcth10 , create situations to probe correlation in the continuum. One phenomenon in this context is massively parallel ionization gnsa+12 of a cluster or large molecule: Many electrons are ionized almost simultaneously to an energy high enough such that the attractive ionic background does not play a role on the short time scale of energy exchange and correlation of electrons in the continuum.
Complementarily, one may ask how the many ions behave whose dynamics develops on a longer time scale when most of the electrons have left. Do the ions also develop a correlated motion in the continuum — and if so, what is its characteristics in terms of observables, e.g., the energy spectrum of the ions? The simplest description well-known from plasma physics approximates these ions as a continuous charge density. The corresponding spectrum provides a comparison for highlighting the differences to a correlated continuum calculation. They occur for two reasons: Firstly, the granularity of our system, i.e., the fact that we deal with real particles which typically have a minimal separation and therefore give rise to a classical “correlation hole”. Moreover, the ionic system is finite (for simplicity we assume a spherical shape) with an edge. The softness of this edge, i.e., the distance over which the charge density decreases to zero, is the second spatial scale which influences the ionic correlations in the continuum. In fact, we will show that the ion dynamics exhibits a crossover, characterized by the ratio , from a dominant influence of the correlation hole if (hard edge) to the dominant influence of the edge for (soft edge).
Surprisingly, this crossover can be probed by simply varying the pulse length of the ionizing light pulse in the correct parameter regime: A long pulse (for reasonable target systems this would be of the order of a few hundred femtoseconds) will slowly ionize the cluster and give the ions created near the surface time to move outward. Thereby, a soft edge in terms of decreasing density of ions is created. On the other hand, a short violent pulse (of a few femtoseconds only) will start the motion of all ions created at once leading to correlation-hole dominated dynamics.
We set the stage by defining the mean-field reference system, a homogeneously charged sphere of charge and mass . It undergoes Coulomb explosion, doubling its initial radius in time
| (1) |
Making use of Gauss’ law and the fact that shells of charge in a homogeneously charged sphere do not overtake each other, one can directly map the initial potential energy due to the enclosed charge at a radius to the final kinetic energy per unit charge . Evaluating the standard expression for the energy distribution
| (2) |
yields niam+01 ; kadu+03 ; issa+06
| (3c) | ||||
| (3d) | ||||
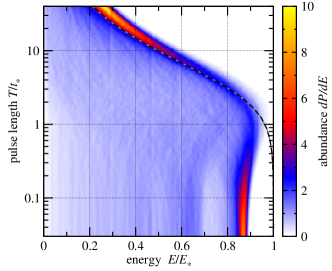
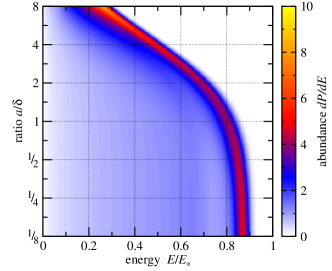
In terms of these scales for energy and time , we show in Fig. 1 kinetic-energy spectra of Lennard-Jones (LJ) clusters 222LJ clusters imply that the ground state configuration of those clusters is obtained by minimizing the LJ interaction between the atoms. with 1000 particles for various effective pulse duration . Hereby, effective pulse duration refers to the time in which the particles get charged. We select randomly a charging time for each particle in such a way that the ensemble averaged charge grows as which, e. g., corresponds to ionization of atoms in a cluster by single-photon ionization, as it would occur for a sample exposed to intense free-electron laser radiation in a Gaussian pulse gnsa+11 .
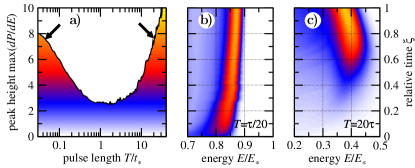
One clearly sees in Fig. 1 a cross-over behavior with two “hot spots” at short and long pulses (cf. also Fig. 2a which shows the height of the ridge as a function of pulse length ), always close to the maximal energy possible at a given pulse length . The long-pulse regime is compatible with a mean-field dominated dynamics and has been described previously: This mean-field peak in the kinetic-energy spectrum was observed for spherical objects with a washed-out edge, i. e., a non-uniform radial density distribution. It allows faster inner regions of exploding charge density to overtake slower outer ones, leading to radial caustics, as revealed by means of a kinetic model koby05byko05 . Under suitable conditions this caustic can even lead to a shock shell kadu+03 . Pre-exploding the sample pefo+05 softens the edge of the system to a gradually decreasing density, which is indeed close to the situation for long pulses shown in Fig. 1. Charging at low densities as effected by a long laser pulse reduces the energy deposition in the sample and leads to a global decrease of kinetic energies for long pulses, also visible in the spectrum for a homogeneously charged sphere (dashed line in Fig. 1).

What has not been seen before is the sharp maximum for short pulses whose origin is fundamentally different from the mean-field peak at long pulses. We will refer to this maximum as the granularity peak since its origin is the granularity of the system in connection with the fact that it is finite and has an edge. Indeed both features, the mean-field and the granularity peak are surface phenomena. This fact can be easily read off from Fig. 1, since for the respective pulse length the peaks are located near the maximal energy contributed by surface ions. This is further confirmed by comparing the mean-field spectra according to Eq. (3) and the numerical ones from individual ions 333The ions have been placed radially on equal-volume shells guaranteeing that the resulting granular density approximates the homogeneous density as close as possible. The angular positions of the ions are relaxed to minimize their interaction energy given by mutual LJ potentials. in Fig. 3a-c. Formally, these spectra correspond to cuts at in Fig. 1, but for different cluster sizes, namely 100, 1000 and 10000 atoms, respectively. One sees, that the spectrum deviates less from the mean-field prediction for larger cluster size and correspondingly smaller surface-to-volume ratio, nevertheless the granularity peak remains clearly visible.
That mean-field and granularity peak are of different origin can be seen, e.g., from the formation of the maxima in time: The mean-field peak builds up gradually in time and appears towards the end of the explosion (Fig. 2c) since the inner density needs time to overtake the outer one. The granularity peak in case of a short pulse, on the other hand, appears right from the beginning (Fig. 2b) suggesting that it can be understood from the forces acting initially on the individual ions. This is indeed the case as we will see.
Due to the repulsive interaction potential of the atoms in the cluster, nearby particles are very unlikely in the ground state. Hence, a correlation hole around an atom or ion exists. This means if there is an atom at position the probability to find another atom at position within the radius of the correlation hole, i. e., for , vanishes leading to the characteristic pair-correlation function as shown in Fig. 3d. It has been numerically obtained by an ensemble average over
| (4) |
with the distance between the particles and and the distribution of distances in a sphere with radius ga05 . The normalization with is necessary in order to remove the trivial dependence on due to the finite size of the system.
We can assess how the correlation hole affects the force acting on an ion at position analytically. To this end we determine the Coulomb repulsion of the ion from an infinitesimally thin spherical shell of radius and charge by integrating over all angles
| (5) |
with a vector on the shell. The radial component of this force can be determined without loss of generality by choosing along the -axis. Integratig over and using it reads
| (6a) | ||||
| (6b) | ||||
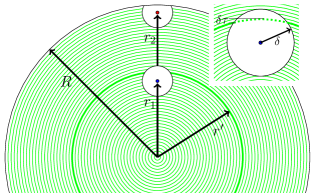
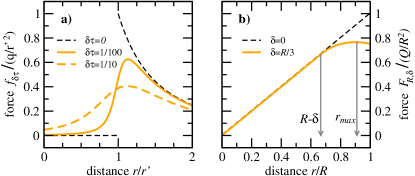
Hereby, the integration was restricted to the upper limit in order to account for a correlation hole, cf. the sketch in Fig. 4 and its inset, which shows explicitly. Equation (5) corresponds to . In this case, performing the integration over yields — as expected — Gauss’ law, i. e. for and for . As can be seen in Fig. 4a, for finite the force is inside the shell with radius and outside this shell. Yet, this modification of the forces does not play a role as long as the test particle’s correlation hole is in the bulk (, see test particle at in Fig. 4) since reduced repulsion from inner charged shells with is fully compensated by a finite repulsion from outer shells with in accordance with Gauss’ law for spherical charge distributions and a test particle with its correlation sphere completely inside the charge distribution. A reduced force is expected at the surface (see test particle at in Fig. 4). Both expectations are confirmed by the cumulative force, i. e., the integration over all charged shells, shown in Fig. 4b. For this integration we use , which guarantees that the “open” shells (see thick green/gray line in the sketch of Fig. 4) form a spherical correlation hole with radius for . For all other shells it is . This inserted into Eq. (6) and integrated over all shells yields an explicit expression for the force in the presence of a correlation hole
| (7a) | ||||
| (7b) | ||||
| with the dimensionless attenuation factor | ||||
| (7c) | ||||
Indeed, the force from Eq. (7) increases linearly, characteristic for a homogeneously charged sphere and without any effect of the correlation hole until the latter touches the surface from the inside (for the case shown in Fig. 4b at ). When this happens the force grows more slowly than in the homogeneous case and even decreases still within the charged sphere reaching a maximal value at (for ).
With the initial forces sculpturing the properties of the final ion-energy spectrum, we may even attempt to calculate this spectrum according to Eq. (2). We assume a self-similar expansion, i. e. scaling of all lengths in the system with the common factor . Consequently, the force (7) inherits the property from the Coulomb force. Thus, the final kinetic energy depends on the initial position similarly as in the case of a homogenous charge density through an integral along the similarity path with increment
| (8) |
In all (numerical and analytical) spectra presented we take into account a finite energy resolution . For Eq. (2) this means to replace with . In Fig. 3b one sees the spectrum for clusters with 1000 atoms in comparison to the one obtained with the mean-field approach including the correlation hole as just described. The deviations of both the numerical result (orange/gray-shaded area) and the correlation-hole result (solid line) with respect to the simple mean-field result (dashed line) from Eq. (3) at energies clearly reveals the importance of the correlation hole.
However, given the analytically calculated force of Eq. (7b) we also know that in order for the correlation hole to have an effect, the ion density must have a sharp edge, essentially fall to zero within the radius of the correlation hole. Otherwise the forces of each shell in the presence of the correlation hole will compensate each other, see Fig. 4a. On the other hand, a soft edge gives rise to the mean-field peak through catching up of faster inner ions with the slower outer ones, as described in the introduction. We may quantitatively describe the edge by a Fermi distribution with the softness parameter and the ion density at which is determined through the integral . In Fig. 5 the energy spectrum of ions initially distributed according to a Fermi distribution is shown for various values of measured in terms of the correlation hole radius . One can see the cross over from the granularity to the mean-field peak near .
We have seen that these two features are of very different origin although both of them are surface effects and occur therefore on the rim of maximal energy in the spectra of Fig. 5. It should be possible in an experiment to reveal both phenomena and their cross over by simply varying the pulse length of the ionizing light pulse as demonstrated in Fig. 1. A time-delayed probe pulse could reveal in addition the different temporal behavior of both peaks illustrated in Fig. 2.
In the examples discussed here, the granularity of the system was quantified by the correlation hole which is the most common case for ground state matter. However, a little thought reveals, that ions (or electrons) randomly distributed over a finite volume, give rise to a granularity peak as well. It is much weaker and broader 444U. Saalmann, A. Mikaberidze and J. M. Rost, unpublished but still has the same reason: Forces on an ion from other ions inside and outside a virtual shell do not compensate each other near the edge of the sample where the radius of the shell is defined by the distance of the ion to the charge center of the sample.
Acknowledgement — We gratefully acknowledge support from CORINF, a Marie Curie ITN of the European Union, Grant Agreement No. 264951.
References
- (1) P. Fulde, Electron Correlations in Molecules and Solids (Springer, Heidelberg, 1995).
- (2) B. W. J. McNeil and N. R. Thompson, Nat. Photon. 4, 814 (2010).
- (3) C. Gnodtke, U. Saalmann, and J. M. Rost, Phys. Rev. Lett. 108, 175003 (2012).
- (4) K. Nishihara, H. Amitani, M. Murakami, S. V. Bulanov, and T. Z. Esirkepov, Nucl. Inst. Meth. Phys. Res. A 464, 98 (2001).
- (5) A. E. Kaplan, B. Y. Dubetsky, and P. L. Shkolnikov, Phys. Rev. Lett. 91, 143401 (2003).
- (6) Md. R. Islam, U. Saalmann, and J. M. Rost, Phys. Rev. A 73, 041201 (R) (2006).
- (7) C. Gnodtke, U. Saalmann, and J. M. Rost, New J. Phys. 13, 013028 (2011).
- (8) V. F. Kovalev and V. Y. Bychenkov, JETP 101, 212 (2005), V. Y. Bychenkov and V. F. Kovalev, Plas. Phys. Rep. 31, 178 (2005).
- (9) F. Peano, R. A. Fonseca, and L. O. Silva, Phys. Rev. Lett. 94, 033401 (2005).
- (10) R. García-Pelayo, J. Phys. A 38, 3475 (2005).