On Measuring the CMB Temperature at Redshift 0.89
Abstract
We report on a measurement of the temperature of the cosmic microwave background radiation field, , at by imaging HC3N() and () absorption in the foreground galaxy of the gravitationally lens magnified radio source PKS 1830211 using the Very Long Baseline Array and the phased Very Large Array. Low-resolution imaging of the data yields a value of K, for the rotational temperature, , which is consistent with the temperature of the cosmic microwave background at the absorber’s redshift of K. However, our high-resolution imaging reveals that the absorption peak position of the foreground gas is offset from the continuum peak position of the synchrotron radiation from PKS 1830211 SW, which indicates that the absorbing cloud is covering only part of the emission from PKS 1830211, rather than the entire core-jet region. This changes the line-to-continuum ratios, and we find between 1.1 and 2.5 K, which is lower than the expected value. This shows that previous, , measurements could be biased due to unresolved structure.
cosmic background radiation — cosmology: observations — galaxies: ISM – quasars: absorption lines — quasars: individual (PKS 1830211)
1 INTRODUCTION
PKS 1830211 is a well-studied high-redshift blazar (; Lidman et al. 1999), which is gravitationally lensed by a foreground face-on spiral galaxy revealed by Hubble Space Telescope imaging (Wiklind & Combes, 1998; Courbin et al., 2002; Winn et al., 2002) at (Wiklind & Combes, 1996). The radio core of PKS 1830211 is lensed into two components: the southwest (SW) and northeast (NE) images (Pramesh Rao & Subrahmanyan, 1988; Subrahmanyan et al., 1990) with a separation of 0971 (Jin et al., 2003) or 7.7 kpc at (assuming a flat universe with the cosmological parameters km s-1 Mpc-1, and ). The two bright core images are connected by a ring-like structure of low surface brightness that is often referred to as an Einstein ring (Jauncey et al., 1991), whose center is near the nucleus of the lensing galaxy (Kochanek & Narayan 1992; Nair, Narasimha, & Rao 1993; see Courbin et al. 2002 for a historic summary). The SW and NE lensed images of PKS 1830211 lie on both sides of the bulge of the lensing galaxy, with projected distances of kpc (040) and kpc (059) from the nucleus, respectively (Winn et al., 2002; Menten et al., 2008).
Radiation from the SW lensed component of PKS 1830211 is strongly affected by the intervening gas in the foreground galaxy that causes reddening and strong absorption features detected for a large number of different molecular species (Wiklind & Combes, 1996, 1998; Frye, Welch, & Broadhurst, 1997; Carilli et al., 1998; Menten, Carilli, & Reid, 1999; Swift, Welch, & Frye, 2001; Menten et al., 2008; Henkel et al., 2008, 2009; Muller et al., 2011). Although the disk of the galaxy is seen nearly face-on (inclination ; e.g., Wiklind & Combes 1998), the velocity width of the absorption toward the SW image reaches km s-1 FWZP (Muller & Guélin, 2008), which is significantly larger than that of most giant molecular clouds (GMC) of the Milky Way and better resembles Galactic Center clouds (Menten, Carilli, & Reid, 1999; Muller & Guélin, 2008). Toward the NE lensed image, weaker and narrower ( km s-1 FWHM) absorption components have been detected at a velocity shifted by km s-1 relative to the absorption toward the SW image (Wiklind & Combes, 1998; Muller et al., 2006). The characteristics of the absorption in front of the NE image are similar to those of the Galactic diffuse clouds (Muller & Guélin, 2008).
High-redshift molecular absorption provides an important means to understand the physical conditions in the molecular interstellar medium in a galaxy at a cosmologically significant redshift. Of particular interest is an accurate measurement of the temperature of the cosmic microwave background (CMB) radiation (), one of the fundamental cosmological parameters, and its variation with redshift (e.g., Noterdaeme et al. 2011). The standard cosmological model predicts, for an adiabatic expansion of the Universe, , where K (Mather et al., 1994, 1999; Fixsen et al., 1996). This important relation predicted by the theory needs to be confirmed by direct observations. This can be achieved by measuring the excitation temperature () of interstellar atomic or molecular species at high redshift, in particular the rotational excitation temperature () of molecular transitions. In diffuse interstellar gas, where collisional excitation is negligible, rotational transitions can be in radiative equilibrium with the CMB (i.e., ). The rotational temperature of the gas can be calculated by observing two transitions of a given molecule, and therefore at the redshift of the gas can be obtained. For PKS 1830211, this was done by Wiklind & Combes (1996), who determined an upper limit of K. They found that only 36% of the background continuum was covered by the foreground absorbing gas, implying observations with higher angular resolution were needed to achieve a reliable value for . A few years later, Combes & Wiklind (1999) observed a larger sample of molecular transition lines, resulting in several measurements of below the predicted value. Subsequently, Henkel et al. (2009) performed similar observations with the 100-m Effelsberg radio telescope, deriving the covering factor and optical depth from advanced models fitted to the data. Their analysis was largely consistent with a value of 5.14 K, although individual models could show large offsets. Finally, Muller et al. (2011) performed this analysis with the Australia Telescope Compact Array, providing a higher resolution. Their findings were mostly consistent with = 5.14 K, although some transitions showed significantly lower values than the theoretical prediction. Even higher resolution observations are needed to derive a precise measurement.
In this paper, we report on a measurement of the temperature of the microwave background radiation field at by VLBI imaging of two microwave transitions of HC3N. The observations and data reduction are described in Section 2. Our measurement of is presented in Section 3, using both low- and high-resolution imaging (Sections 3.1 and 3.2, respectively), followed by a discussion of possible biases in Section 4. Finally, our conclusions are summarized in Section 5.
2 OBSERVATIONS AND DATA ANALYSIS
2.1 Observations
We observed the redshifted HC3N() and HC3N() absorption lines at 14.5 GHz and 24.1 GHz, respectively, toward PKS 1830211 using the National Radio Astronomy Observatory’s444The National Radio Astronomy Observatory is a facility of the National Science Foundation operated under cooperative agreement by Associated Universities, Inc. Very Long Baseline Array (VLBA) combined with the phased Very Large Array (VLA) as a VLBA antenna on 1999 January 29 (program BC087B). We employed two frequency bands of 8 MHz bandwidth each, in both right- and left-circular polarizations. The center frequencies of the two bands were set to cover both velocities of the NE and SW components (with km s-1 difference; Wiklind & Combes 1998): respectively, 14.46272 GHz and 14.47419 GHz for the transition and 24.10444 GHz and 24.12356 GHz for the transition.
We used seven observing blocks of 1 hour duration each. Subsequent observing blocks were undertaken at alternating frequencies of 14.5 GHz and 24.1 GHz (in total, four observing blocks at 14.5 GHz and three at 24.1 GHz). Each 1 hour block consisted of five repetitions of 12-minute groups, each consisting of a 3-minute scan toward the quasar J17331304 as passband calibrator and a 9-minute scan toward the target source PKS 1830211.
The data correlation was performed at the VLBA correlation facility in Socorro, NM. The data from each antenna pair were cross-correlated with an integration time of 2 seconds. Each 8 MHz band was split into 128 spectral channels, yielding a channel separation of 62.5 kHz. The corresponding velocity resolutions (with the relativistic Doppler effect) are 0.887 km s-1 and 0.532 km s-1 for the and transitions, respectively, for rest frequencies of 27294.289 MHz and 45490.3138 MHz (Müller et al., 2001, 2005). The data correlation process was repeated, adopting two different positions for the correlation center of PKS 1830211, i.e., the positions of the SW and NE images. In J2000 coordinates, the pointing position for the observation was , and the adopted correlation positions were for the SW position and for the NE position.
2.2 Calibration
The correlated data were calibrated using the NRAO Astronomical Image Processing System (AIPS; Greisen 2003). We did not detect absorption toward the NE component. Therefore, we analyzed only the data set with the correlation center at the SW component position and only the 8MHz bands that covered the absorption spectrum in each of the 14.5 GHz and 24.1 GHz bands.
We first corrected the interferometer delays and phases for the effects of diurnal feed rotation (parallactic angle). We also removed the off-source VLA station data by flagging the first minute of each scan. The amplitudes of the interferometric data were corrected for the small biases ( a few percent) of the data sampling thresholds among different stations, and then converted from correlation coefficients to flux density units using the system temperature and antenna gain curve information.
We removed instrumental delay and phase offsets by fitting fringe patterns to the data of the calibrator J17331304 and corrected the data for these offsets. Bandpass amplitude and phase corrections were also determined from J17331304 and applied to PKS 1830211. We then performed phase calibration by fitting fringe patterns to the data of PKS 1830211 on time scales of 20 seconds, using a model based on the image of PKS 1830211 from a trial fringe fit.
A continuum spectral baseline for PKS 1830211 was fitted based on channels 10 to 25 and 105 to 120 and subtracted from the visibility data, yielding a continuum-only data set and a baseline-subtracted “line” data set. The phase of the continuum data set was further calibrated using an iterative self-calibration process. During the self-calibration process, we simultaneously CLEANed the SW and NE continuum components. The NE component had a positional offset of relative to the SW component and was still in the field of view of the data correlated at the SW position. The interferometer gain corrections from self-calibration were then applied to the baseline-subtracted “line” data set of PKS 1830211.
Before the spectrum fitting, we converted the frequency of the observed spectra into the velocity units by using the relativistic Doppler effect, , where is the speed of light and the rest frequency of the transition. We subtracted the expected velocity of 168198.25 km s-1 for the redshift of , which defines the zero velocity of the obtained spectra.
2.3 Rotational Temperature
From the measured absorption amplitude (defined to be negative for absorption) and continuum levels of the two transitions, HC3N() and HC3N(), the optical depth of each transition is determined by
| (1) |
where is the covering factor of the background continuum source by the absorbing cloud (). If we assume the two transitions are caused by the same absorbing cloud, we can use these values in the following equation to determine the rotational temperature of the absorbing gas:
| (2) |
where is the energy difference between the and levels, the Boltzmann’s constant ( K; Müller et al. 2001, 2005), the statistical weight of the rotational level , and and are the rest frequency and optical depth (at the line center velocity ), respectively, of the rotational absorption . We assume equal excitation temperature for the two transitions and (i.e., local thermodynamical equilibrium) and also assume since collisional excitation is negligible for the diffuse interstellar gas. We solved Equation 2 for numerically through iteration. The equations used to derive Equation 2 are documented in the Appendix.
3 RESULTS
3.1 Low Resolution Analysis
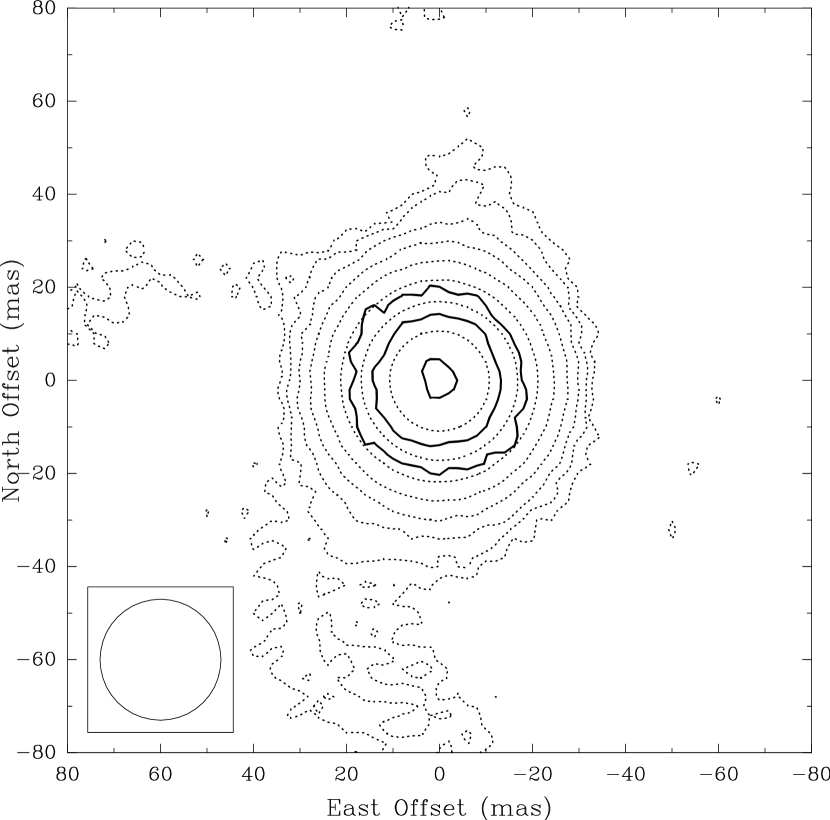
We first imaged the continuum and line absorption with low spatial resolution in order to simulate the results from previous studies. We made image cubes at both 14.5 GHz and 24.1 GHz with a circular restoring beam of 26 mas (FWHM); at this resolution, the continuum emission is essentially unresolved. Figure 1 displays these low resolution images; the absorption distributions were obtained by plotting absorption depth, , at each pixel of the image. We performed Gaussian fits to the observed spectra of the baseline-subtracted “line” image cubes and measured the absorption amplitudes of the HC3N() and HC3N() transitions at each pixel of the image.
We first solved for the three parameters, the amplitude, , the line width (FWHM), , and the central line velocity, , of the absorption at the peak pixel of both continuum and absorption at the center of the map. We measured km s-1 and km s-1 for the line and km s-1 and km s-1 for the line. Averaging the results of the two frequency bands, we obtained the mean line velocity, km s-1, and the mean line width, km s-1. We then repeated fitting at each pixel of the image with the line width and velocity fixed at the mean values, and , solving for the absorption amplitude, , only. Table 1 lists the measured values at the continuum peak pixel (in the map center) at each frequency, and the measurement assuming identical covering factors, , for the two transitions. If we assume , we measure K, and varying gives similar results. This result is consistent with the predicted value of K and with previous measurements by Wiklind & Combes (1996, K), Carilli et al. (1998, K), Henkel et al. (2009) and Muller et al. (2011). However, as shown in Section 4, if the absorption does not completely cover the continuum source, insufficient spatial resolution can yield biased rotational temperatures.
3.2 High Resolution Analysis
3.2.1 Imaging
Next, we made images with the higher angular resolution afforded by our long interferometer baselines. From the line data, we made an image cube in each frequency channel with pixels of 0.05 mas (i.e., for a field of view of 6.4 mas 6.4 mas). We adopted identical circular restoring beams of 0.65 mas width (FWHM) for the 14.5 GHz and 24.1 GHz bands. (The dirty beam size was 1.45 mas 0.46 mas with a position angle of at 14.5 GHz and 1.27 mas 0.31 mas with a position angle of at 24.1 GHz.)
The line data were self-calibrated with the continuum at each frequency, and therefore the line and continuum maps are accurately aligned with a precision that is only limited by the uncertainty in the baseline calibration and by the thermal noise in the line image (due to the lower signal-to-noise ratio for absorption). The bandpass phases are calibrated to better than 10 degrees, which translates to a positional accuracy of of the fringe spacing, i.e., mas for a mas fringe spacing. The positional uncertainty introduced by the thermal noise in the line image can be estimated as half of the beam size divided by the signal-to-noise ratio (SNR) of the image. With mas and SNR for absorption maps, this results in an accuracy of 0.05 mas. For this case, relative positions measured in the line and continuum maps are accurate to better than 0.06 mas.
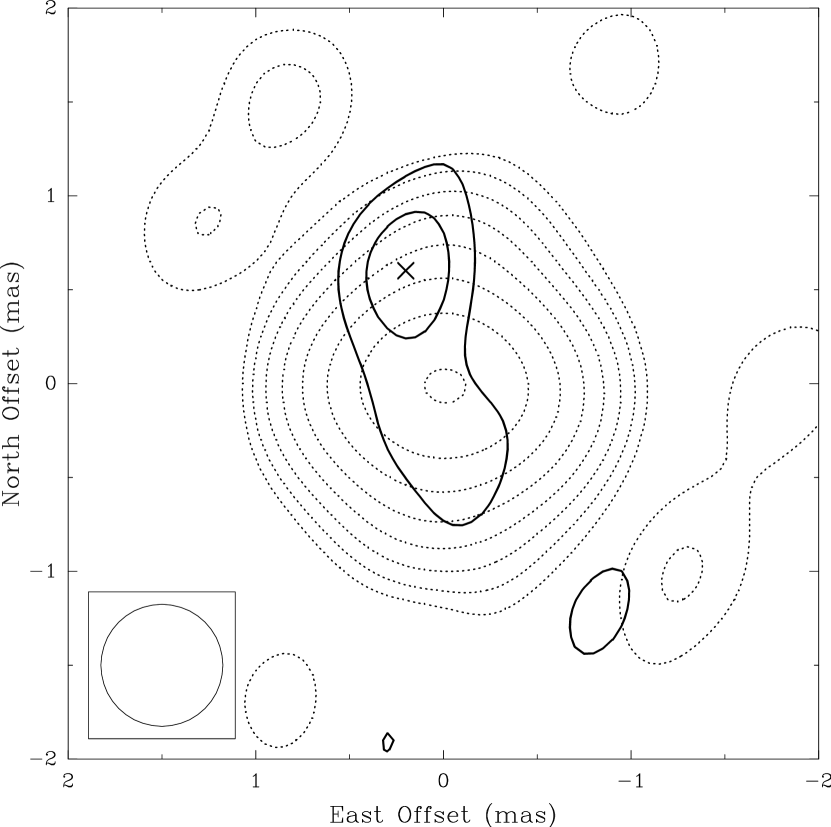
Figure 2 shows the high resolution maps of the continuum emission of PKS 1830211 and the absorption in the foreground gas at . The continuum maps were obtained by imaging the continuum-only data set. The absorption distribution in each frequency map was obtained by plotting absorption depth measured at each pixel of the image (Section 3.2.2). Notably, we find that the absorption peak position in each frequency band, in particular at 14.5 GHz, is offset from the continuum peak position. The offsets are significantly larger than the uncertainty in the alignment between the line and continuum maps. In the map of the transition observed at 14.5 GHz, the absorption peak lies at a positional offset of mas from the continuum peak, measured through fitting in the deepest absorption channel. For the transition observed at 24.1 GHz, the measured offset is mas from the continuum peak to the absorption peak, fitted over the averaged map of the 10 channels ( km s-1 width) in which the absorption was most prominent. The presence of these offsets is a cause for concern that the rotational temperature, , measured with lower angular resolution may be systematically biased (see Section 4).
3.2.2 Spectral fitting
Since the data of PKS 1830211 were self-calibrated, the absolute positions of both 14.5 GHz and 24.1 GHz maps are unknown, and hence we need to consider the proper alignment of the two frequency maps before we measure . Were the continuum emission point-like, or were its distribution identical at the two frequencies, self-calibration would correctly align the two maps. However, the continuum image of PKS 1830211 has resolved structure and the relative registration of the maps at the different frequencies cannot be a priori determined. Based on VLBI images of other sources, it is likely that the continuum emission of PKS 1830211 is elongated due to a faint one-sided jet emanating from a self-absorbed core. Owing to optical depths varying with frequency for individual components, one expects a slight positional offset (along the jet axis) between the emission peaks at two frequencies. (Note that since absorption depths are small compared to the continuum levels, the brightness peak positions of the continuum maps are not significantly affected by absorption.)
We measured the absorption amplitude at different positions across the images, allowing evaluation of different alignments between the two images. This was done in the following three steps using least-squares fitting of Gaussian profiles to the spectra, in the same manner as for the low resolution images. Firstly, we placed the measurement position for each frequency map at its absorption peak, and solved for the following three parameters: the amplitude the line width (FWHM) and the central line velocity of the absorption. We defined as , where is the observed spectrum and is the continuum level (i.e., for absorption). We then averaged the results of the two frequency bands to determine the mean line width and the mean velocity . We obtained km s-1 and km s-1 by averaging km s-1 and km s-1 for the line and km s-1 and km s-1 for the line. Secondly, we repeated the fit at the same positions, but fixed the line width and velocity at the mean values, and , solving for the absorption amplitude only. Figure 3 shows the result of this spectral fit. The obtained values are mJy/beam for the line and mJy/beam for the line. Finally, using the same values of and , we measured the absorption amplitude of all individual spectra at each pixel position across the two images. The measured is plotted as absorption distributions in Figure 2.
Previous VLBI observations of PKS 1830211 at 15 GHz and 43 GHz (Garrett et al., 1997, 1998; Jin et al., 2003) show complicated structure of both the SW and the NE images of the radio core with extended jet components on a sub-milliarcsecond scale. In particular, multi-epoch 43 GHz maps by Garrett et al. (1997) have revealed that the core has remarkably complex substructure that changes rapidly with a timescale of weeks. The complex morphology of the core substructure makes it ambiguous to determine the jet direction. We therefore determined the jet axis based on our continuum maps to lie along the offset between the absorption and continuum peaks, and we shifted the position of the measurement along this axis to allow for the possibility of misalignment of the two maps.
3.2.3 measurement
For a given alignment of the two images, can be measured at any pixel position, provided that both absorption and background continuum emission have sufficient signal-to-noise ratios. However, since the detected absorption was weak for the line, we fixed the position for measuring its optical depth, , at its absorption peak position in the 14.5 GHz map, maximizing the signal-to-noise ratio of the measurement. We shifted the measurement point of along the line shown as a dash-dotted line in Figure 2. Both continuum and absorption levels were measured at a single pixel, and we performed measurements using three different covering factors (), assumed to be identical for the two transitions.
Of course only a very limited range of shifts make physical sense, and we required the continuum emission to reflect realistic synchrotron spectral indices for all pixels with firm detections. Our selection criteria required spectral indices, (defined by the power-law spectrum ), which yielded four possible alignments shown by crosses in the 24.1 GHz map in Figure 2. Table 2 lists the measured values from these measurement points (as well as from excluded measurement positions with spectral indices outside of ). These alignments yield between 1.1 and 2.5 K, which is significantly lower than the theoretically-predicted value for the cosmic microwave background, K at . (The three excluded measurement positions in Table 2 near the map center, i.e., mas, yield spectral indices, , between 2.5 and 2.8, and values between 1.1 and 1.6 K.) We note, as Henkel et al. (2009) pointed out, that due to the small rotational constant of HC3N, the measured excitation temperature may be susceptible to additional contributions from collisional excitation from (even moderate densities of) H2 gas or local radiative excitation. While this could explain a higher value of (as in Henkel et al. 2009), it cannot explain why our measurement is lower than the radiation temperature. We discuss the dominant biases in the present result in Section 4. By exploiting measurements using Equation 2, we assume that the physical properties of the gas is the same for the two transitions (i.e., the both absorption lines come from the same absorbing cloud). We will also discuss this assumption in Section 4.
4 BIAS OF TEMPERATURE MEASUREMENT
Our high-resolution measurement yields between 1.1 and 2.5 K, which is significantly lower than the expected value of K at . In this section, we discuss several possible explanations for this discrepancy.
4.1 Contribution from non-absorbed continuum emission
Our VLBI maps of PKS 1830211 have revealed that the absorption peak positions of the HC3N() and HC3N() lines are offset from the continuum peak of the SW core. Because these two lines were observed contemporaneously, temporal variations can be excluded, and these offsets indicate that the absorbing cloud of the foreground galaxy is covering the core-jet emission from PKS 1830211 only partially, and not entirely.
The synchrotron radiation from the extended components of AGNs such as jets is optically thin at cm wavelengths, with a spectral index to (defined as ), whereas the compact core is generally optically thick and synchrotron self-absorption at low frequencies inverts the spectrum toward (e.g., Schneider 2006; Rybicki & Lightman 1979). Since the core is very compact and unresolved on milliarcsecond scales, our continuum measurements likely include a blend of jet and core emission.
Blending non-absorbed continuum emission with within the beam causes the ratio of the optical depths
to decrease from the true value, because the continuum level relative to () is increased (due to ), while the absorption terms remain unchanged. This biases the value of given by Equation 2 to be lower than the true value as we observe.
In case of our low-resolution measurement (Section 3.1), we are likely more sensitive to extended, low surface brightness emission that could have a significant contribution of jet emission that is also not absorbed, resulting in our measured spectral index of (Table 1). The addition of non-absorbed continuum emission from extended components with can falsely increase the measured . Of course, the rough match between the measured and expected values would then have to be coincidental.
4.2 Different absorbing gas
In our measurements, we assumed identical physical conditions for the gas giving rise to the two transitions. Our high resolution maps (Figure 2) show that the absorption peak of the line is located more closely to the continuum peak than the absorption peak (Section 3.2.1), and also the width of the absorption line in Figure 3 is narrower for the transition than for the transition, which could be interpreted as the two absorption lines originating in different gas clouds. If this were the case, no relation between the optical depths of the two absorption lines could be assumed, and therefore any value for could have resulted from the measurement. Theoretically, it is possible to detect only absorption from a given cloud where the line is very weak at low temperature, but when the line is detected, the line must also be detected except under highly unusual circumstances. Therefore, it is very unlikely that we see two different absorbing clouds.
4.3 Core-shift of PKS 1830211 and misalignment at two frequencies
The observed difference in offset between continuum and absorption peaks at the two frequencies could also be caused by different apparent positions of the core at the two frequencies, rather than differences in the foreground gas. The radio core positions of AGNs are known to shift with frequency due to frequency-dependent optical depths of the jets (Blandford & Königl, 1979). Such a core-shift effect has been observed, for example, recently by Hada et al. (2011) in M87, but with only 0.1 mas shift between frequencies of 15.4 and 23.8 GHz, comparable to our observing frequencies. This is well within our resolution, and considering the larger distance to PKS 1830211, this effect should be negligible in our data.
5 CONCLUSIONS
Our VLBI observations of PKS 1830211 SW have identified offsets between the absorption (HC3N and lines) and continuum peaks (all observed contemporaneously). These offsets indicate that absorption in the foreground galaxy covers the core-jet emission from PKS 1830211 only partially. We have shown that insufficient spatial resolution can cause unresolved, non-absorbed continuum emission to contaminate measurements, and that all previous measurements could be affected by this bias (although measurements at millimeter wavelengths may be less affected by this bias because the jet component becomes less pronounced). Our high-resolution measurement yields between 1.1 and 2.5 K, which is significantly lower than the expected value of K from the cosmic microwave background at . The true rotational temperature of the absorbing gas is likely higher than this measured value, because of blended-in core-jet components with spectral index , which biases the measurement toward a lower temperature. Our result reinforces the importance of high-resolution observations of PKS 1830211 to map the absorbing regions in detail, in order to reliably measure the rotational temperature and the cosmic microwave background. More observations with higher sensitivity to measure absorption depths as well as an absolute-position measurement for correct map alignment will further improve the accuracy of the measurement.
APPENDIX
Our VLBA observations of the southwest (SW) core of PKS 1830211 were used to estimate the rotational temperature of the foreground gas at by measuring absorption depths of HC3N in the and lines. In this section, we derive Equation 2 that was used to measure the rotational temperature of the gas from the observed absorption depths.
The ratio of the volume densities of HC3N molecules in the lower states of the two transitions are given by:
where are the statistical weights of the levels, is the Boltzmann’s constant, and is the energy difference between the and levels ( K; Müller et al. 2001, 2005). Solving the above equation for the rotational temperature yields:
We now evaluate the density ratio in terms of the observed optical depths and of the and lines, respectively. For each transition, the optical depth is given by:
where is the absorption coefficient, assumed uniform, and is the total path length through the absorbing cloud. The absorption coefficient for a transition from the upper level to the lower level is given by:
where is the speed of light, is the transition frequency, is the Einstein coefficient of spontaneous emission, is the Planck’s constant, is the excitation temperature, and is the normalized line profile, which can be represented for any transition as:
where is the frequency half-width at e-0.5 of the peak and is the line center frequency. This can be rewritten in terms of Doppler velocity as:
where is the velocity half-width at e-0.5 of the peak, which is related to the full-width at half-maximum (FWHM) by , and is the line center velocity. Assuming the line profiles of the two transitions are identical in Doppler velocity (i.e., ), then at line center ( and ), the ratio of the line profiles is given by the reciprocal ratio of the rest frequencies:
Therefore, taking the ratio of the optical depths and at line center and assuming equal path lengths and excitation temperatures for the two transitions yields the following relation:
Solving this equation for the density ratio term needed to estimate a rotational temperature, we obtain:
For absorption transitions, the Einstein A coefficients are given by:
where is the permanent electric dipole moment of the molecule, and thus, the ratio of the Einstein A coefficients (for and ) are given by:
Therefore, we obtain the desired rotational temperature in terms of observed absorption optical depths of the HC3N and lines as:
References
- Blandford & Königl (1979) Blandford, R. D., & Königl, A. 1979, ApJ, 232, 34
- Carilli et al. (1998) Carilli, C. L., Menten, K. M., Reid, M. J., Rupen, M., & Claussen, M. 1998, in ASP Conf. Ser. 144, Radio Emission from Galactic and Extragalactic Compact Sources, ed. J. A. Zensus, G. B. Taylor, & J. M. Wrobel (San Francisco: ASP), 317
- Combes & Wiklind (1999) Combes, F., & Wiklind, T. 1999, in ASP Conf. Ser. 156, Highly Redshifted Radio Lines, ed. C. L. Carilli, S. J. E. Radford, K. M. Menten, & G. I. Langston (San Francisco, CA: ASP), 210
- Courbin et al. (2002) Courbin, F., Meylan, G., Kneib, J.-P., & Lidman, C. 2002, ApJ, 575, 95
- Fixsen et al. (1996) Fixsen, D. J., Cheng, E. S., Gales, J. M., Mather, J. C., Shafer, R. A., & Wright, E. L. 1996, ApJ, 473, 576
- Frye, Welch, & Broadhurst (1997) Frye, B., Welch, W. J., & Broadhurst, T. 1997, ApJ, 478, L25
- Garrett et al. (1997) Garrett, M. A., Nair, S., Porcas, R. W., & Patnaik, A. R. 1997, Vistas Astron., 41, 281
- Garrett et al. (1998) Garrett, M. A., Leppänen, K., Porcas, R. W., Patnaik, A. R., Nair, S., & Teräsranta, H. 1998, in ASP Conf. Ser. 144, Radio Emission from Galactic and Extragalactic Compact Sources, ed. J. A. Zensus, G. B. Taylor, & J. M. Wrobel (San Francisco: ASP), 313
- Greisen (2003) Greisen, E. W. 2003, in Information Handling in Astronomy: Historical Vistas, ed. A. Heck (Dordrecht: Kluwer), 109
- Hada et al. (2011) Hada, K., Doi, A., Kino, M., Nagai, H., Hagiwara, Y., & Kawaguchi, N. 2011, Nature, 477, 185
- Henkel et al. (2008) Henkel, C., Braatz, J. A., Menten, K. M., & Ott, J. 2008, A&A, 485, 451
- Henkel et al. (2009) Henkel, C., Menten, K. M., Murphy, M. T., Jethava, N., Flambaum, V. V., Braatz, J. A., Muller, S., Ott, J., & Mao, R. Q. 2009, A&A, 500, 725
- Jauncey et al. (1991) Jauncey, D. L., et al. 1991, Nature, 352, 132
- Jin et al. (2003) Jin, C., Garrett, M. A., Nair, S., Porcas, R. W., Patnaik, A. R., & Nan, R. 2003, MNRAS, 340, 1309
- Kochanek & Narayan (1992) Kochanek, C. S., & Narayan, R. 1992, ApJ, 401, 461
- Lidman et al. (1999) Lidman, C., Courbin, F., Meylan, G., Broadhurst, T., Frye, B., & Welch, W. J. W. 1999, ApJ, 514, L57
- Mather et al. (1994) Mather, J. C., Cheng, E. S., Cottingham, D. A., et al. 1994, ApJ, 420, 439
- Mather et al. (1999) Mather, J. C., Fixsen, D. J., Shafer, R. A., Mosier, C., & Wilkinson, D. T. 1999, ApJ, 512, 511
- Menten, Carilli, & Reid (1999) Menten, K., Carilli, C., & Reid, M. 1999, in ASP Conf. Ser. 156, Highly Redshifted Radio Lines, ed. C. L. Carilli, S. J. E. Radford, K. M. Menten, & G. I. Langston (San Francisco: ASP), 218
- Menten et al. (2008) Menten, K. M., Güsten, R., Leurini, S., Thorwirth, S., Henkel, C., Klein, B., Carilli, C. L., & Reid, M. J. 2008, A&A, 492, 725
- Muller et al. (2011) Muller, S., Beelen, A., Guélin, M., Aalto, S., Black, J. H., Combes, F., Curran, S. J., Theule, P., & Longmore, S. N. 2011, A&A, 535, 103
- Muller & Guélin (2008) Muller, S., & Guélin, M. 2008, A&A, 491, 739
- Muller et al. (2006) Muller, S., Guélin, M., Dumke, M., Lucas, R., & Combes, F. 2006, A&A, 458, 417
- Müller et al. (2005) Müller, H. S. P., Schlöder, F., Stutzki, J., & Winnewisser, G. 2005, J. Mol. Struct., 742, 215
- Müller et al. (2001) Müller, H. S. P., Thorwirth, S., Roth, D. A., & Winnewisser, G. 2001, A&A, 370, L49
- Nair, Narasimha, & Rao (1993) Nair, S., Narasimha, D., & Rao, A. P. 1993, ApJ, 407, 46
- Noterdaeme et al. (2011) Noterdaeme, P., Petitjean, P., Srianand, R., Ledoux, C., & López, S. 2011, A&A, 526, L7
- Pramesh Rao & Subrahmanyan (1988) Pramesh Rao, A., & Subrahmanyan, R. 1988, MNRAS, 231, 229
- Rybicki & Lightman (1979) Rybicki, G. B., & Lightman, A. P. 1979, Radiative Processes in Astrophysics (New York: Wiley), 186
- Schneider (2006) Schneider, P., (ed.) 2006, Extragalactic Astronomy and Cosmology (Berlin: Springer), 178
- Subrahmanyan et al. (1990) Subrahmanyan, R., Narasimha, D., Pramesh Rao, A., & Swarup, G. 1990, MNRAS, 246, 263
- Swift, Welch, & Frye (2001) Swift, J. J., Welch, W. J., Frye, B. L. 2001, ApJ, 549, L29
- Wiklind & Combes (1996) Wiklind, T., & Combes, F. 1996, Nature, 379, 139
- Wiklind & Combes (1998) Wiklind, T., & Combes, F. 1998, ApJ, 500, 129
- Winn et al. (2002) Winn, J. N., Kochanek, C. S., McLeod, B. A., Falco, E. E., Impey, C. D., & Rix, H.-W. 2002, ApJ, 575, 103

| Transition | ||||||
|---|---|---|---|---|---|---|
| (Jy/beam) | (Jy/beam) | (K) | ||||
| 2.069 (0.005) | 0.048 (0.004) | — | 1.0 | 0.023 (0.002) | — | |
| 0.5 | 0.047 (0.005) | |||||
| 0.2 | 0.123 (0.012) | |||||
| 1.429 (0.005) | 0.049 (0.003) | 0.7 (0.6) | 1.0 | 0.035 (0.003) | 5.6 | |
| 0.5 | 0.070 (0.005) | 5.6 | ||||
| 0.2 | 0.186 (0.015) | 5.9 |
Note. — Measured values from Figure 1, at the continuum peak pixel in the map center. is the continuum level, is the absorption level, is the optical depth of each transition, and is the spectral index derived from the continuum levels at the two frequencies. The uncertainties are listed in parentheses. The uncertainty of the spectral index, 0.6, was derived assuming a systematic error of 20% in flux scale calibration at each frequency band. (Note the flux-scale error does not affect values.) The rotational temperature was measured from the two transitions, assuming identical covering factors .


| Transition | ||||||||
|---|---|---|---|---|---|---|---|---|
| (mas) | (mas) | (Jy/beam) | (Jy/beam) | (K) | ||||
| 0.30 | 0.60 | 0.229 | — | 1.0 | 0.13 (0.02) | — | ||
| 0.5 | 0.29 (0.05) | |||||||
| 0.2 | 1.01 (0.26) | |||||||
| 0.20 | 0.60 | 0.111 | 1.0 | 0.17 (0.04) | 4.3 | |||
| 0.5 | 0.38 (0.11) | 4.5 | ||||||
| 0.2 | 1.35 (0.53) | 6.0 | ||||||
| 0.15 | 0.45 | 0.274 | 0.4 | 1.0 | 0.10 (0.02) | 2.5 | ||
| 0.5 | 0.21 (0.04) | 2.5 | ||||||
| 0.2 | 0.67 (0.15) | 2.3 | ||||||
| 0.10 | 0.30 | 0.537 | 1.7 | 1.0 | 0.07 (0.01) | 1.9 | ||
| 0.5 | 0.14 (0.02) | 1.9 | ||||||
| 0.2 | 0.40 (0.06) | 1.7 | ||||||
| 0.05 | 0.15 | 0.816 | 2.5 | 1.0 | 0.05 (0.01) | 1.6 | ||
| 0.5 | 0.10 (0.01) | 1.5 | ||||||
| 0.2 | 0.28 (0.03) | 1.4 | ||||||
| 0.00 | 0.00 | 0.949 | 2.8 | 1.0 | 0.04 (0.01) | 1.4 | ||
| 0.5 | 0.08 (0.01) | 1.4 | ||||||
| 0.2 | 0.21 (0.03) | 1.2 | ||||||
| 0.839 | 2.5 | 1.0 | 0.03 (0.01) | 1.3 | ||||
| 0.5 | 0.06 (0.01) | 1.2 | ||||||
| 0.2 | 0.17 (0.03) | 1.1 | ||||||
| 0.563 | 1.8 | 1.0 | 0.03 (0.01) | 1.2 | ||||
| 0.5 | 0.06 (0.02) | 1.2 | ||||||
| 0.2 | 0.15 (0.04) | 1.1 | ||||||
| 0.289 | 0.5 | 1.0 | 0.04 (0.01) | 1.4 | ||||
| 0.5 | 0.08 (0.03) | 1.4 | ||||||
| 0.2 | 0.21 (0.09) | 1.2 | ||||||
| 0.115 | 1.0 | 0.08 (0.04) | 2.1 | |||||
| 0.5 | 0.17 (0.08) | 2.0 | ||||||
| 0.2 | 0.52 (0.30) | 1.8 |
Note. — Measured values from Figure 2. and show the positions (measured in 0.05 mas pixel size) of each measurement relative to the continuum peak position in the map center at each frequency. is the continuum level, is the absorption level, is the optical depth of each transition, and is the spectral index derived from the continuum levels at the two frequencies, shown in bold font if it satisfies our selection criteria of . The uncertainties (or noise levels) of the continuum and the absorption level are 0.005 Jy/beam and 0.004 mJy/beam, respectively. The uncertainty of each spectral index is 0.6, assuming a systematic error of 20% in flux scale calibration at each frequency band. (Note the flux-scale error does not affect values, since is measured using the relative ratios of the absorption and the continuum levels at each band.) We measured the rotational temperature from the two transitions, assuming identical covering factors . Measurements for the transition were made along the axis shown in Figure 2. Note that excluded measurement positions with spectral indices outside of are also listed for comparison.