xx–xx
The LF of TP-AGB stars in the LMC/SMC
Abstract
We show that Montecarlo simulations of the TP-AGB stellar population in the LMC and SMC galaxies using the CB∗ models produce LF and color distributions that are in closer agreement with observations than those obtained with the BC03 and CB07 models. This is a progress report of work that will be published elsewhere.
keywords:
stars: evolution, stars: AGB and post-AGB, galaxies: stellar content, galaxies: evolution1 Introduction
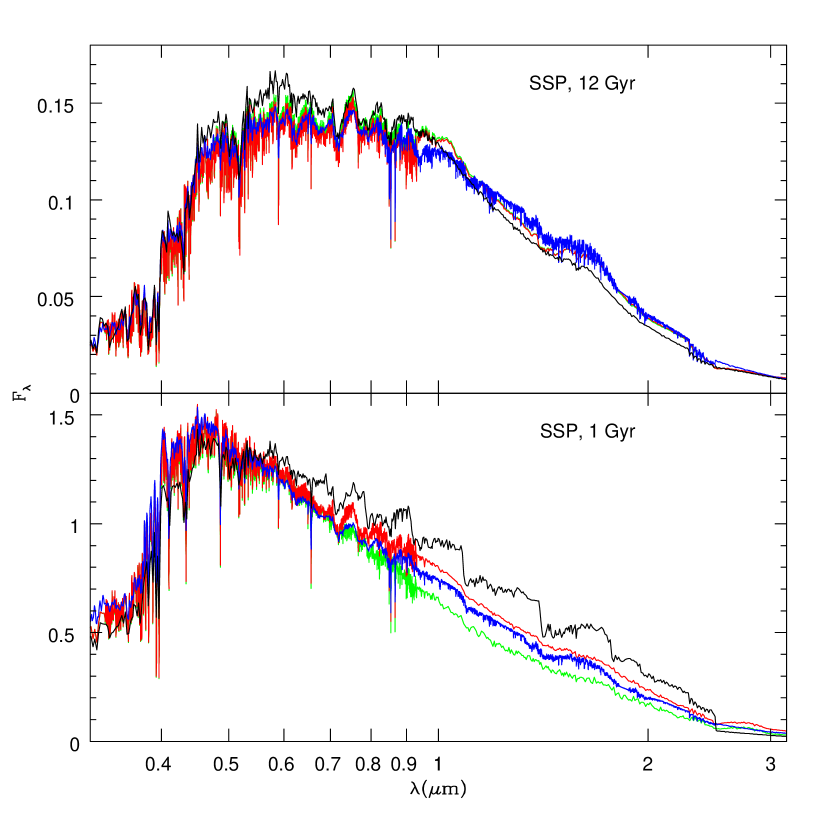
It has been known for quite some time now that intermediate mass stars in the thermally pulsing asymptotic giant branch (TP-AGB) phase of their evolution contribute at least 50% of the NIR light in a simple stellar population (SSP) of age 1-2 Gyr, e.g., [Maraston (2005)], Bruzual (2007, 2011). The treatment of this stellar phase in stellar population synthesis models determines the predicted spectral energy distribution (SED) of stellar populations in this wavelength and age range. In Fig. 1 we compare the predictions of [Maraston (2005)] for a Salpeter IMF, , SSP model at two different ages, with the predictions of three different versions of our code: (a) the BC03 models; (b) the minor revision of these models introduced by CB07, and (c) a major revision of this code and models (in preparation, hereafter CB∗). The CB07 models use the same sets of stellar tracks and spectral libraries as BC03, except for the TP-AGB stars, for which CB07 follow the semi-empirical evolutionary prescriptions by [Marigo & Girardi (2007)] and [Marigo et al. (2008)]. The CB∗ models used in this paper are based on the stellar evolution models computed by [Bertelli et al. (2008)]. Tracks are available for metallicities Z = 0.0001, 0.0004, 0.001, 0.002, 0.004, 0.008, =0.017, 0.04, and 0.07. In CB∗ the evolution of TP-AGB stars follows a recent prescription by Marigo & Girardi (private communication), which has been calibrated using observations of AGB stars in the Magellanic Clouds and nearby galaxies (Girardi et al. 2010; [Melbourne et al. 2012]). In the optical range, the CB∗ models are available for the IndoUS ([Valdes et al. 2004]), Miles ([Sánchez-Blázquez et al. 2006]), Stelib ([Le Borgne et al. 2003]), and BaSeL 3.1([Westera et al. 2002]) spectral libraries. The NIR spectra of TP-AGB stars in CB∗ are selected from the compilation by [Lançon & Mouhcine (2002)], the NASA Infrared Telescope Facility (IRTF) library ([Rayner et al. 2009]), and the C-star model atlas by [Aringer et al. (2009)]. The effects of mass loss and reddening in the spectra of TP-AGB stars have been included in these models as described by [González-Lópezlira et al. (2010)]. The treatment of the TP-AGB in the M05 models is based on the Fuel Consumption Theorem and is thus completely independent of the prescriptions used in the BC/CB models.
2 Modeling the LF of TP-AGB stars in the LMC and SMC
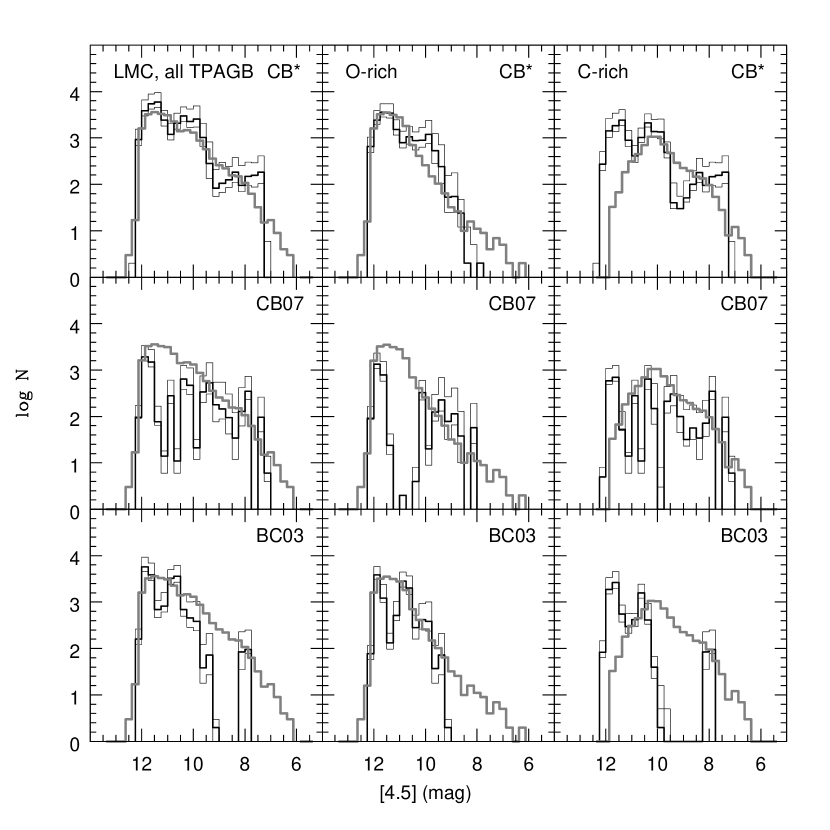
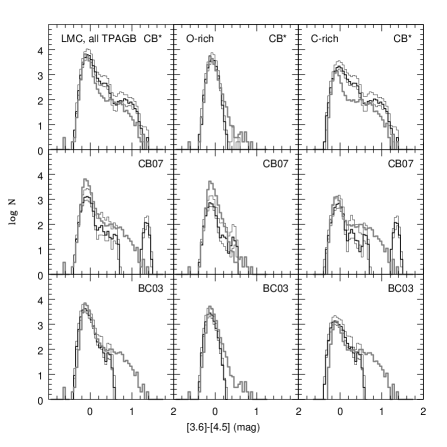
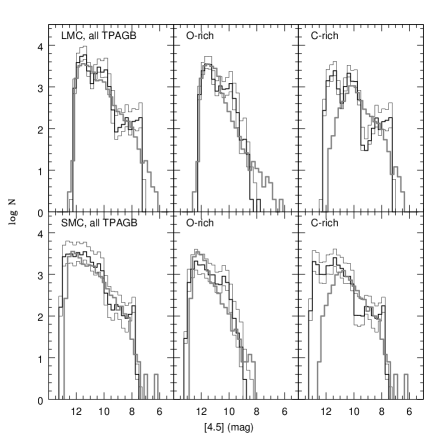
We model the distribution of TP-AGB stars in the CMD in various optical and NIR bands for a stellar population of , close to the LMC metallicity, by means of Montecarlo simulations (cf. [Bruzual 2002], 2010). At each time step the mass formed in stars is derived from the LMC star formation history ([Harris & Zaritsky 2009]). The stars are distributed in the CMD according to the isochrones computed with the CB∗, CB07, and BC03 models described in §1. Fig. 2 shows a comparison of the LF derived from our three simulations and the observed data set ([Srinivasan et al. 2009]) in the band. The corresponding color distributions are shown in Fig. 3. Using the same procedure and the SFH of the SMC from [Harris & Zaritsky (2004)] we model the TP-AGB stellar population in the SMC galaxy, Fig. 4. In the case of the SMC the chemical evolution indicated by [Harris & Zaritsky (2004)] is included in our simulations. Inspection of Figs. 2-4 show that the LF’s computed with the CB∗ models are in closer agreement with the observations that those computed with the BC03 and CB07 models. These results are consistent with the findings by [Kriek et al. (2010)], Melbourne et al. (2012), and [Zibetti et al. (2012)] (see caption to Fig. 1), and support our choice for the treatment of TP-AGB stars in the CB∗ models. We do not have at hand enough information (isochrones) to perform the same kind of comparison with the M05 models. Details of this work will be published in a coming paper.
G. Bruzual acknowledges support from the National Autonomous University of México through grants IA102311 and IB102212.
References
- [Aringer et al. (2009)] Aringer, B. et al. 2009, A&A, 503, 913
- [Bertelli et al. (2008)] Bertelli, G. et al. 2008, A&A, 484, 815
- [Bruzual 2002] Bruzual A., G. 2002, in Extragalactic Star Clusters, IAU Symposium Ser., Vol. 207, eds. D. Geisler, E. K. Grebel, & D. Minniti, Provo:ASP, 616
- [Bruzual 2010] Bruzual, G. 2010, RSPTA, 368, 783
- [Bruzual (2007)] Bruzual, G. 2007, in Proceedings of the IAU Symposium No. 241 ”Stellar populations as building blocks of galaxies”, eds. A. Vazdekis and R. Peletier, Cambridge: Cambridge University Press, 125 (arXiv:astro-ph 0703052)
- [Bruzual (2011)] Bruzual, G. 2011, in Proceedings of the XIII LARIM, eds. W. J. Henney and S. Torres-Peimbert, Rev. Mex. Astron. Astrofis., Conf. Ser., 40, 36-41
- [Bruzual & Charlot (2003)] Bruzual, G., & Charlot, S. 2003, MNRAS, 344, 1000 (BC03)
- [Charlot & Bruzual (2007)] Charlot, S., & Bruzual, G. 2007, unpublished, models distributed on demand (CB07)
- [Girardi et al. (2010)] Girardi, L. et al. 2010, ApJ, 724, 1030
- [González-Lópezlira et al. (2010)] González-Lópezlira, R. et al. 2010, MNRAS, 403, 1213
- [Harris & Zaritsky (2004)] Harris, J. & Zaritsky, D. 2004, AJ, 127,153
- [Harris & Zaritsky 2009] Harris, J. & Zaritsky, D. 2009, AJ, 138,1243
- [Kriek et al. (2010)] Kriek M. et al. 2010, ApJ, 722, L64
- [Lançon & Mouhcine (2002)] Lançon, A. & Mouhcine, M. 2002, A&A, 393, 167
- [Le Borgne et al. 2003] Le Borgne, J.-F. et al. 2003, A&A, 402, 433
- [Maraston (2005)] Maraston C. 2005, MNRAS, 362, 799 (M05)
- [Marigo & Girardi (2007)] Marigo, P., & Girardi, L. 2007, A&A, 469, 239
- [Marigo et al. (2008)] Marigo, P. et al. 2008, A&A, 482, 883
- [Melbourne et al. 2012] Melbourne, J. et al. 2012, ApJ, 748, 47
- [Rayner et al. 2009] Rayner, J.T. et al. 2009, ApJS, 185, 289
- [Sánchez-Blázquez et al. 2006] Sánchez-Blázquez, P. et al. 2006, MNRAS, 371, 703
- [Srinivasan et al. 2009] Srinivasan, S. et al. 2009, AJ, 137, 4810
- [Valdes et al. 2004] Valdes, F. et al. 2004, ApJS, 152, 251
- [Westera et al. 2002] Westera, P. et al. 2002, A&A, 381, 524
- [Zibetti et al. (2012)] Zibetti, S. et al 2012, MNRAS, submitted (arXiv:1205.4717)