The Planetary Nebulae Population in the Nuclear Regions of M31: the SAURON view
Abstract
The study of extragalactic Planetary Nebulae (PNe) in the optical regions of galaxies, where the properties of their stellar population can be best characterised, is a promising ground to better understand the late evolution of stars across different galactic environments. Following a first study of the central regions of M32 that illustrated the power of integral-field spectroscopy (IFS) in detecting and measuring the [O iii] emission of PNe against a strong stellar background, we turn to the very nuclear PN population of M31, within 80 pc of its centre. We show that PNe can also be found in the presence of emission from diffuse gas, as commonly observed in early-type galaxies and in the bulge of spirals, and further illustrate the excellent sensitivity of IFS in detecting extragalactic PNe through a comparison with narrow-band images obtained with the Hubble Space Telescope. Contrary to the case of the central regions of M32, the nuclear PNe population of M31 is only marginally consistent with the generally adopted form of the PNe luminosity function (PNLF). In particular, this is due to a lack of PNe with absolute magnitude brighter than , which would only result from a rather unfortunate draw from such a model PNLF. The nuclear stellar population of M31 is quite different from that of the central regions of M32, which is characterised in particular by a larger metallicity and a remarkable UV-upturn. We suggest that the observed lack of bright PNe in the nuclear regions of M31 is due to a horizontal-branch population that is more tilted toward less massive and hotter He-burning stars, so that its progeny consists mostly of UV-bright stars that fail to climb back up the asymptotic giant branch (AGB) and only of few, if any, bright PNe powered by central post-AGB stars. These results are also consistent with recent reports on a dearth of bright post-AGB stars towards the nucleus of M31, and lend further support to the idea that the metallicity of a stellar population has an impact on the way the horizontal branch is populated and to the loose anticorrelation between the strength of the UV-upturn and the specific number of PNe that is observed in early-type galaxies. Finally, our investigation also serves to stress the importance of considering the same spatial scales when comparing the PNe population of galaxies with the properties of their stellar populations.
keywords:
galaxies: elliptical and lenticular – galaxies: stellar content – galaxies: individual: M31 – ISM: planetary nebulae: general – stars: AGB and post-AGB1 Introduction
Planetary Nebulae (PNe) in external galaxies are mostly regarded either as tracers of the gravitational potential (e.g., Romanowsky et al., 2003; Douglas et al., 2007) or as indicators for the distance of their galactic hosts (e.g., Ciardullo et al., 1989; Jacoby, Ciardullo, & Ford, 1990; Jacoby et al., 1992), with the latter advantage owing to the nearly universal – though not fully understood – shape of the PNe luminosity function (PNLF, generally in the [O iii] emission). Yet extra-galactic PNe can also be used as probes of their parent stellar population (e.g., Richer, Stasińka, & McCall, 1999; Jacoby & Ciardullo, 1999; Dopita et al., 1997) and understanding in particular the origin of the PNLF is a puzzle that, once solved, promises to reveal new clues on the late stages of stellar evolution and on the formation of PNe themselves (see, e.g., Ciardullo, 2006).
PNe originate from horizontal-branch (HB) stars that climb back up the asymptotic giant branch (AGB) at the end of their helium-burning phase, after which these stars leave the AGB and quickly cross the Hertzprung-Russell diagram on their way towards the cooling track of white dwarves (WD). For a population with a given age and metallicity, HB stars have nearly the same helium core mass () but a range of hydrogen shell mass (), with the reddest stars having also the largest H-shells and originating from the most massive main-sequence progenitors. Only HB stars with a considerable H-shell ascend toward the AGB and eventually lead to the formation of a PN (being known at this point as post-AGB or early post-AGB stars depending on their UV brightness), whereas the bluest HB stars with little envelope mass head straight toward the WD cooling curve by evolving first to higher luminosities and effective temperatures (the so-called AGB-manqué phase, see Greggio & Renzini, 1999).
According to this simple picture, galaxies with on-going star formation should show brighter PNe than quiescent systems where massive stars have long disappeared (e.g., Marigo et al., 2004 show that the most luminous PNe arise from 1 Gyr old 2.5 stars), but in fact the PNLF of young and old galaxies are relatively similar. In particular, all extra-galactic PNe surveys indicate a common and bright cut-off for the PNLF, which led Ciardullo et al. (2005) to suggest a binary evolution for the progenitors of the brightest PNe that would be common to different kind of galaxies. Alternatively, a similarly bright PNLF cutoff in elliptical galaxies might be explained by minor mergers mixing in 1 Gyr old stars with the much older stellar population of these galaxies (Mamon, Dekel, & Stoehr, 2005). If galaxies seem to invariably host very bright PNe, their specific content of PNe - that is the number of PNe normalised by a galaxy bolometric luminosity - appears to vary with the metallicity of the stellar population. More specifically, Buzzoni, Arnaboldi, & Corradi (2006) found that more metal-rich galaxies show comparably fewer PNe, which also corresponds to larger far-UV fluxes. Interestingly, this may indicate that, at a given mean stellar age, a larger metallicity would bias the HB population towards fewer stars with a massive H-shell capable of leading to the formation of PNe. On the other side, a larger fraction of blue HB stars will instead contribute to the overall far-UV flux of their host galaxy (i.e. the so-called UV-upturn, Burstein et al., 1988) as they follow their AGB-manqué evolution. This trend is not completely unexpected given that the mass of the H-shell around HB stars depends on the amount of mass they have lost on the red-giant branch and that in turn the mass-loss rate efficiency should increase with stellar metallicity (Greggio & Renzini, 1990). Yet, it must be borne in mind that could also follow an increase in the abundance of Helium that may also come with a larger stellar metallicity.
Within this context, we note that whereas our knowledge of both the shape and normalisation of the PNLF comes chiefly from the peripheral PN populations of galaxies, measurements of both the stellar metallicity and the UV spectral shape of galaxies pertain to their optical regions. Indeed, with ground-based narrow-band imaging or slitless spectroscopy - the most common techniques employed to find extragalactic PNe - is is difficult to detect PNe against a strong stellar background, whereas measuring the strength of stellar absorption lines or imaging the far-UV flux of galactic halos is prohibitively expensive in terms of telescope time. Such a dramatic spatial inconsistency needs to be resolved to understand the link between PNe and the properties of their parent stellar populations, in particular if we consider that such a connection may already not be entirely within our grasp, as suggested by the Hubble Space Telescope (HST) observations of M32 obtained by Brown et al. (2008) who uncovered a dearth of UV-bright stars compared to what expected from stellar evolutionary models.
In our investigation of the compact elliptical M32 (Sarzi et al., 2011, hereafter Paper I) we have demonstrated how integral-field spectroscopy can overcome the previous limitations and detect PNe in the central regions of galaxies. In fact, with SAURON data taken with just two 10-minute pointings we could double the number of known PNe within the effective radius of M32 and detect PNe five times fainter than previously found in narrow-band images that collected nearly the same number of photons. Here we will turn our attention to the nuclear regions of M31, using SAURON observations of similar depth and spatial coverage, and motivated by the known differences between the stellar metallicity and UV colours of M31 and M32 (e.g., Burstein et al., 1988).
This paper is structured as follows. In §2, we briefly review the acquisition and the reduction of the SAURON data for M31. In §3, we detail our method for identifying PNe and measuring their [O iii] flux, accounting also for the presence of diffuse ionised-gas emission in M31 and comparing our PN detections and flux measurements with the ones obtained from HST narrow-band imaging. In §4, we assess whether our data are consistent with the generally adopted shape for the PNLF, finding evidence for a dearth of bright PNe in the nuclear regions of M31, which we then discuss in §5 in the context of the stellar population properties of this and other galaxies. Finally, in §6 we draw our conclusions.
Throughout this paper we assume a distance of 791 kpc for M31, taken to be equal to that to M32 based on the surface-brightness fluctuation measurements of Tonry et al. (2001).
2 Observations and Data Reductions
M31 (NGC 224) was one of the special objects that were observed over the course of the SAURON representative survey (de Zeeuw et al., 2002). Its central regions were observed with two 1800s slightly offset pointings and using the low-resolution mode of SAURON, which gives a field-of-view fully sampled by square lenses (for more details on the instrument see Bacon et al., 2001a). At the assumed distance of 791 kpc such an field corresponds to a circular area 76 pc in radius. The data from each pointing were reduced similarly to the data obtained for the objects of the main SAURON sample (see Emsellem et al., 2004; Falcón-Barroso et al., 2006), and the resulting datacubes were merged and resampled in spatial elements each corresponding to spectra covering the wavelength range between 4830Å and 5330Å with a final spectral resolution of 4.2Å (FWHM, for a ). The only differences with the data used in the papers of the SAURON project are that here we did not perform any Voronoi spatial binning (Cappellari & Copin, 2003), to avoid swamping the signal of the weaker PNe against an increased stellar background, and that we re-adjusted the absolute flux calibration of the SAURON cube using data obtained with HST.
In particular, we have used archival Wide-Field Planetary Camera (WFPC2) narrow-band images obtained in the F502N passband, since this filter falls entirely within the wavelength range of our SAURON data and because the typical old stellar spectrum of early-type galaxies and bulges can be considered pretty much as a flat spectral energy density source across the F502N filter. In fact, since the PHOTFLAM keyword in the HST images is defined as the flux density of a flat spectral source (in ) that would produce a flux corresponding to one count per second, this situation allows to use the PHOTFLAM keyword to construct a flux-density profile that can be readily matched (accounting for the different pixel size) to the radial trend for the median flux density of our SAURON spectra (where such a median value is not affected by the presence of [O iii] emission).
3 Data Analysis
3.1 Emission-line Measurements
In order to identify the PNe in the nuclear regions of M31 and measure their flux in the [O iii] line, we first need to separate as accurately as possible the stellar and nebular contribution to each of the SAURON spectra, and then to further disantangle the emission due to PNe from the one arising from diffuse gas.
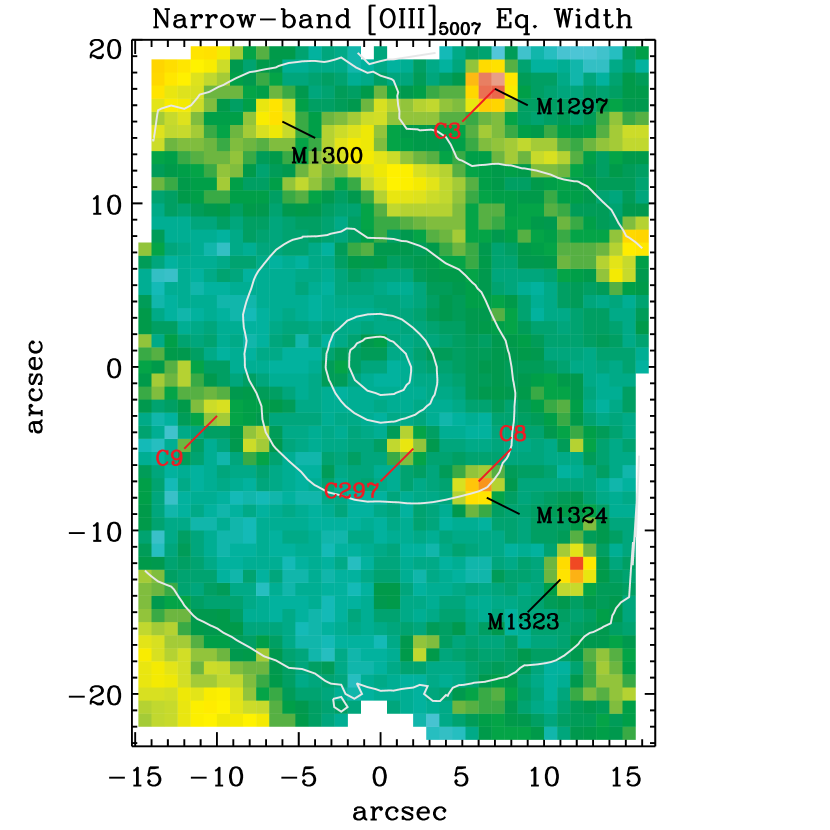
Extended ionised-gas emission is common in early-type galaxies and in the bulges of disc galaxies (Sarzi et al., 2006; Falcón-Barroso et al., 2006). A first [O iii] narrow-band image made from the SAURON data (Fig. 1, see caption for details) indeed reveals prominent lanes of diffuse emission, as well as a number of compact sources of [O iii] emission, some of which were already recognised as PNe by Ciardullo et al. (1989) and Merrett et al. (2006).
In principle, the PNe and diffuse ionised-gas emission have sufficiently distinct characteristics to produce complicated line profiles where both components occur, such that properly extracting the flux of a PN surrounded by diffuse emission may require to separate the relative contribution of these components directly in the spectra (for instance through a double-Gaussian fit). In fact, across a given region where a putative PN would spread its nebular flux according to the telescope and seeing point-spread function (PSF), the PNe emission lines should be spectrally unresolved in our spectra (PNe have an intrinsic line profile with a velocity dispersion of only of few tens of , much smaller than our instrumental resolution), falling always at the position corresponding to the velocity of the PN and with a strength - or peak spectral density amplitude - that varies between different spatial bins according to the shape of the PSF (e.g. a bi-dimensional Gaussian). The putative PN spectrum should also be always characterised by the same [O iii]/H line ratio. On the other hand, the diffuse ionised-gas emission could, in principle, come with different kinematics, strength and line-ratios across the entire region where the PN emission is found.
In practice, however, we do not expect to observe dramatic variations in the properties of the diffuse gas where the light of a given PN falls, either because such fluctuations are not likely to occur across the physical scale that correspond to a seeing disc (that is, 14 pc for a - see §3.2 for how this is derived) or since they will be considerably levelled by the PSF itself anyway (for instance, see Fig. 3 below for an illustration of how smooth the motion of the diffuse component is). Furthermore, the velocity of the PNe in the nuclear regions of M31 is unlikely to differ from that of the diffuse ionised-gas by more than a few 100 given the modest value for the stellar velocity dispersion (160 ; Saglia et al., 2010) and that both gas and stars rotate relatively slowly (at 50 and 100 , respectively). This means that the observed line profiles should not be exceedingly complicated in the presence of both PN and diffuse gas components (given the limited spectra resolution of our data), remaining in particular in the regime where a single Gaussian profile estimates sufficiently well the total nebular flux in our spectra111Simple tests show that a single Gaussian fit to double-Gaussian profiles allow to estimate to total flux with less than 10% uncertainty as long as the two Gaussian components are separated by less than 3 times their common dispersion. This is irrespective of the relative strength of the two Gaussians but assumes similar values for their dispersion, which is justified for our case study where both the PNe and the diffuse gas emission are characterised by intrinsic profiles that are hardly resolved. and thus allowing us to subsequently discern the presence of PNe using only a spatial analysis of the [O iii] flux distribution.
For these reasons we proceeded to extract the ionised-gas flux values in our spectra by adopting the fitting method of Sarzi et al. (2006), whereby a set of stellar templates and Gaussian emission lines are fitted simultaneously to the spectra222 In practice this is achieved by using the IDL code GANDALF (available at http://star-www.herts.ac.uk/sarzi) and the stellar kinematics extracted with the pixel-fitting IDL code pPXF (Cappellari & Emsellem, 2004, http://www-astro.ox.ac.uk/mxc/idl) , while adopting the approach of Sarzi et al. (2010) to further improve the match to the stellar continuum and ensure that the ionised-gas emission is extracted from the subtraction of a physically motivated stellar model.
| ID | x-off | y-off | [O iii]/H | ||||||||
|---|---|---|---|---|---|---|---|---|---|---|---|
| (1) | (2) | (3) | (4) | (5) | (6) | (7) | (8) | (9) | (10) | (11) | (12) |
| 1 | -2.35 | 0.42 | 80.3 | 3.1 | 8.6 | — | 66.7 | 262.3 | 57.3 | 120.4 | |
| 2 | 6.00 | -7.39 | 52.7 | 2.8 | 11.3 | — | 37.6 | 44.4 | -24.3 | 153.1 | 8.0 |
| 3 | 1.17 | -5.28 | 47.3 | 10.9 | 12.9 | — | 64.6 | -183.4 | 0.5 | 140.3 | |
| 4 | -10.10 | -2.91 | 55.1 | 2.4 | 15.2 | — | 47.1 | -214.1 | 21.8 | 144.5 | 17.2 |
| 5 | 11.91 | -12.20 | 49.3 | 1.5 | 15.5 | 46.4 | — | 61.2 | -31.2 | 155.1 | 7.4 |
| 6 | 6.74 | 17.18 | 66.6 | 4.7 | 22.1 | 66.4 | — | 13.1 | 10.6 | 176.0 | 11.5 |
| 7 | 1.81 | -4.57 | 20.1 | 10.1 | 12.9 | — | 11.9 | -127.1 | -7.8 | 144.2 | |
| 8 | -6.45 | 15.59 | 26.1 | 1.9 | 17.2 | 22.1 | 19.7 | 110.5 | 18.3 | 139.4 | 7.4 |
| 9 | -0.27 | 1.15 | 24.0 | 5.3 | 16.7 | — | 25.4 | 85.1 | 82.6 | 167.9 | |
| 10 | 15.65 | 7.83 | 21.5 | 1.4 | 17.8 | — | 17.3 | 25.1 | -16.1 | 160.4 | 5.2 |
| 11 | -7.68 | -4.35 | 16.1 | 2.8 | 15.2 | — | 19.9 | 108.1 | 6.7 | 138.7 | |
| 12 | 14.36 | 5.93 | 9.9 | 1.4 | 17.8 | — | 9.7 | -50.6 | -9.9 | 157.3 | 5.0 |
Notes: (1) PN ID. (2)–(3) R.A. and Declination offset position, in arcseconds, from the centre of M31. (4)–(6) Total [O iii] flux in , with associated formal error and detection limit. (7)–(8) Same as Col. (4) but now for values measured through a simultaneous spectral and spatial fit of the SAURON data, and from WFPC2 narrow-band images in the F502N filter. (9) Velocity of the PN, in and relative to the systemic velocity of M31, measured in spectra extracted within a FWHM-wide aperture around the center of the best-fitting Gaussian models shown in Figs. 4 and 5. (10)–(11) Velocity and velocity dispersion of the stars along the line-of-sight pointing to the direction of the PN, measured from the same aperture spectra. (12) [O iii]/H ratio, again in the same spectra. An upper-limit is listed when H is not detected, using an H flux that would correspond to lines with the same profile as the [O iii] lines and with an amplitude equal to 3 times the level of noise in the fit residuals (i.e., the detection threshold for H, following Sarzi et al., 2006).
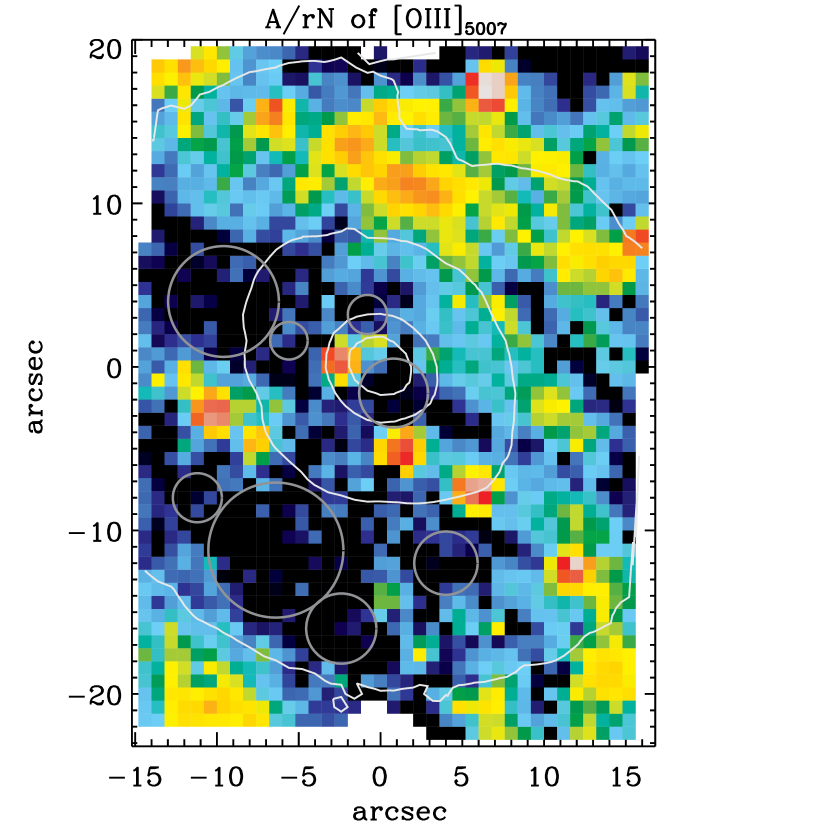
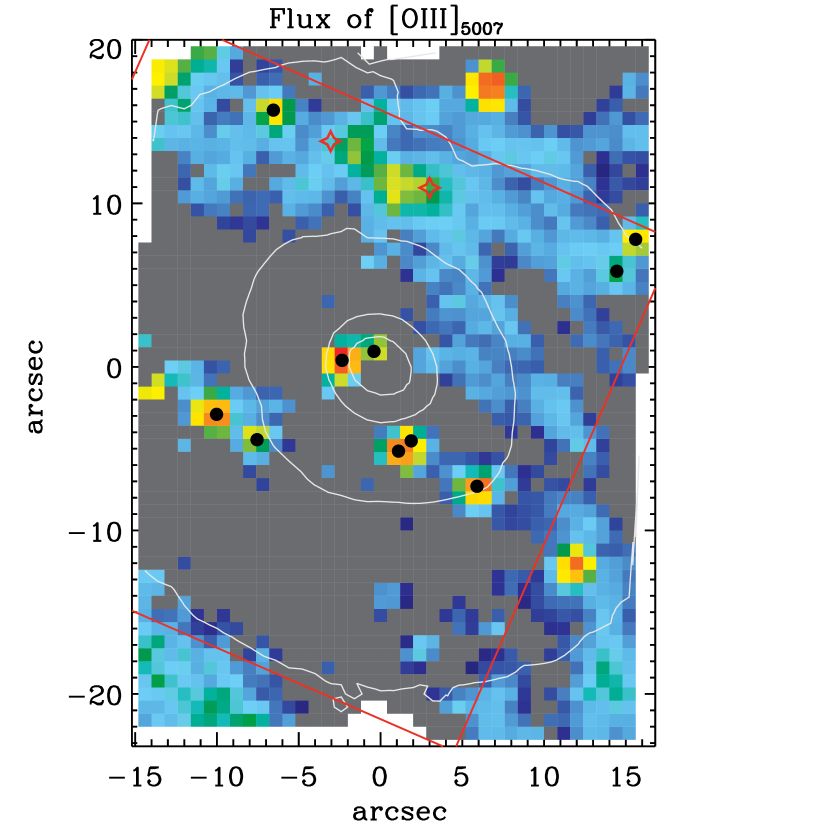
As a first result of this procedure, Fig. 2 shows the map of the ratio between the amplitude of the best-fitting Gaussian to the [O iii] line and the noise level in the residuals of the overall fit. The value of the ratio relates to the accuracy with which the flux, position and width of a single emission line can be estimated, with tests indicating a formal detection for (Sarzi et al., 2006). Dark blue colours in Fig. 2 show regions with no detected [O iii] emission (hereafter shown in grey) and where high-quality SAURON aperture spectra were extracted and subsequently converted into stellar templates in order to improve our spectral fit (Sarzi et al., 2010).
Compared to Fig. 1, the known PNe in the nuclear regions of M31 show up with a greater contrast as unresolved sources in the of Fig. 2, which further reveals the extent of the diffuse ionised-gas emission and the presence of the central PN already detected with integral-field data by Bacon et al. (2001b) A few additional unresolved sources could be present in Fig. 2, for instance around 8″ east of the nucleus and next to PN C9 of Ciardullo et al. (1989) or next the western edge of the SAURON field-of-view and around 8″ north of the nucleus.
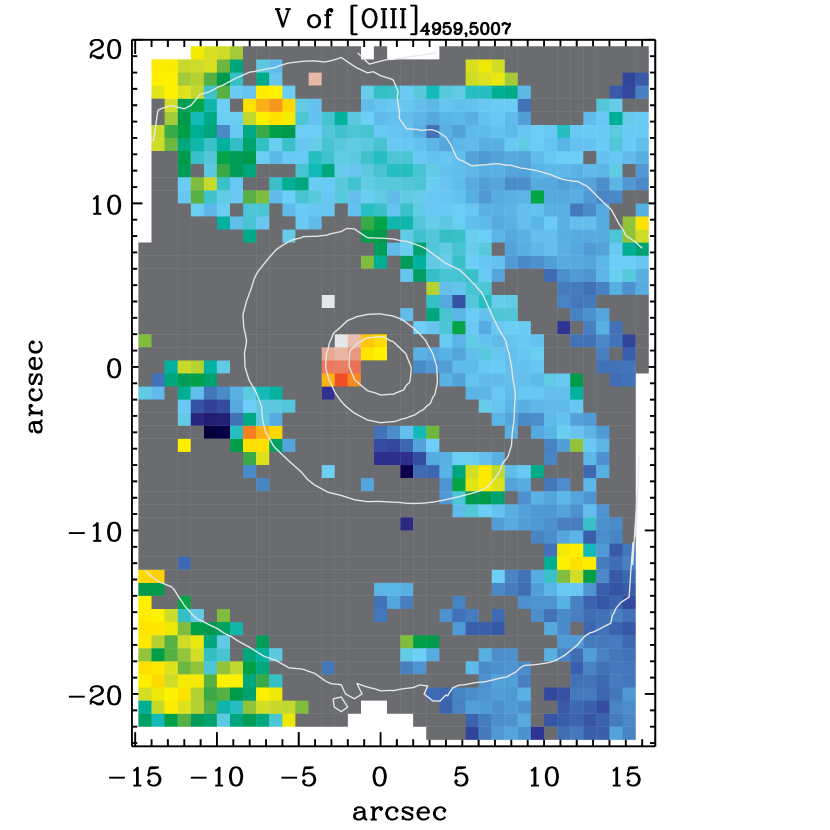
The kinematics of the [O iii] lines provides more elements to judge whether a given patch of [O iii] is likely to originate from a PN, since PNe are expected to generally move with a different velocity than the gas clouds responsible for the diffuse [O iii] emission that may be found along the same line of sight. Fig 3 shows indeed that where the known PNe dominate the nebular emission, the [O iii] kinematics appears quite coherent and at the same time significantly different from that of the surrounding diffuse component when this is present. This seems to be the case also for the two aforementioned putative sources, with the possible addition of few more regions.
3.2 PNe Detection and Flux Measurements
In order to measure the total [O iii] emission of the known PNe in the nuclear regions of M31 and assess more precisely the presence of additional sources, we proceeded to fit the [O iii] flux distribution around any putative PNe with a bi-dimensional Gaussian profile meant to represent the PSF, like already detailed in Paper I (including the possibility to match blended sources). Furthermore, we now also allow for a constant background level to account for the diffuse ionised-gas emission. During each of these fits, we adjusted the position and amplitude of the Gaussian models as well as the level of the background, whereas the full-width at half maximum (FWHM) of the PSF was optimized over the whole set of sources that were eventually deemed detected. This turned out to have a value of 144, for a . Considering a constant level for the background diffuse emission certainly represents a simple approximation and yet, despite it being meant initially only as a starting point for our modelling, this approach eventually turned out to work as well as more sophisticated models (see below).
In our previous analysis of M32 (Paper I), we deemed a given source that was successfully matched by our model a detected PNe if all [O iii] lines are detected (i.e., in the present case) within at least the FWHM of the bi-dimensional Gaussian model. The presence of diffuse ionised-gas in M31 has led us to require in addition that the peak amplitude of the Gaussian model exceeds by at least a factor 3 the background level of the diffuse emission, when this is needed. Furthermore, we should make sure that where the nebular emission is dominated by our putative PNe (i.e., within a FWHM), the values for the [O iii]/H ratio significantly exceed the typical values observed in the filament structures in the nuclear regions of M31, which range between 1 and 3, similarly to the case of the diffuse emission of early-type galaxies (Sarzi et al., 2006).
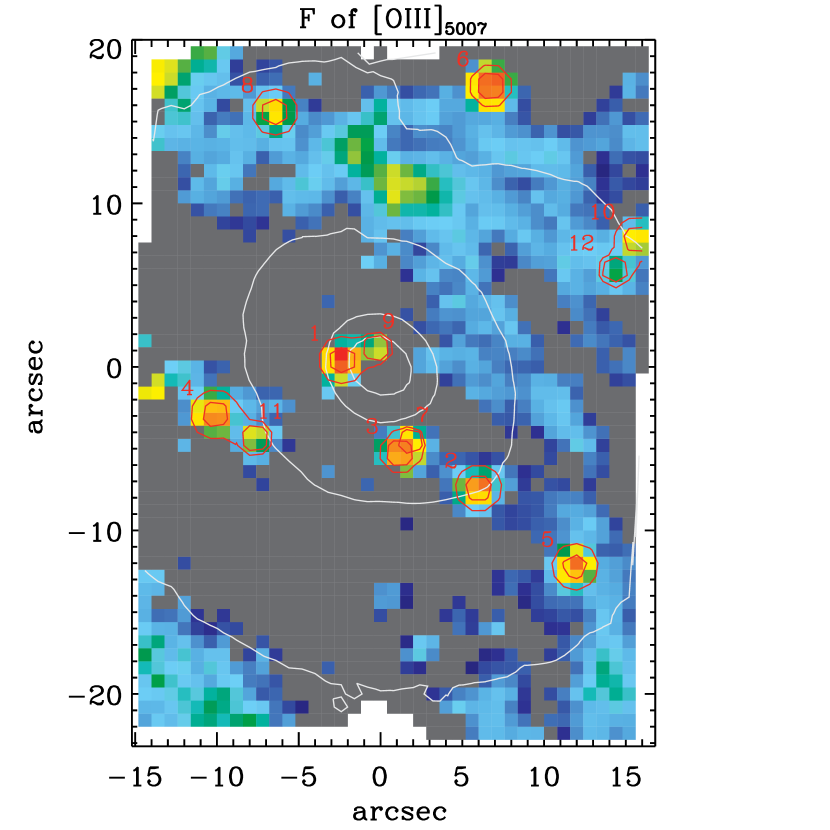
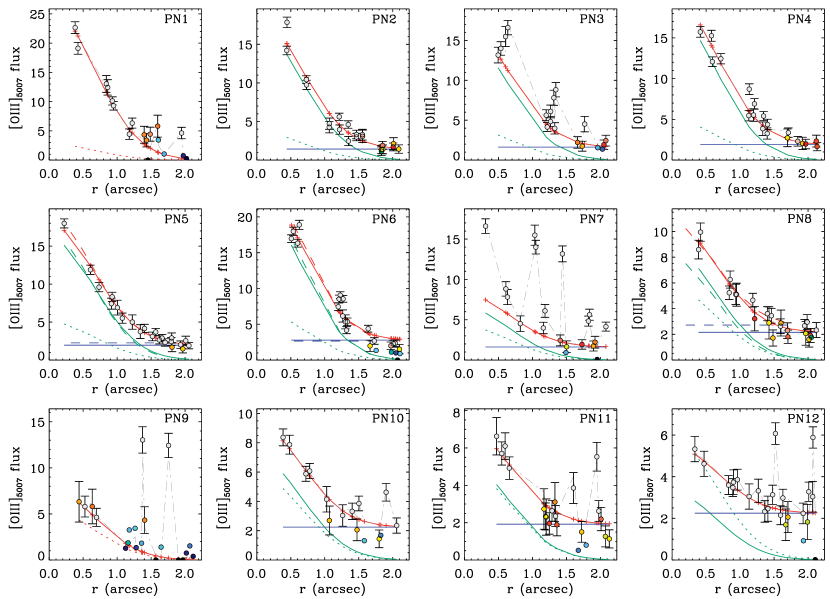
All the PNe that we eventually detected according to these criteria are located in the map for the [O iii] flux shown in Fig. 4. One of these sources (PN 7) was only identified following our analysis of HST images (see next section) and another (PN 12) represents only a marginal detection as the peak amplitude of its best-fitting bi-dimensional Gaussian is only twice the level of the background emission. Fig. 4 also nicely illustrates the relatively smooth character of the diffuse emission observed in the filamentary structures in central regions of M31, which supports our simple treatment of this component in our PNe fit as a constant background.
The quality of our fit to the [O iii] flux distribution of our detected PNe sources and their immediate surroundings can also be appreciated in Fig. 5, where the radial profile for the [O iii] flux of each PN is plotted together with its best-fitting Gaussian model. Fig. 5 also shows the Gaussian profile that corresponds to the limiting total PN flux that we could have measured, which is obtained by scaling down the best fitting Gaussian model until either its peak amplitude becomes less than three times the level of diffuse-gas emission (when present) or until it would induce the faintest [O iii] line within a FWHM to become undetected.
For all detected PNe, Tab. 1 lists their position relative to the centre of M31, their total flux of the [O iii] emission with its corresponding detection limit and our best estimate for their relative velocity and value of the [O iii]/H ratio (or lower-limit when H is not detected). The latter two measurements are based on fits to spectra extracted within a FWHM-wide aperture, in order to maximise the emission-line signal and better isolate the kinematics and line ratio of PNe that in projection are either close to each other or appear embedded in diffuse gas. These aperture spectra were also used to measure the stellar mean velocity and velocity dispersion along the line-of-sight pointing to the detected PNe, which can be compared to the PNe velocity in order to verify the PNe membership to M31. In fact, the presence of only 3 sources out of 12 with is consistent with the hypothesis that, as a group, these PNe belong to M31. Tab. 1 also lists the values [O iii]/H ratio for our detected sources, all of which, by construction, are above 3. Finally, we note that these are the only PNe that we manage to isolate after attempting to fit the most apparent peaks of [O iii] emission, and that only in one case did our fit converge on an unresolved source with a measured [O iii]/H .
3.3 Further Flux-Measurements Tests and Cross-check with HST data
To test our purely spatial approach for isolating the PNe emission from that of the diffuse gas, we re-measured the flux of three well detected single PNe surrounded by extended emission (PNe 5, 6 and 8) by means of a somewhat more general and simultaneous spectral and spatial fit of the [O iii] emission. More specifically, we re-fitted the 25 closer SAURON spectra to the centre of each of these three PNe (in a bins aperture) by matching their [O iii] lines with two Gaussian components, one for the PN emission and the other for the diffuse ionised-gas emission. Across this region, we fixed the kinematics of each set of lines, and still imposed a bi-dimensional Gaussian and constant spatial trend to the flux of the Gaussian lines representing the PNe and diffuse-gas components to the observed [O iii] profiles, respectively. During the fit we then optimised the centre and amplitude of the PNe profile, the level of the diffuse-gas emission, and also the position and width of the PNe and diffuse-gas lines (even though the PNe components were actually constrained to share a spectrally unresolved profile).
The resulting values for the flux of the PNe matched in this way differ by less than 15% from our earlier estimates, which is a tolerable level of discrepancy in the context of our analysis and supports the use of a simpler and purely spatial approach for extracting the flux also in the case of fainter PNe, where a spectral decomposition is more uncertain. Fig. 5 also shows the best-fitting Gaussians and constant radial profiles obtained for PNe 5, 6 and 8 through this more refined fit (dashed lines), whereas Tab. 1 lists the corresponding values. These flux values do not change considerably if, for instance, the background diffuse emission is treated as a plane rather than a constant level in the framework of a purely spatial analysis or if, alternatively, its amplitude is left free to vary across different bins during the previously described spectral decomposition.
The presence in the Hubble Legacy Archive (HLA) of narrow-band Hubble Space Telescope (HST) images for the nuclear regions of M31 provides a further opportunity to check whether we have missed any PN during our source identification and, in the process, also to check again the level of accuracy of our estimates. More specifically, we retrieved images taken with the Wide Field Planetary Camera 2 (WFPC2) in the F502N, F606W and F547M filters and, in this order, used them to a) initially identify possible sources of [O iii] emission, b) confirm PNe candidates by detecting their H and [N ii] emission and exclude spurious point-like sources in the F502N band (due for instance to an imperfect treatment of cosmic rays), and c) finally isolate stellar sources in the F502N images, most likely bright red-giant branch stars (RGB). We then proceeded to measure the flux of the PNe thus identified in the F502N image through standard aperture photometry.
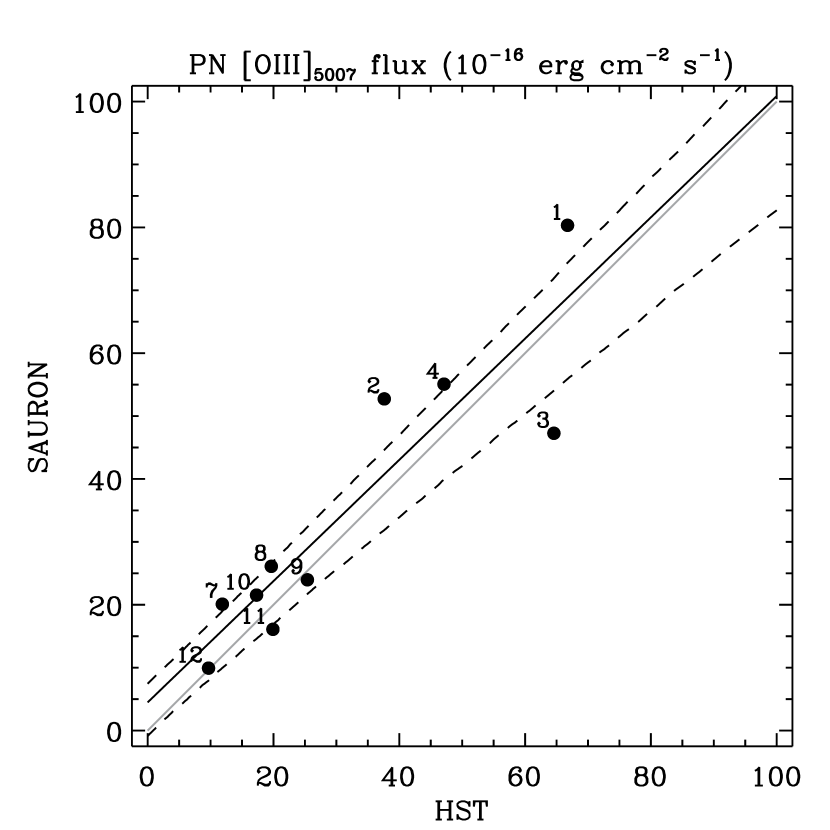
Figs. 6 and 7 show the comparison between the positions and flux values of the PNe identified in the HST narrow-band images and through the spectral analysis of the SAURON data. Quite remarkably all the SAURON PNe sources in the field-of-view of the F502N PC image do have an HST counterpart (including our marginally detected PN 12), which always falls within of the PN position estimated during our spatial fit to the SAURON [O iii] flux values (e.g., Fig 5). The converse is also true in Fig. 6, except for PN 7 which (as already anticipated) was only recognized as part of an apparent doublet with PN 3 following the analysis of the HST images. Fig. 7 shows that the values also agree quite well, generally within 30% and with no strong evidence for a systematic offset between the HST and SAURON values (Tab. 1 also lists the values derived from the HST images). Our procedures for identifying PNe in the SAURON data and for measuring their total [O iii] flux thus appear to be robust.
As a concluding aside, we note that our HST analysis revealed also the presence of two stellar sources, most likely RGB stars, in the portion of the SAURON field-of-view covered by the WFPC2 observations (Fig. 6). Incidentally, both stars fall quite close to the brightest region of diffuse nebular emission in our field, which is a coincidence that would be worth pursueing in the scientific framework concerning the nature of the stellar sources that are likely to power such diffuse gas (Sarzi et al., 2010).
4 Results
In the context of understanding the connection between extragalactic PNe and the properties of their parent stellar population, we now consider the characteristics of the luminosity function of the PNe that we have identified in the central 20 arcsec of M31, which correspond to the inner pc at the adopted distance of 791 kpc to this galaxy (i.e. Tonry et al., 2001).
In particular, we wish to assess to what extent the central PNe of M31 could have been drawn from the generally adopted form of the PN luminosity function (PNLF) introduced by Ciardullo et al. (1989). This does not necessarily have to be the case given that central stellar populations of M31 are quite different, and in particular more metal-rich, than what is observed in the rest of this galaxy (which is where the PNLF form of Ciardullo et al. was mostly established) and than what is expected in the stellar halos of more distant galaxies where PNe are typically detected.
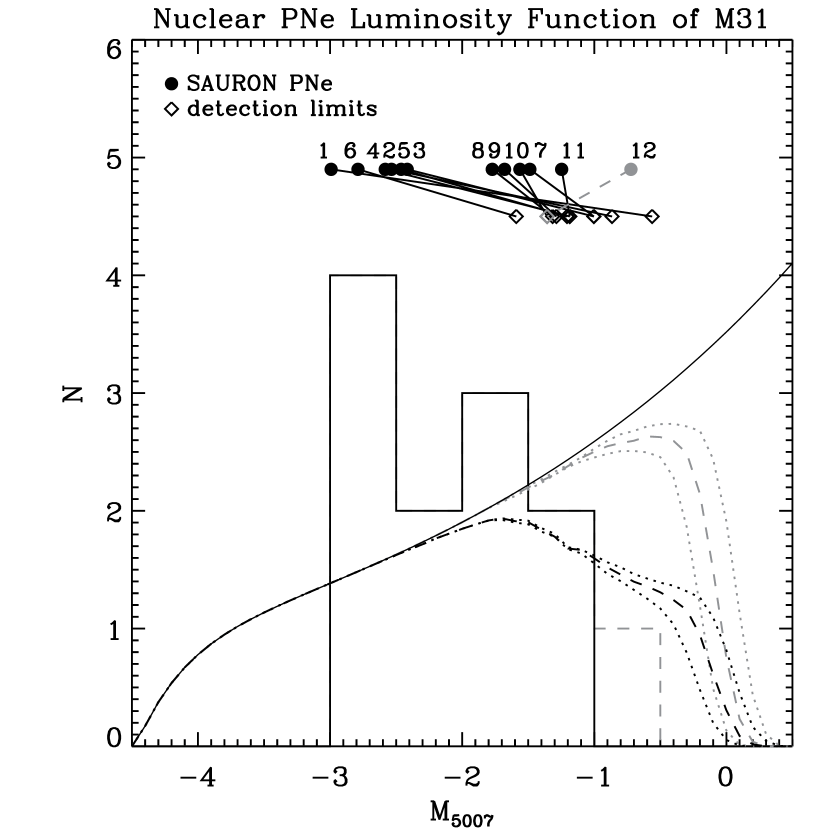
The central PNe luminosity function of M31 is presented in Fig. 8, where the values of Tab. 1 have been first converted into apparent V-band magnitudes following the formula of Ciardullo et al. (1989) and then into absolute magnitudes using a distance modulus of 24.49 magnitudes. The solid line in Fig. 8 shows also the theoretical PNLF of Ciardullo et al., which needs to be corrected for the fact that progressively fainter PNe are harder to detect before testing whether such a PNLF model can be regarded as the parent distribution for the PNe that we observe. Still, we already note a possible lack of bright PNe in M31 compared to what would be expected from the standard form of the PNLF, which cannot be explained by this kind of limitation.
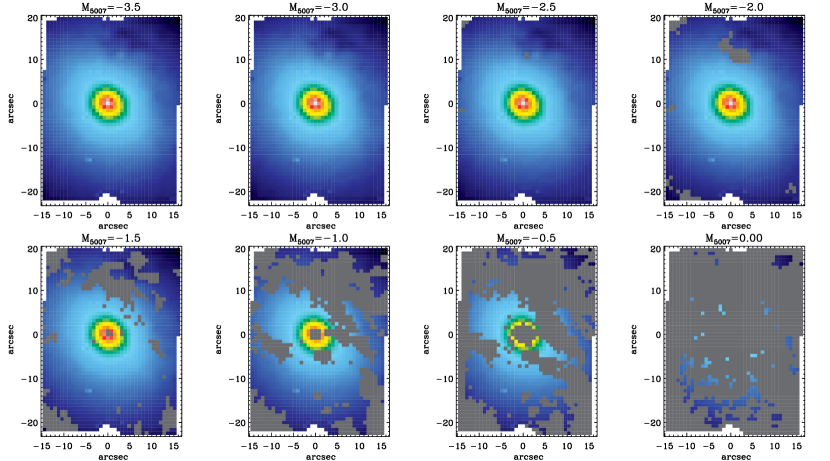
To compute the completeness function of our experiment, that is, the probability as a function of absolute magnitude that a PN of that brightness could be detected across the entire field-of-view of the SAURON observations for M31, we used a set of simulations similar to those performed in Paper I in the case of M32, even though here we also account for the adverse impact that the presence of diffuse ionised-gas emission has on the detection of PNe. These simulations, which are shown in Fig. 9 (see also the figure caption for details), illustrate how PNe of an absolute magnitude and fainter would quickly escape detection over most of the SAURON field-of-view, which is consistent with the fact that most of the detection limits for our PNe sources (shown with open diamonds in Fig. 8) pile up from a and above.
The completeness-corrected standard form for the PNLF is shown by the dashed line in Fig. 8, whereas the grey dashed line indicates the limit of our experiment if no diffuse ionised-gas emission were present in the nuclear regions of M31, which allows a comparison to our previous PNe survey in M32. In both cases, the dotted lines show the associated uncertainties on these functions. Accounting for incompleteness, a Kolgomorov-Smirnov test reveals that there is just a 46% probability that the observed PNe luminosity distribution was drawn from the theoretical prescription of Ciardullo et al., which is hardly surprising given the difference at the high-luminosity end between such a model and our data. In fact, a second set of simulations suggest that the apparent lack of bright PNe in our data could only result from a rather unfortunate sampling of the standard PNLF.
More specifically, starting from an intrinsic Ciardullo et al. shape of the PNLF and adopting a normalisation leading to match the number of observed PNe once the PNLF is corrected for incompletess (as is in fact the case for all the lines shown in Fig. 8), we generated a number of synthetic PN fields by considering at any particular position in the SAURON field of view the probability of having a PN of a given luminosity. Such a probability function simply corresponds to the total intrinsic PNLF rescaled by the fraction of stellar light that is observed in the SAURON spatial bin that is being considered. The [O iii] flux of the simulated PNe was then “observed” by obtaining maps for the ratio and by applying the same detection criteria described in §3.2, including checking whether a synthetic PN would be detected against the known background of diffuse ionised-gas emission. Based on a thousand of such synthetic PNe fields, only in 8.5% of the cases we could not find any PN brighter than , the current maximum PNe luminosity observed in the nuclear regions of M31.
This suggests that the standard form of the PNLF may not entirely apply to the nuclear regions of M31, and that the observed dearth of bright PNe in Fig. 8 may be real.
5 Discussion
The previous results on the luminosity function of the PNe found in the very central regions of M31 (within 80 pc) are at odds with the outcome of our earlier integral-field spectroscopic study of the PNe population in the optical regions of M32 (within one ). For that galaxy, the standard form of the PNLF could indeed be considered, to a fair degree of confidence, as the parent distribution of the PNe that we detected, with no significant features in their observed distribution function. We can attempt to interpret such a discrepancy by considering even the differences between the properties of the stellar populations encompassed by our SAURON observations for these two galaxies, in particular as regards the average value of their metallicity. A stronger stellar metallicity can indeed drive a larger mass-loss rate efficiency during the RGB phase, which in turn would reduce the number of HB stars with a massive H-shell that will eventually become bright PNe.
Even though there exist numerous stellar population studies in the literature on M31 and M32 (see, e.g., Saglia et al., 2010 and Rose et al., 2005, respectively) we can use our own SAURON data to compare the mean values for the stellar age and metallicity in these two galaxies in a more consistent way than possible when using different absorption line-strength measurements from the literature. For this, we co-added all the spectra in our data cubes after subtracting the emission from both PNe and diffuse ionised-gas components, and proceeded to fit such a total spectrum with the pPXF method of Cappellari & Emsellem (2004), using the entire MILES stellar library of Sánchez-Blázquez et al. (2006). We then combined the original stellar spectra from this library according to the relative weights that they were assigned during the pPXF fit, in order to obtain what effectively is the optimal stellar spectrum for representing the nuclear and central stellar populations of M31 and M32, respectively. Finally, we measured the strength of the standard H, Fe5015 and Mg indices from the Lick/IDS system on such optimal template, and followed Kuntschner et al. (2010) to compute from the Fe5015 and Mg indices the more purely metallicity-sensitive [MgbFe50]’ index, which is defined as .
The use of the MILES optimal templates allows us to circumvent problems related to an imperfect sky subtraction and relative flux calibration on the SAURON data, while obtaining at the same time index values that are automatically corrected for kinematic broadening. Such an approach is recommended only if the templates can match almost perfectly the real data, which is generally the case when using such a large library as the MILES one, even when considering the spectra of massive early-type galaxies (e.g., Sarzi et al., 2010; Oh et al., 2011) where an overabundance of elements usually poses a problem for a detailed spectral fitting (e.g., in the Mg region).
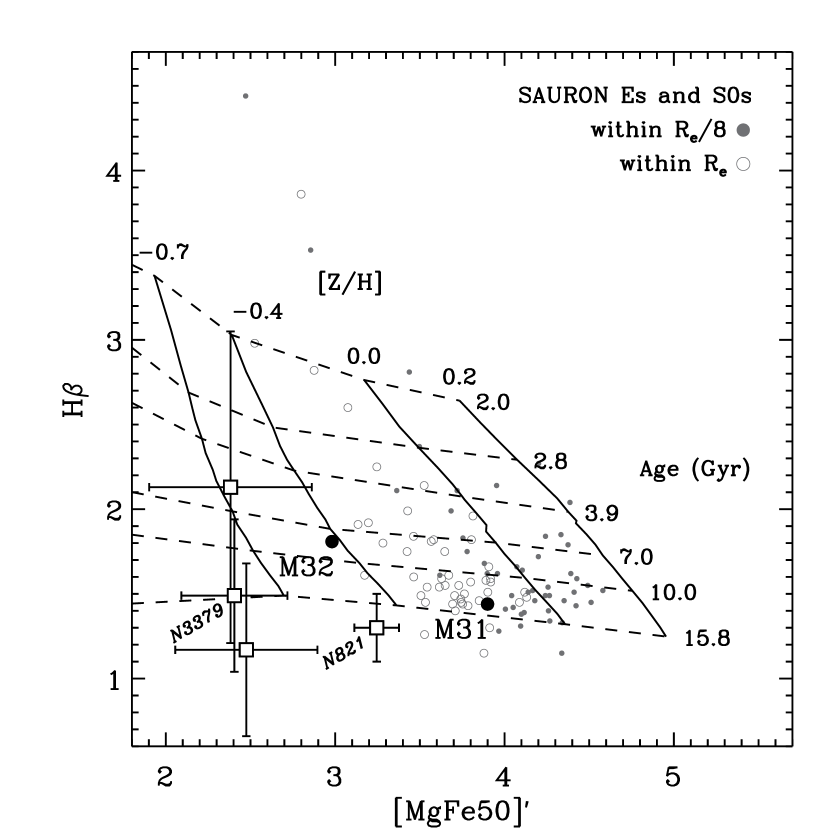
Fig. 10 shows the relative location of M31 and M32 in the [MgFe50]’ vs H diagnostic diagram, where an estimate for the mean age and metallicity of their nuclear and central stellar populations, respectively, can be read through the model grids of Schiavon (2007). In Fig. 10 we also plot the values for the same indices for the early-type galaxies in the SAURON representative sample, measured within both one and (data from Kuntschner et al., 2006), and for the stellar halos of NGC 821 (at a distance of one ) and NGC 3379 (at a distance between 3 and 4 ) from Weijmans et al. (2009).
The SAURON data confirm that the central 80 pc of M31 are more metal rich than the stellar population found in the central regions of M32, consistent with the hypothesis whereby an enhanced stellar-mass loss in the RGB that is driven by a larger metallicity would eventually lead to the observed lack of bright PNe in M31. In fact, our PNe findings appear to be independently backed up by Rosenfield et al. (2012) who, thanks to HST observations, finds that the relative number of bright post-AGB stars to that of fainter early post-AGB or AGB-manqué stars steadily decreases towards the centre of M31, nicely following also the central metallicity gradient measured by Saglia et al. (2010). These results would indeed agree with a dimming of the PNLF given that only post-AGB stars can power the brightest PNe, while supporting also the idea that a larger stellar metallicity is responsible for it. As regards M32, on the other hand, Fig. 10 shows that the optical regions of this galaxy have a value for the stellar metallicity that is close, though not as low, to what Weijmans et al. (2009) estimated with SAURON data in the halos of the early-type galaxies NGC 3379 and NGC 821. Since also the measurements of Weijmans et al. (2009) are based on SAURON data, all the values shown in Fig. 10 can be consistently compared to each other. If metallicity is indeed related to the lack of post-AGB stars and bright PNe in the nuclear regions of M31, then such a similarity may help understand why the central PNe population of M32 appears on the contrary to be consistent with the Ciardullo et al.’s form for the PNLF as in the case of the peripheral PNe populations of galaxies.
Rosenfield et al. also show that the central metallicity gradient of M31 corresponds closely to an increase in the far-UV excess towards the centre of M31, much as observed when these quantities are measured in different objects at larger galactic scales (Burstein et al., 1988; Bureau et al., 2011; Jeong et al., 2012) and consistent with the presence of a large number of AGB-manqué stars. This contrasts again with the case of M32, which has long been known to display little or no far-UV excess flux (Burstein et al., 1988).
Finally, we note that in terms of their stellar metallicity the nuclear regions of M31 fall roughly in between what is observed in the central metal-rich stellar populations of early-type galaxies (within ) and what is found on average within the effective radius of these objects (Fig 10, according always to measurements based on SAURON data). This suggests that also the PNe population of the optical regions of early-type galaxies could display a similar dearth of bright PNe as found in the central 80 pc of M31, which is a possibility that could have a significant impact on the presently rather loose anti-correlations between the specific number of PNe and either the stellar metallicity or the strength of the UV-upturn (Buzzoni, Arnaboldi, & Corradi, 2006; Coccato et al., 2009). In fact, it may be even possible that the current trends reflect a decrease only in the number of bright PNe in the halo of early-type galaxies with progressively larger central (and presumably also peripheral) metallicity values, rather than a change in the overall specific content of PNe. This may not be too far fatched considering that the completeness limit of most PNe surveys in external galaxies does not extend beyond 1 to 2.5 magnitudes from the peak PN magnitude of (see, e.g., Tab. 5 in Buzzoni, Arnaboldi, & Corradi, 2006) so that we only have a limited view on the shape of the PNLF of galactic halos.
6 Conclusions
Building on our previous integral-field spectroscopic study for the central PNe population of M32, in this paper we have further investigated the very central 80 pc of M31 and found that:
-
•
integral-field spectroscopy allows to detect PNe also in the presence of emission from diffuse gas, as commonly observed in early-type galaxies and in the bulge of spirals.
-
•
our relative inexpensive SAURON data could spot nearly all the PNe found in HST narrow-band band images, measuring total [O iii] flux values well in agrement with the HST measurements.
-
•
contrary to the case of the central regions of M32, the nuclear PNe population of M31 is only marginally consistent with the generally adopted Ciardullo et al. form of the PNe luminosity function
-
•
such a discrepancy is due to an observed lack of PNe with absolute magnitude brighter than , which simulations suggest would occur only considering a rather unfortunate (in 8.5% of the cases) sampling of such a model PNLF.
Considering that the nuclear stellar population of M31 is characterised by a larger stellar metallicity and a much stronger far-UV excess compared to what is found in the central (within one effective radius) regions of M32, the previous results would appear to support the idea that a larger metallicity (which enhances the stellar-mass loss efficiency in the RGB) can lead to an horizontal-branch population that is more tilted toward less massive and hotter He-burning stars, so that its progeny consists mostly of UV-bright AGB-manqué stars, but few, if any, bright PNe.
A lack of bright PNe is also consistent with the recent reports by Rosenfield et al. (2012) on a shortage of post-AGB stars towards the nucleus of M31, since bright PNe are powered by central post-AGB stars. If such a dearth of post-AGB stars and bright PNe does indeed correspond to nearly-solar values for the stellar metallicity or above, then such a feature is likely to characterise also the PNe luminosity function in the optical regions of more distant and massive old stellar systems, which would imply that the PNLF form of Ciardullo et al. (1989) is not universally applicable. This is in fact a possibility that will be explored in future papers that will use the SAURON data already at hand for the complete ATLAS3D sample of early-type galaxies (Cappellari et al., 2011), circumnventing the need for a prohibitively expensive narrow-band imaging campaign with HST.
Acknowledgements
We are grateful to Laura Greggio, Alvio Renzini, Enrico Maria Corsini, and Harald Kuntschner for their suggestions. We also thank the referee Michael G. Richer for providing very useful comments that improved the quality of this manuscript. NP acknowledges the University of Hertfordshire for funding his visit at the Centre for Astrophysics research where most of this study was carried out. NP and MS are also grateful, respectively, to the Astronomy Department of the University of Padova and to the European Southern Observatory for their hospitality. Finally, MS and MC acknowledge their respective STFC Advanced (ST/F009186/1) and Royal Society University Research fellowships.
References
- Bacon et al. (2001a) Bacon R., et al., 2001, MNRAS, 326, 23
- Bacon et al. (2001b) Bacon R., Emsellem E., Combes F., Copin Y., Monnet G., Martin P., 2001, A&A, 371, 409
- Bacon et al. (2006) Bacon R., et al., 2006, The Messenger, 124, 5
- Brown et al. (2008) Brown T. M., Smith E., Ferguson H. C., Sweigart A. V., Kimble R. A., Bowers C. W., 2008, ApJ, 682, 319
- Bureau et al. (2011) Bureau, M., Jeong, H., Yi, S. K., et al. 2011, MNRAS, 414, 1887
- Burstein et al. (1988) Burstein, D., Bertola, F, Buson, L. M., Faber, S. M., Lauer, T. R., 1988, ApJ, 328, 440
- Buzzoni, Arnaboldi, & Corradi (2006) Buzzoni A., Arnaboldi M., Corradi R. L. M., 2006, MNRAS, 368, 877
- Cappellari & Copin (2003) Cappellari M., Copin Y., 2003, MNRAS, 342, 345
- Cappellari & Emsellem (2004) Cappellari M., Emsellem E., 2004, PASP, 116, 138
- Cappellari et al. (2011) Cappellari M., et al., 2011, MNRAS, 413, 813
- Ciardullo et al. (1989) Ciardullo R., Jacoby G. H., Ford H. C., Neill J. D., 1989, ApJ, 339, 53
- Ciardullo et al. (2004) Ciardullo R., Durrell P. R., Laychak M. B., Herrmann K. A., Moody K., Jacoby G. H., Feldmeier J. J., 2004, ApJ, 614, 167
- Ciardullo et al. (2005) Ciardullo R., Sigurdsson S., Feldmeier J. J., Jacoby G. H., 2005, ApJ, 629, 499
- Ciardullo (2006) Ciardullo R., 2006, IAUS, 234, 325
- Coccato et al. (2009) Coccato L., et al., 2009, MNRAS, 394, 1249
- de Zeeuw et al. (2002) de Zeeuw P. T., et al., 2002, MNRAS, 329, 513
- Douglas et al. (2007) Douglas N. G., et al., 2007, ApJ, 664, 257
- Dopita et al. (1997) Dopita M. A., et al., 1997, ApJ, 474, 188
- Emsellem et al. (2004) Emsellem, E., et al. 2004, MNRAS, 352, 721
- Falcón-Barroso et al. (2006) Falcón-Barroso J., et al. 2006, MNRAS, 369, 529
- Greggio & Renzini (1990) Greggio L., Renzini A., 1990, ApJ, 364, 35
- Greggio & Renzini (1999) Greggio L., Renzini A., 1999, MmSAI, 70, 691
- Jacoby, Ciardullo, & Ford (1990) Jacoby G. H., Ciardullo R., Ford H. C., 1990, ApJ, 356, 332
- Jacoby et al. (1992) Jacoby G. H., et al., 1992, PASP, 104, 599
- Jacoby & Ciardullo (1999) Jacoby G. H., Ciardullo R., 1999, ApJ, 515, 169
- Jeong et al. (2012) Jeong, H., Yi, S. K., Bureau, M., et al. 2012, MNRAS, 423, 1921
- Kuntschner et al. (2006) Kuntschner H., et al., 2006, MNRAS, 369, 497
- Kuntschner et al. (2010) Kuntschner H., et al., 2010, MNRAS, 408, 97
- Mamon, Dekel, & Stoehr (2005) Mamon G. A., Dekel A., Stoehr F., 2005, AIPC, 804, 345
- Marigo et al. (2004) Marigo P., Girardi L., Weiss A., Groenewegen M. A. T., Chiosi C., 2004, A&A, 423, 995
- Merrett et al. (2006) Merrett H. R., et al., 2006, MNRAS, 369, 120
- Oh et al. (2011) Oh K., Sarzi M., Schawinski K., Yi S. K., 2011, ApJS, 195, 13
- Richer, Stasińka, & McCall (1999) Richer M. G., Stasińka G., McCall M. L. M., 1999, A&AS, 135, 205
- Romanowsky et al. (2003) Romanowsky A. J., Douglas N. G., Arnaboldi M., Kuijken K., Merrifield M. R., Napolitano N. R., Capaccioli M., Freeman K. C., 2003, Sci, 301, 1696
- Rosenfield et al. (2012) Rosenfield P., et al., 2012, ApJ, 755, 131
- Rose et al. (2005) Rose J. A., Arimoto N., Caldwell N., Schiavon R. P., Vazdekis A., Yamada Y., 2005, AJ, 129, 712
- Saglia et al. (2010) Saglia R. P., et al., 2010, A&A, 509, A61
- Sánchez-Blázquez et al. (2006) Sánchez-Blázquez P., et al., 2006, MNRAS, 371, 703
- Sarzi et al. (2006) Sarzi M., et al., 2006, MNRAS, 366, 1151
- Sarzi et al. (2010) Sarzi M., et al., 2010, MNRAS, 402, 2187
- Sarzi et al. (2011) Sarzi M., Mamon G. A., Cappellari M., Emsellem E., Bacon R., Davies R. L., de Zeeuw P. T., 2011, MNRAS, 415, 2832 (Paper I)
- Schiavon (2007) Schiavon R. P., 2007, ApJS, 171, 146
- Tonry et al. (2001) Tonry J. L., Dressler A., Blakeslee J. P., Ajhar E. A., Fletcher A. B., Luppino G. A., Metzger M. R., Moore C. B., 2001, ApJ, 546, 681
- Weijmans et al. (2009) Weijmans A.-M., et al., 2009, MNRAS, 398, 561