The Mott State and Superconductivity in Face-Centred Cubic Structured Cs3C60: A 133Cs-Nuclear Magnetic Resonance Study under Pressure
Abstract
Over the past 20 years, fullerides have been studied as the source of high-transition-temperature () superconductivity except for copper oxides. The recent finding of the Mott insulating state right beside superconductivity in Cs3C60 has suggested that magnetism helps raise even in fullerides as in heavy-fermion compounds, high- copper oxides, two-dimensional organic conductors, and iron pnictides. Namely, one tends to think that the link between Mott insulator and superconductivity takes place in fullerides, which can give rise to the mechanism beyond the Bardeen-Cooper-Schrieffer framework. However, the relationship between the Mott state and the superconductivity in Cs3C60 is still under debate. By nuclear magnetic resonance measurements under pressure, we find that the magnetism and superconductivity in Cs3C60 are competing orders. Different from previous reports, the phase separation of Cs3C60 crystals into the Mott and metallic states allows us to systematically study the evolution of the ground state under pressure. Our careful experiments have found that the prevention of a magnetic order is rather essential for the superconductivity in face-centred cubic Cs3C60, which presents a basic strategy for finding still higher in this system.
I Introduction
The alkali-doped fullerides C60 (: alkali ion) have been studied as the source of high-transition-temperature () superconductivityCapone . The highest of 38 K has been reported in the A15 phase of Cs3C60 under pressureGanin ; Takabayashi ; Ganin2 . The reported superconducting dome beside a Mott insulating phaseGanin ; Takabayashi ; Ganin2 is similar to that in heavy-fermion compoundsMathur , high copper oxidesPALee , two-dimensional organic conductorsKanoda1 ; Kanoda2 , and iron pnictidesKamihara ; Oka . Furthermore, the coexistence of antiferromagnetism and superconductivity has been suggestedTakabayashi . In order for superconductivity to survive and even to be enhanced in the vicinity of a Mott state, new mechanisms beyond the Bardeen-Cooper-Schrieffer (BCS) framework have been expectedCapone ; Ganin ; Takabayashi ; Ganin2 ; Iwasa ; IharaPRL ; IharaEPL .
Among its polymorphism, the face-centred-cubic (fcc) C60 also shows high- superconductivity. Its increases with increasing lattice constant by replacing the with a larger alkali ionHebard ; Fleming ; Tanigaki . Replacing the alkali ion K with Rb significantly increases from 20 to 30 KFleming . Furthermore, replacing Rb with Cs resulted in = 31.3 K for Rb2CsC60 Fleming and in = 33 K for RbCs2C60 Tanigaki . This relationship between and the lattice parameter suggests that the superconductivity is due to a conventional electron-phonon interaction because the decrease in the extent of overlapping of the molecular wave function drives the density of states, , up, and thus increasesStenger ; Pennington . However, since the large C60-C60 distance causes the localization of electrons on C60 balls, the end member of fcc Cs3C60 becomes a Mott insulator with 2.5 KGanin2 . is one order of magnitude smaller and the observed internal magnetic field is much smaller than those of A15 Cs3C60 owing to geometrical spin frustrationGanin ; Takabayashi ; Ganin2 . Notably, the highest of 35 K among fcc C60’s is found after suppressing this Mott state under pressureGanin2 . Thus, whether the metal-insulator transition plays any role in inducing high- superconductivity has become an issue in fullerides Capone ; Ganin ; Takabayashi ; Ganin2 ; Iwasa ; IharaPRL ; IharaEPL . The previous nuclear magnetic resonance (NMR) experiment suggested that the end point of metal-insulator transition exists above the superconducting dome, indicating that the electronic correlations leading to the Mott state also play a role in having a maximal adjacent to the Mott phase in Cs3C60 under pressureIharaEPL .
In this paper, we report that the Mott state and superconductivity of fcc Cs3C60 are competing orders. Our careful 133Cs-NMR spectrum and nuclear spin-lattice-relaxation time () measurements revealed that there are two different electronic phases for fcc Cs3C60. We find that the Mott state is robust against pressure and that the pressure-temperature phase diagram reported thus farGanin ; Ganin2 ; IharaEPL is difficult to understand only by the pressure effect on the Mott state. The other seed for superconductivity, namely, paramagnetic metal, is hidden in the background of the Mott state, which realizes the phase separation of the two orders of antiferromagnetism and superconductivity in the low-pressure region. For comparison, with a previous structural study under pressureGanin2 , we present a new phase diagram of temperature versus unit-cell volume around the Mott insulator-to-metal transition, which unambiguously indicates that the Mott state is unfavourable for forming Cooper pairs in Cs3C60.
II Experimental Procedure
fcc Cs3C60 crystals were synthesized by a solution process with CH3NH2 at low temperaturesGanin . Nominal amounts of Cs and C60 were introduced into glass tubes in an Ar glove box (O2 0.1 ppm and H2O 0.1 ppm), and mixed in CH3NH2 solution. Powder X-ray diffraction patterns were measured with RIGAKU TTR-III. The lattice parameter of 14.752 at room temperature, which is consistent with a previous report of 14.761 Ganin , was determined by Rietveld refinement with the GSAS programLarson . The fraction of the fcc polymorphic phase used in this experiment is 70 % (fcc : A15 : bco = 0.70 : 0.23 : 0.07). Here, bco denotes the body-centred-orthorhombic structureGanin ; IharaPRL ; Jeglic . This fraction of the fcc phase is comparable to previous reportsGanin ; IharaPRL . The magnetization was measured using a SQUID magnetometer (Quantum Design MPMS2) in the temperature range of 2 K.
BeCu and NiCrAl/BeCu piston-cylinder-type pressure cells were used to obtain the temperature dependence of magnetization and to perform NMR measurement under pressure, respectively. Daphne oil 7373 is used as a pressure-transmitting mediumMurata . The samples are paraffin-embedded to avoid possible degradation by Daphne oil under pressure. The of Sn was monitored to determine pressure at low temperatures.
NMR measurement was carried out using a phase-coherent spectrometer. The usual Hahn-echo method (), which reduces the A15 contribution to the signal by about a factor of 3, is successfully used to obtain only the fcc phase among its polymorphismGanin ; IharaPRL [see Fig. 1(a)]. The NMR spectrum is obtained by the Fourier transform of spin echo with a typical pulse sequence of 5s 10s and by plotting the spin echo intensity while sweeping the external magnetic field at a fixed frequency with typical pulse sequence of 60s 120s. The nuclear recovery curves for obtaining were measured using the first pulse length of about 10 s.
III Experimental Results
III.1 133Cs-NMR spectrum and
Figure 1(a) shows the 133Cs-NMR spectrum measured at = 200 K and = 0. Crystallographically, fcc Cs3C60 has two 133Cs sites. One is surrounded by octahedral C60 balls [Cs3C60 (O)], the other is surrounded by tetrahedral C60 balls [Cs3C60 (T)]Ganin2 . Fundamentally, both sites are in a single electronic state, i.e., the temperature dependences of for both sites are the sameStenger . On the other hand, it has been known that the other site (T′) in fcc C60 appears below room temperatureGanin2 ; IharaPRL ; Pennington ; Walstedt ; Gorny ; Maniwa ; Alloul ; Zimmer ; Skadchenko . It has been suggested that it comes from some crystal distortions such as displacements or vacancies of ions, a Jahn-Tellar distortion of the C60 ion, and a deviation from the expected C60 orientation in fcc C60 crystalsWalstedt ; Gorny ; Apostol . Furthermore, in the NaC60 compound, which has a simple cubic structure, the merohedral disorder is proposed as the origin of the T′ siteMatus . As shown in Fig. 1(a), the sharp peak next to the peak T arises from this T′ site [Cs3C60 (T′)]. For our Cs3C60 crystal, it is estimated from Fig. 1(a) that the volume fraction ratio of the T site to the T′ site is 5.8 : 1 and the volume fraction of the T′ site in the entire spectrum is estimated to be 13%, which is consistent with the results of previous NMR studies of fcc C60 Ganin2 ; IharaPRL ; Pennington ; Walstedt ; Gorny ; Apostol ; Maniwa ; Alloul ; Zimmer ; Skadchenko . Note that the origin of the T′ site for fcc C60 remains unresolvedGanin2 ; IharaPRL ; Pennington ; Walstedt ; Gorny ; Apostol ; Maniwa ; Alloul ; Zimmer ; Skadchenko . However, it has been suggested by double resonance measurement and widely accepted that the T′ site forms clusters, which exist randomly in C60 crystals without site-to-site correlation.Walstedt ; PenningtonSEDOR

Figure 1(b) shows the temperature dependence of the 133Cs-NMR spectrum obtained by sweeping the external magnetic field at a fixed frequency of = 44.658 MHz. As seen in the figure, the spectrum obtained at = 1.5 K consists of two peaks, a sharp and a broad peak, indicating that there are two electronically different phases with and without an internal magnetic field (Mott and paramagnetic states) as the ground state, as will be discussed later. Notably, as shown by the dotted straight line, the peak position of the sharp peak is consistent with that for the T′ site at high temperatures. In addition, the volume fraction (15 %) of this sharp peak in the entire spectrum at = 1.5 K is also consistent with that for the T′ peak at high temperatures. Thus, it is indicated that these broad and sharp peaks originate from the T and T′ sites, respectively.

To elucidate the electronic property for fcc Cs3C60, we measured 133Cs systematically. For fcc Cs3C60, since there is no quadrupole interaction at the Cs site owing to highly symmetrical C60 balls surrounding Cs ionsGanin2 ; IharaPRL ; Pennington , the nuclear magnetization decay curve for obtaining for the 133Cs nucleus is a single-exponential functionGanin2 ; IharaPRL ; Pennington , 1 = exp, where and are the nuclear magnetizations in the thermal equilibrium and at a time after a saturation pulse. Figures 2(a), 2(b), 2(d), and 2(e) show typical datasets of the nuclear magnetization decay curves obtained through the integration of both the T and T′ peaks. Figures 2(c) and 2(f) show typical datasets of the nuclear magnetization decay curves obtained through the integration of the O peak. At high temperatures, since the O peak in the spectrum is well separated from the T and T′ peaks, we can obtain for Cs3C60 (O) from a single-component decay curve as 1 = exp. The absolute value of is consistent with previous reportsGanin ; IharaPRL .
On the other hand, for the T and T′ peaks, we observed two components, i.e., a short one and a long one. The solid curves are fittings consisting of a short () and a long () as = exp + (1) exp. Here, the absolute value of is consistent with previously reported for the T siteGanin ; IharaPRL . However, has not been reported for Cs3C60, although, most probably, it originates from the T′ site. As will be discussed later, these two s show completely different temperature dependences, indicating that the phase separation into two electronic states occurs in our fcc Cs3C60 crystal, which is consistent with the NMR spectrum [see Fig. 1(b)].
The present results are different from the results of previous NMR studies on Cs3C60Ganin ; IharaPRL . One reports a shorter for the T′ site than for the T site, and the temperature dependences of for both sites are similarGanin . The other report suggested that ’s for the T and T′ sites are the sameIharaPrivate . Although the origin of these differences is still unknown, from the temperature dependences of the Cs-NMR spectrum and , we conclude that our Cs3C60 crystal has different electronic states in the T and T′ sites as the ground state. We just speculate that the T′ site in our Cs3C60 crystal does not exist as clusters but as domains to form its own phase. A phase separation is often seen in strongly correlated electron systems such as manganese oxidesDagotto , and its mechanism might share some similarities across different classes of these materials. Here, we denote these two different phases for the T and T′ sites as the Cs3C60 (T) and Cs3C60 (T′) phases, respectively. As shown in the recovery curves, this two phases feature does not change under pressure.
III.2 -induced superconductivity in fcc Cs3C60
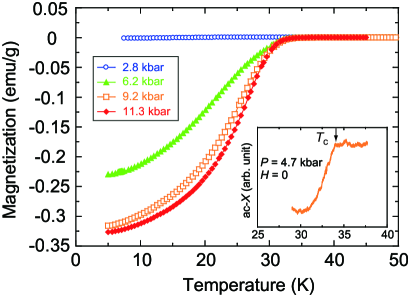
In this section, we present the results of the pressure-induced superconductivity of the fcc Cs3C60 crystal. Figure 3 shows the temperature dependence of magnetization. As seen in Fig. 3, the superconducting shielding fraction depends on pressure. This is consistent with previous resultsGanin2 ; IharaPRL . From Fig. 3, it is suggested that the superconductivity in full volume is realized only above 9 kbar. This is in contrast with that observed in heavy-fermion compounds SK or iron-pnictides ZLi where bulk superconductivity has been observed even in the coexisting state with antiferromagnetism.
III.3 and dependences of 1/
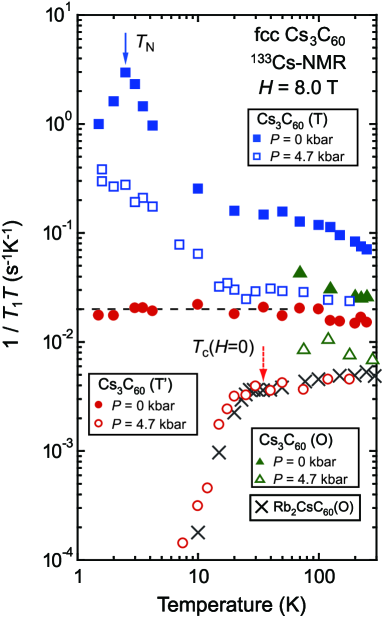
Next, we show the evolution of the electronic properties of the Cs3C60 (T) and Cs3C60 (T′) phases and its relation to the superconductivity under pressure. Figure 4 shows the temperature dependences of nuclear spin-lattice relaxation rate (1/) divided by temperature (1/) for the Cs3C60 (T&O) and Cs3C60 (T′) phases measured at = 0 and 4.7 kbar, respectively. In general, 1/ is proportional to electron spin susceptibility through the hyperfine coupling constant as
| (1) |
where is the NMR frequency. In fullerides, the dynamic spin susceptibility is caused by the antiferromagnetic fluctuation with a finite due to the localized electron spins on C60 moleculesPennington . Furthermore, if the lattice parameter decreases, then the overlapping of the C60 molecular wave function increases and C60 becomes a paramagnetic metalPennington . In such a case, since is proportional to the square of the density of states, , at the Fermi level and is -independent, eq. (1) yields the relation (Korringa-law). In particular, in fcc C60 crystals, 1/’s for the T and O sites are connected through each hyperfine coupling constantStenger as
| (2) |
As seen in Fig. 4, 1/ for the Cs3C60 (T) phase at = 0 and 4.7 kbar increases with decreasing temperature. This indicates that the antiferromagnetic fluctuation develops as a result of the localization of electron spins on C60 balls. At = 0, 1/ shows a peak at 2.5 K due to antiferromagnetic order. These results at = 0 are consistent with previous SR measurementsGanin . At = 4.7 kbar, we also observed an increase in 1/ down to = 1.5 K, suggesting that electron spins are still localized to lead to the Mott state. Notably, no superconducting transition is observed in the Cs3C60 (T) phase at = 4.7 kbar although the onset of pressure-induced superconductivity at () = 34.0 K is confirmed by ac susceptibility measurement using an NMR coil (see Fig. 3 inset). This is one of the most important results of this study, indicating that for the Mott state is above 4.7 kbar.
On the other hand, we found a very different temperature dependence of 1/ for the Cs3C60 (T′) phase. At = 0, 1/ satisfies the Korringa law at low temperature, indicating that the Cs3C60 (T′) phase is a paramagnetic metal. These results are consistent with the Cs-NMR spectrum shown in Fig. 1(b). At = 1.5 K, the Cs-NMR spectrum consists of a broad peak for Cs3C60 (T), which originates from the hyperfine field induced by the localized electron spins in the Mott state, and a sharp peak for Cs3C60 (T′), where such a field is absent in the metallic state. Thus, it is evidenced that the electronic state for the Cs3C60 (T′) phase is completely different from that for the Cs3C60 (T) phase, and that both phases are spatially separated. Since this separation between the Cs3C60 (T′) and Cs3C60 (T) phases is realized within the same fcc Cs3C60 crystal, it is suggested that the origin of the T′ site for our fcc Cs3C60 crystal is a positive chemical pressure (internal pressure, ) to delocalize electron spins on C60 balls, which causes the metallic state for the Cs3C60 (T′) phase.
At = 4.7 kbar, the superconducting transition is observed only in the Cs3C60 (T′) phase by a substantial decrease in 1/ below 30 K, contrary to the fact that no signature of superconductivity is seen in 1/ for the Mott-insulating Cs3C60 (T) phase. This is the source of the pressure-induced superconductivity of Cs3C60 in the low-pressure region. This is consistent with the observation of the partial superconducting shielding fraction at 9 kbar. From these results, it is clear that the superconductivity for fcc Cs3C60 is induced only for the paramagnetic metal. Notably, the temperature dependence of 1/ for the Cs3C60 (T′) phase at = 4.7 kbar traces the 1/ of 133Cs-NMR for Rb2CsC60 (O)Stenger . Namely, 1/ decreases exponentially below and the Korringa law is established above . Since the lattice parameter of fcc Rb2CsC60 is smaller than that of fcc Cs3C60, it is confirmed, from the electronic point of view, that the pressure effect on fcc C60 and the variation in its lattice parameter are equivalent.
It has been suggested that the mechanism of superconductivity in Rb2CsC60 is a conventional BCS oneStenger . The present result indicates that the mechanism of Cooper pair formation for fcc Cs3C60 under pressure is also in the framework of the BCS one. In such a case, localized electron spins on C60 balls in the Mott state break Cooper pairsAbrikosov . This also supports the scenario that the origin of the ”coexistence” of a Mott insulator and superconductivity in fcc Cs3C60 is the phase separation of the two orders in real space.
IV Discussion
To explain the present results systematically, we suggest that the phase separation originates from the formation of domains of the Cs3C60 (T′) phase due to local in fcc Cs3C60 crystals. At = 0, paramagnetic domains of the Cs3C60 (T′) phase are formed within the Mott-insulating Cs3C60 (T) phase. At = 4.7 kbar, as shown by the temperature dependence of 1/, only domains of the Cs3C60 (T′) phase become superconducting and a partial shielding fraction is observed. Note that the superconducting coherence length for fcc Rb3C60 ( = 31 K) is 19 Bunter . From this, it can be speculated that each domain will consist of more than 2 unit cells. Above 4.7 kbar, an insulator-to-metal transition occurs in the Cs3C60 (T) phase. Following that, superconducting domain size naturally increases through the proximity effect at the boundary of superconducting domains and the metallic region and thus, the shielding fraction increases. Above 9 kbar, pressure-induced superconductivity also occurs in the Cs3C60 (T) phase and the bulk superconductivity of the fcc Cs3C60 crystal sets in. This scenario can explain the pressure dependence of the superconducting shielding fraction qualitatively and is in good agreement with NMR results as well.
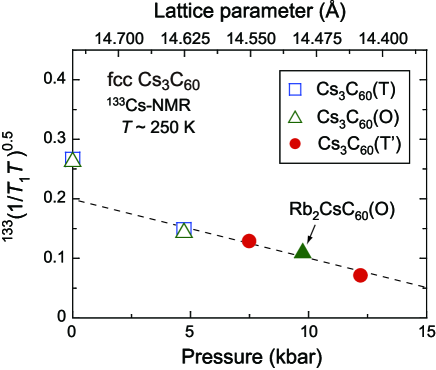
Finally, on the basis of the present results and considering the spatial phase separation due to in the fcc Cs3C60 crystal, we present a new phase diagram of fcc Cs3C60 using the unit cell volume () at room temperature. In Fig. 5, we plot the pressure dependences of 133(1/)0.5 [ for paramagnetic metal] for the T, O, and T′ sites of fcc Cs3C60 and for the O site of Rb2CsC60 (ref. 17). Here, the previous structural study has revealed that the unit cell volume for fcc Cs3C60 decreases linearly with the compressibility = 0.0053/kbar at 10 kbarGanin . From this relation, compared with the lattice parameter of 14.752 for our fcc Cs3C60 crystal at = 0, that the lattice parameter of 14.493 for Rb2CsC60 (ref. 15) corresponds to the lattice parameter for our fcc Cs3C60 at = 9.7 kbar. Meanwhile, using eq. (2), we obtained an exact match in the pressure dependence of 133(1/)0.5 for the T and O sites. Notably, offsetting the Cs3C60 (T′) data by = 7.5 kbar will make all data points fall on a straight line above 5 kbar. This evidences that the Mott-insulating Cs3C60 (T) phase becomes metallic above 5kbar, where holds. The deviation from a linear relation at = 0 is due to the development of antiferromagnetic fluctuations that lead to the Mott state. From Fig. 5 and using = 0.0053/kbar, we estimate the lattice parameters of the Cs3C60 (T) and Cs3C60 (T′) phases under pressure. The lattice parameter of the Cs3C60 (T) phase at = 4.7 kbar is 14.628 . Since the Cs3C60 (T′) phase at = 0 corresponds to the Cs3C60 (T) phase at = 7.5 kbar, the lattice parameter of the Cs3C60 (T′) phase at = 0 ( = 4.7 kbar) is estimated to be 14.554 (14.426 ).

Figure 6 shows a new phase diagram for fcc Cs3C60. and vs unit cell volume at room temperature are plotted with the magnitude of 1/ indicated in brightness. Superconductivity is only seen for the paramagnetic metal [dark (blue in color) region], where the Korringa law (1/ = const.) is well established in the entire temperature range. Antiferromagnetic fluctuations due to the localization of electron spins in C60 balls are found in a limited region [bright (yellow in color) region]. The ground states of both antiferromagnetic insulator (Mott state) and superconductivity are completely separated. This phase diagram is fundamentally different from those of heavy-fermion compounds, high- copper oxides, two-dimensional organic conductors, and iron-pnictides. Namely, the superconductivity in fcc Cs3C60 breaks up at the Mott transition. Preventing the localization of electrons on C60 balls is rather essential for Cooper pair formation and for finding still higher in this system.
Although the Cs3C60 (T) phase was observed in previous works, we find for the first time that it does not become superconducting at = 4.7 kbar where the partial superconducting transition is observed. Furthermore, the observed phase separation into the Mott state and paramagnetic metal can reasonably explain the unresolved issues in Cs3C60, the reason (1) why shielding fraction depends on pressure and (2) why antiferromagnetism and superconductivity can ”coexist” under pressure.
V Conclusions
In this paper, we have presented a 133Cs-NMR study of face-centred cubic structured fulleride Cs3C60 under pressure. Different from previous reports, we find that Cs3C60 crystals show a phase separation between the Mott state and the paramagnetic metal. Our results indicate that the pressure-induced superconductivity in Cs3C60 is realized only for a paramagnetic metal. The phase diagram obtained from the present NMR study strongly indicates that the Mott state and superconductivity are competing orders. The prevention of the localization of electron spins on C60 balls is rather essential for finding further higher superconductivity in fullerides.
Acknowledgements.
We thank Takashi Kambe for providing the Cs3C60 samples. S.K. thanks Y. Ihara and K. Ishida for useful discussion. The X-ray diffraction patterns were partly measured in research projects (2007G612) of KEK-PF. This work was supported in part by research grants from MEXT (Nos. 22103004, 22013012, 22740232, and 23102717).References
- (1) M. Capone ., Rev. Mod. Phys. 81, 943 (2009).
- (2) A. Y. Ganin ., Nat. Mater. 7, 367 (2008).
- (3) Y. Takabayashi ., Science 323, 1585 (2009).
- (4) A. Y. Ganin ., Nature 466, 221 (2010).
- (5) N. D. Mathur ., Nature 394, 39 (1998).
- (6) P. A. Lee, N. Nagaosa, and X. G. Wen, Rev. Mod. Phys. 78, 17 (2006).
- (7) K. Kanoda, J. Phys. Soc. Jpn. 75, 051007 (2006).
- (8) A. Ardavan ., J. Phys. Soc. Jpn. 81, 011004 (2012).
- (9) Y. Kamihara ., J. Am. Chem. Soc. 130, 3296 (2008).
- (10) T. Oka ., Phys. Rev. Lett. 108, 047001 (2012).
- (11) Y. Iwasa and T. Takenobu, J. Phys. Condens. Matter 15, R495 (2003).
- (12) Y. Ihara ., Phys. Rev. Lett. 104, 256402 (2010) and its supplemental material.
- (13) Y. Ihara ., Europhys. Lett. 94, 37007 (2011).
- (14) A. F. Hebard ., Nature 350, 600 (1991).
- (15) R. M. Fleming ., Nature 352, 787 (1991).
- (16) K. Tanigaki ., Nature 352, 222 (1991).
- (17) V. A. Stenger ., Phys. Rev. Lett. 74, 1649 (1995).
- (18) C. H. Pennington and V. A. Stenger, Rev. Mod. Phys. 68, 855 (1996).
- (19) A. C. Larson and R. B. Von Dreele, Los Alamos National Laboratory Report LAUR, 86-748 (2000).
- (20) P. Jeglič ., Phys. Rev. B 80, 195424 (2009).
- (21) K. Murata ., Rev. Sci. Instrum. 68, 2490 (1997).
- (22) R. E. Walstedt ., Nature 362, 611 (1993).
- (23) K. Gorny ., Phys. Rev. Lett. 79, 5118 (1997).
- (24) Y. Maniwa ., Solid State Commun. 82, 783 (1992).
- (25) H. Alloul ., Physica C 235-240. 2509 (1994).
- (26) G. Zimmer ., Phys. Rev. B 53, 5620 (1996).
- (27) B. O. Skadtchenko ., Chem. Mater. 17, 1467 (2005).
- (28) M. Apostol ., Solid. State. Commun. 98, 253 (1996).
- (29) P. Matus ., Phys. Rev. B 74, 214509 (2006).
- (30) C. H. Pennington ., Phys. Rev. B 54, R6853 (1996).
- (31) Y. Ihara, private communication.
- (32) E. Dagotto, T. Hotta, and A. Moreo, Phys. Rep. 344, 1 (2001).
- (33) S. Kawasaki ., Phys. Rev. Lett. 91, 137001 (2003).
- (34) Z. Li ., Phys. Rev. B 86, 180501(R) (2012).
- (35) A. Abrikosov and L. P. Gor fkov, Zh. Eksperim. i Teor. Fiz. 39, 1781 (1960).
- (36) V. Buntar ., Phys. Rev. B 72, 024521 (2005).