Calibrating [OII] star-formation rates at z1 from dual H-[OII] imaging from HiZELS
Abstract
We investigate the relationship between H and [O II]() emission in faint star-forming galaxies at with dust uncorrected star formation rates (SFRs) down to 1.4 M⊙ yr-1, using data in two narrow-bands from WFCAM/UKIRT and Suprime-Cam/Subaru. A stacking analysis allows us to investigate H emission flux from bright [O II] emitters as well as faint ones for which H is not individually detected, and to compare them with a large sample of local galaxies. We find that there is a clear, positive correlation between the average H and [O II] luminosities for [O II] emitters at , with its slope being consistent with the local relation. [O II] emitters at have lower mean observed ratios of H /[O II] suggesting a small but systematic offset (at significance) towards lower values of dust attenuation, , than local galaxies. This confirms that [O II] selection tends to pick up galaxies which are significantly less dusty on average than H selected ones, with the difference being higher at than at . The discrepancy of the observed line ratios between [O II] emitters at and the local galaxies may in part be due to the samples having different metallicities. However, we demonstrate that metallicity is unlikely to be the main cause. Therefore, it is important to take into account that the relations for the dust correction which are derived using H emitter samples, and frequently used in many studies of high- galaxies, may overestimate the intrinsic SFRs of [O II]-selected galaxies, and that surveys of [O II] emission galaxies are likely to miss dusty populations.
keywords:
galaxies: high-redshift – galaxies: evolution.1 Introduction
Star formation rate (SFR) is one of the most important properties to characterise the growth of a galaxy, and the star formation history of the Universe provides us with a fundamental insight into galaxy evolution. Several surveys have been conducted to reveal the star formation activity in the distant Universe by making use of various indicators such as ultraviolet (UV) luminosity, nebular emissions such as H and [O II](), and infrared (IR) radiation. These have been used to estimate SFR of galaxies over a wide range of redshifts; e.g., UV: Ouchi et al. (2009); Bouwens et al. (2011), nebular lines: Shioya et al. (2008); Ly et al. (2007); Ly et al. (2011); Geach et al. (2008); Sobral et al. (2009); Sobral et al. (2012a, b), IR: Pérez-González et al. (2005); Wardlow et al. (2011); Magnelli et al. (2009); Magnelli et al. (2012); Goto et al. (2010). Such surveys have revealed that the redshift range 1–3 is an essential and intriguing era for the study of galaxy formation and evolution, since star formation rate density (SFRD) in the Universe gradually increases toward from 6, has a peak at 1–2, and decreases sharply from toward (e.g., Madau et al., 1996; Hopkins & Beacom, 2006; Sobral et al., 2012b). The H luminosity is widely used to derive the star formation activity of galaxies at , but other emission-lines at the bluer end of the galaxy spectral energy distribution, such as the [O II] line, are also sufficiently bright to be widely used and can be employed up to , after being calibrated relative to H . The H emission line is a robust star formation indicator which has been well-calibrated with data in the local Universe (e.g., Kennicutt, 1998), and is significantly less affected by dust extinction than bluer emission lines, such as [O II]. However, the H line is redshifted into near-infrared (NIR) wavelengths for galaxies at , while the [O II] line can be observed with an optical instrument until , and thus many studies/surveys of star-forming galaxies at rely on [O II] luminosity. Unfortunately, while [O II] luminosity is in general correlated with the star formation activity, it is also dependent on the metal abundance and the ionization state of nebular gas. The indirect relation with the star formation activity complicates the estimation of SFR from [O II] luminosity. Nevertheless, it is empirically calibrated and extensively utilised as a important SFR indicator for galaxies at (e.g., Kennicutt, 1998; Moustakas et al., 2006; Gilbank et al., 2010).
In order to better relate the [O II] luminosity of a galaxy to its SFR, one can study the ratio of [O II] to H luminosities in local star-forming galaxies. However, it is not obvious that these calibrations can be blindly applied for galaxies at higher redshifts. It is therefore important to investigate their validity at earlier epochs in the Universe by studying higher redshift galaxies directly. According to recent studies, the [O II]/H ratio of galaxies up to is on average consistent with that of local galaxies (Moustakas et al., 2006; Weiner et al., 2007). Sobral et al. (2012a) investigated the [O II]/H ratio for star-forming galaxies at by using wide-field, deep imaging with two narrow-band filters which can catch H and [O II] emission from galaxies simultaneously. This study finds relatively little evolution in the line ratio when compared to lower redshift. However, the detection of both emission lines for galaxies at is limited to relatively luminous galaxies with H luminosity larger than erg s-1 (i.e., SFR 10 M⊙ yr-1), and little is known about the line ratio and nature of the more numerous fainter star-forming galaxies. Fortunately, the [O II] data obtained with the Subaru telescope can reach significantly lower luminosities in [O II] and, using a stacking analysis, the [O II]/H line ratio can now be studied down to galaxies with significantly lower SFRs.
The structure of this paper is as follows. The data used in this paper are described in § 2. The stacking analysis procedure and the results from the stacked images are shown in § 3. In § 4, we show the ratios of H to [O II] luminosities for galaxies at , and compare them with those of local galaxies. We then discuss their implications with respect to the evolution in dust extinction and metallicity of [O II]-selected galaxies at . Our conclusions are presented in § 5. Throughout this paper, magnitudes are presented in the AB system, and we adopt cosmological parameters of , and .
2 Observations and selection
The bulk of the data used in this paper have been obtained as part of the High Redshift Emission Line Survey (HiZELS) targeting H (Geach et al., 2008; Sobral et al., 2009; Best et al., 2010), and as part of a matched [O II] follow-up survey (Sobral et al., 2012a, b). The details of the data are described in two papers by Sobral et al. (2012a, b), and therefore we only summarise them briefly here.
2.1 H and [O II] emitters at
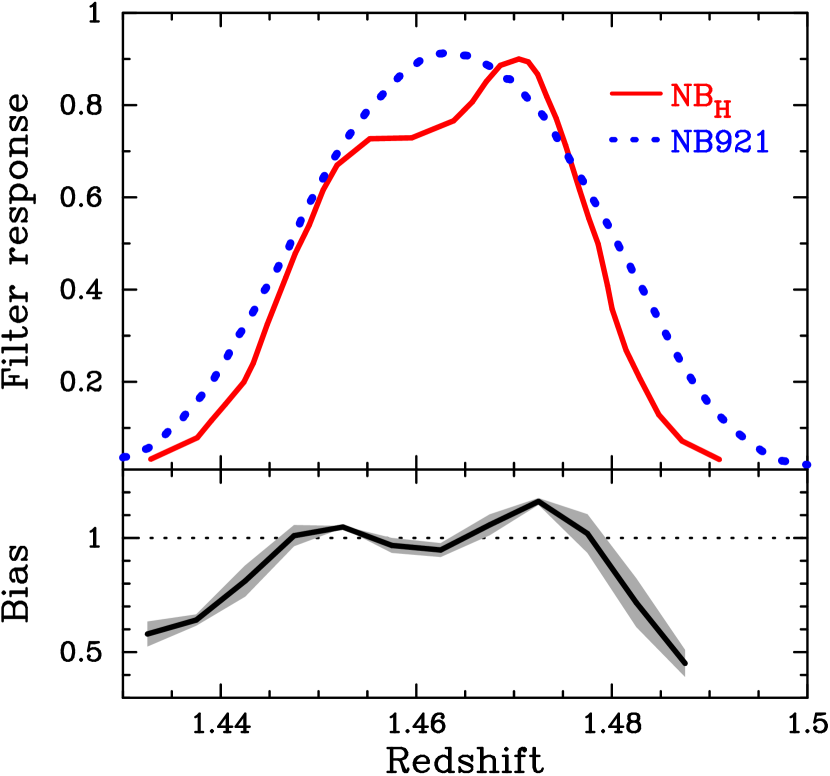
We use two narrow-band imaging datasets to obtain our samples of galaxies at in two distinct square degree areas: the UKIDSS Ultra Deep Survey (UDS: Lawrence et al., 2007) and the Cosmological Evolution Survey (COSMOS: Koekemoer et al., 2007; Scoville et al., 2007) fields. NBH narrow-band data (µm and µm) were taken with the wide-field camera (WFCAM; Casali et al., 2007) on UKIRT, while NB921 narrow-band data (Å and Å) were taken with Subaru prime focus camera (Suprime-Cam; Miyazaki et al., 2002) on the Subaru Telescope (Figure 1). Combining with broad-band imaging data in and which cover the same wavelength range as the individual narrow-bands, to estimate the continuum level of the spectrum underlying the emission line, the narrow-band imaging can measure H and [O II] emission, simultaneously, for galaxies at (Sobral et al., 2012a, b).
The NBH and images in the UDS field cover an effective area of 0.78 deg2 where the regions with bad quality caused by cross-talk and bright stars are masked, while the images in the COSMOS field have an effective area of 1.6 deg2. The 5 limiting magnitudes in NBH are 22.1 and 21.9 in the UDS and COSMOS fields, respectively, although the depth is slightly dependent on the position (see Figure 2 and Table 2 in Sobral et al. (2012b) for the details).
The NB921 data in UDS field are drawn from the archive of Suprime-Cam (Ouchi et al., 2010) and reduced as described in Sobral et al. (2012a), while public data are available for (Furusawa et al., 2008). In the COSMOS field, the NB921 data were taken in service mode with the Subaru telescope in December 2010 (Sobral et al., 2012b), and they cover 69% of the region where the NBH and data are available (i.e., 1.1 deg2). The 5 limiting magnitudes in NB921 are 25.8 and 24.0 in the UDS and COSMOS fields, respectively.
Catalogues of H emitters at in both the UDS and COSMOS fields are presented in Sobral et al. (2012b). They include 188 H emitters in the UDS down to an H flux of erg s-1 cm-2 (which corresponds to an H luminosity (LHα/erg s-1)=41.78 if the galaxies are at ) and 325 H emitters down to erg s-1 cm-2 ((LHα/erg s-1)=41.56) in the COSMOS field, respectively. The number densities of the H emitters are 6.7 and 8.2 arcmin-2 above the flux limits in UDS and COSMOS fields, respectively.
The catalogues of [O II] emitters at are updated from those of Sobral et al. (2012a). Emission line galaxies are selected as galaxies with colour excess larger than 5 (i.e., ) and equivalent width (EW) larger than 25Å, which corresponds to EWÅ in rest frame at , where photometry is conducted with 2″ diameter aperture. Then, [O II] emitters at are identified based on the colours, photometric redshift, and spectroscopic redshift (c.f. Sobral et al., 2012b). We note that the spectroscopic redshift information indicates that a significant number of galaxies at , selected as narrow-band emitters due to strong Balmer/4000Å break, are incorrectly included as [O II] emitters. However, most of these contaminants are removed from the sample by filtering out galaxies with EWÅ . Thus, the numbers of [O II] emitters selected are 2735 down to erg s-1 cm-2 ((L[OII]/erg s-1)=40.76) in the UDS field, and 718 down to erg s-1 cm-2 ((L[OII]/erg s-1)=41.24) in the COSMOS field, respectively. The number densities of the [O II] emitters are 0.97 and 0.18 arcmin-2 above the flux limits in the UDS and COSMOS fields, respectively.
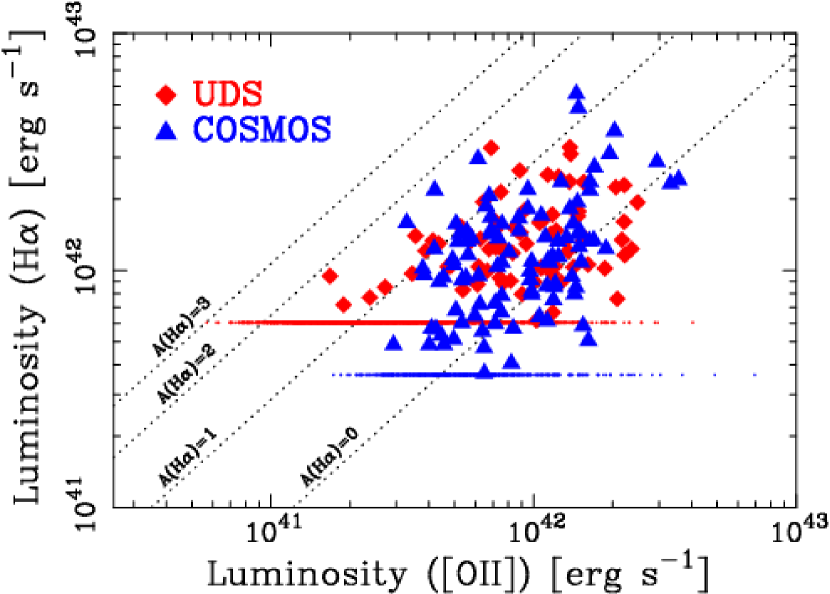
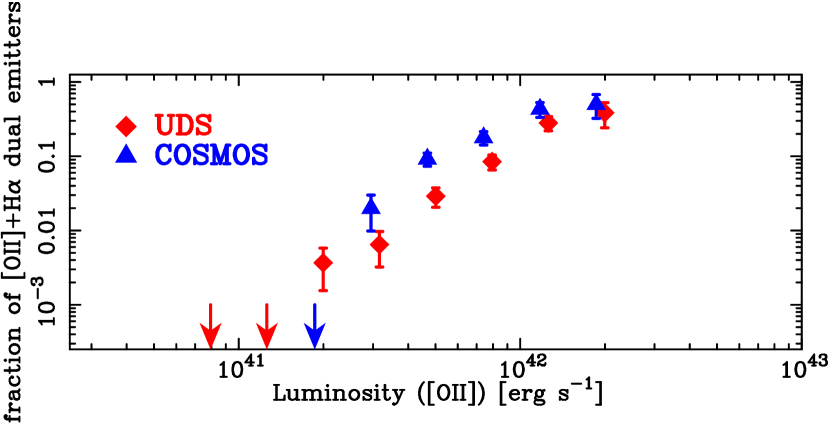
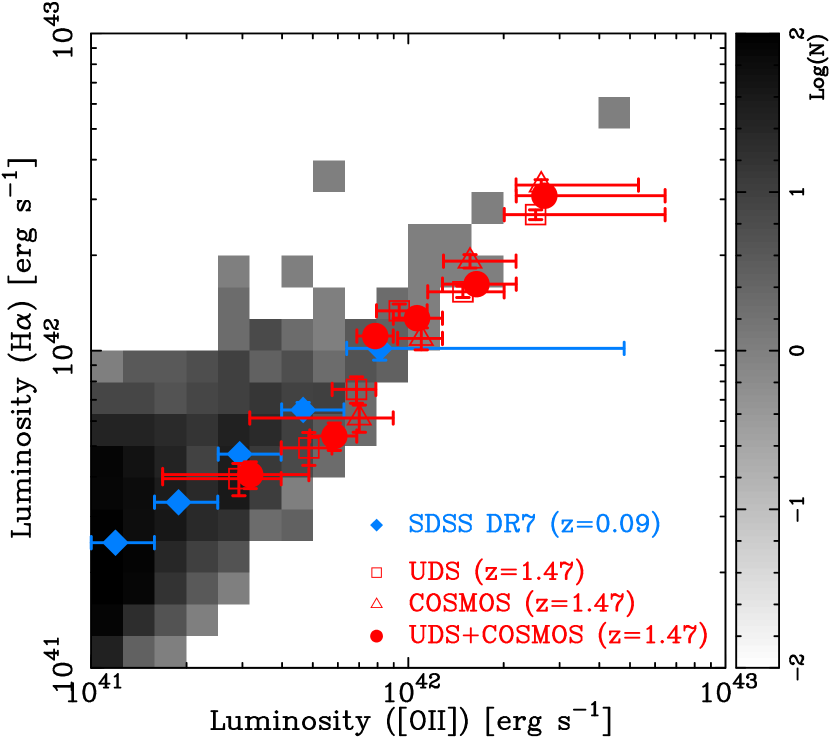
By matching the [O II] emitters with the H emitters, Figure 2 shows the relation between [O II] and H luminosities for the [O II] emitters in both the UDS and COSMOS fields, and the fraction of [O II] emitters with a significant H emission detection as a function of [O II] luminosity. As described in §1, the dual emitters with detections in both [O II] and H are mainly limited to galaxies with [O II] luminosities higher than erg s-1. For [O II] emitters with [O II] luminosities lower than erg s-1, the fraction is less than , clearly showing that we can only investigate the relation between [O II] and H luminosities individually for a small fraction of faint [O II] emitters.
2.2 Differences between the profile of the two narrow-band filters
Although the NBH and NB921 filters are well matched and enable us to detect both H and [O II] emission lines from individual star-forming galaxies at , there is a slight difference in the redshift coverage (Figure 1). The redshift coverage for [O II] lines detected by NB921 filter is a slightly wider than that by NBH filter. It is possible that this difference causes us to underestimate the H luminosity for [O II] emitters at redshifts corresponding to the edge of NBH filter where the transmission is lower than that of NB921. To quantitatively evaluate how accurately the H /[O II] line ratio can be measured by the two narrow-band images and how this effect may influence the results of the stacking analysis, a simulation was conducted following Sobral et al. (2012a) (see §4.5 of their paper for more details). In summary, we make a sample of galaxies at 1.40–1.52 with intrinsic line ratios between 0 and 2.0, where the distribution of [O II] luminosity that galaxies have is based on the [O II] luminosity function, and then investigate the measured H /[O II] line ratios with the two NB filters. Figure 1 also shows the result of the simulation: the bias (i.e., the difference between a measured H /[O II] and an input H /[O II] ratio) is distributed around unity in most of the range of the filter profile, although in the edge of the profile the observed line ratio is biased towards lower values. However, we make sure that the average value of bias is fairly close to unity. Because we focus on the average ratio of H /[O II] by a stacking analysis in this paper, the slight difference of filter profile has only a small effect on the results over the whole investigated range of [O II] luminosity. To further quantify this, we investigate the bias values for galaxies with a given range of observed [O II] luminosity similar to luminosity bins shown in Table LABEL:tbl;OII; we find that the [O II]-selected galaxies have a redshift distribution peaking at and with most sources having redshifts where the filter response is high, leading to an average value of the bias of 0.97 in all bins, namely close to unity again. Thus, although the H /[O II] ratio can be underestimated by 3% (which we correct for), we conclude that the difference of the profiles in the two NB filters gives no significant influence on the results we find in this paper.
2.3 Stellar mass for emitters at
Stellar masses are estimated by an SED-fitting method for H and [O II] emitters at in both fields consistently (Sobral et al. in preparation). The details of the procedure in the SED-fitting are described in Sobral et al. (2011). The SED templates are created with the stellar population synthesis model by Bruzual & Charlot (2003) and Bruzual (2007) under the assumption of a Chabrier (2003) initial mass function (IMF) and a range of exponentially declining star formation histories. In addition, the dust extinction law of Calzetti et al. (2000) is used in the SED-fitting. Note that we have confirmed that the mass estimates are robust against the contribution of emission lines to the broad-band photometry, as they are based to fits to photometric bands and hence line contamination in one or two bands does not have a strong influence. Among [O II] emitters, stellar masses are derived for 2708 (99.0% of the sample) and 706 (98.3%) [O II] emitters in the UDS and COSMOS field, respectively. The others, i.e., of the samples, do not have reliable stellar mass due to large errors in photometry and/or non-detection in most bands, suggesting that such [O II] emitters are likely to be less massive galaxies. Galaxies for which the SED fitting fails are found to be very faint in the rest-frame optical (i.e., -band), which supports the indication that they are likely to be low-mass galaxies. In this paper, we restrict analysis to [O II] emitters with stellar masses larger than (M⋆/M⊙)=9.5. This mass cut is made in order to maximise the number of [O II] emitters included in the sample, but without picking up many lower mass galaxies for which the survey becomes incomplete. In addition, the SDSS sample described below, which is used for the comparison of galaxies at with local galaxies, is also highly complete above this mass limit. After applying the mass cut, the numbers of [O II] emitters are 643 and 212 in the UDS and COSMOS fields, respectively.
2.4 A comparison sample of galaxies at
We also use SDSS DR7 data to compare the results obtained for [O II] emitters at with local galaxies (Abazajian et al., 2009). Galaxies in the redshift range of 0.07–0.1 are extracted from the SDSS spectroscopic catalogue. This redshift range is chosen so that the galaxies have small enough apparent angular sizes that most of their light is included in the fibre whilst guaranteeing that the sensitivity is still very high. An aperture correction on the emission line luminosities is still required, since the spectroscopic measurements are done with 3″-diameter fibres. The fractional flux loss from the fibre is estimated from the ratio of total mass to fibre mass according to the same procedure adopted in Sobral et al. (2012a). Moreover, note that the SDSS spectrophotometric calibration takes account of any wavelength dependence of the seeing, so the emission line flux ratios are also unaffected by this (Adelman-McCarthy et al., 2008).
By applying our selection criteria, we have selected 8285 SDSS galaxies with (L[OII]/erg s-1)41 and EWÅ. Among these, only galaxies with detected H emission are used. However, we note that all but 38 (0.46%) galaxies have H line detected, implying that the removal of galaxies without H detection gives no significant bias in the study of H /[O II] line ratios. We are aware that the SDSS spectroscopic sample is magnitude-limited, i.e. roughly mass-limited. However, as described in §2.3, the criterion of (M⋆/M⊙)9.5 is applied to both the SDSS sample and the [O II] emitter samples at so that high completeness is kept above the mass limit for both samples; this was another factor driving our choice of redshift range for the SDSS sample. After applying our mass limit we obtain our SDSS sample, which contains 7271 galaxies.
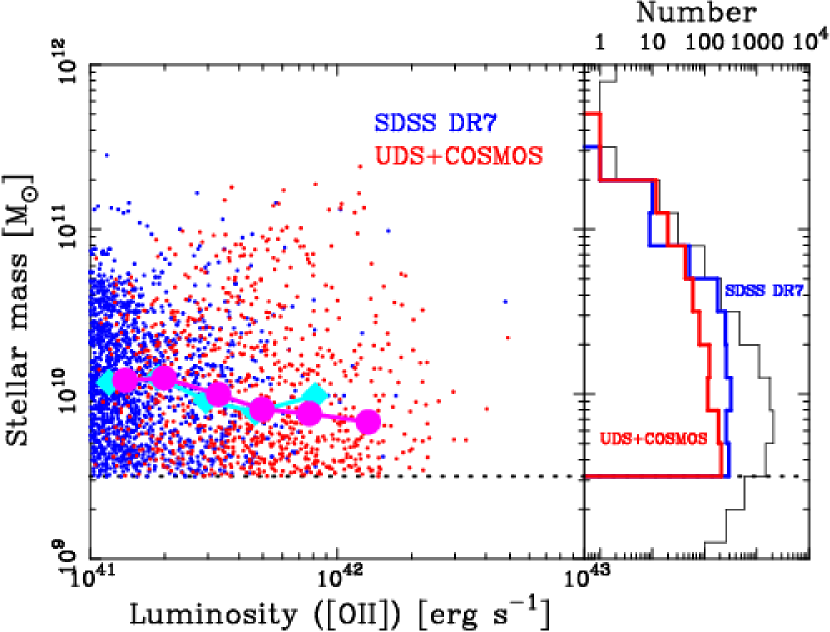
The SDSS sample is used to compare the H /[O II] ratios of [O II] emitters at with those of local galaxies at =0.07–0.1 in §§3 and 4. We therefore must assure that both samples are fully comparable and that differences between them are not arising from a different distribution in e.g. stellar mass. Since correlations between SFR and stellar mass have been claimed at (e.g., Daddi et al., 2007), it is possible that [O II] luminosity as well as H luminosity and metallicity are also correlated with stellar mass for the [O II] emitter samples. We thus use the SDSS sample to construct a sample of local galaxies with a similar distribution of mass to that of [O II] emitters at in order to reduce any mass-dependent bias on this study and so allow a robust comparison. Galaxies in the SDSS sample are selected at random so that the mass distribution is the same as that of [O II] emitters at in each bin of [O II] luminosity as shown by Figure 3. The SDSS sample tends to include galaxies with fainter [O II] luminosity, while [O II] emitters at have brighter luminosity. Since the mass distribution is dependent on the [O II] luminosity, the histograms of stellar mass for all galaxies in each sample are not in perfect agreement. However, the median masses in each luminosity bin are in good agreement (Figure 3). In the following sections, we use the matched SDSS sample containing 1656 galaxies at =0.07–0.1 to compare with the results for [O II] emitters at .
3 Analysis and results
In order to investigate the relation between H and [O II] luminosities for galaxies at , we stack and average the NBH images from which the corresponding image is subtracted (clipping the pixels which deviate more than 3), and then estimated the average H flux for [O II] emitters at in the UDS and COSMOS fields. Note the results do not change if a median stacking is carried out instead.
3.1 Stacking method
For all the samples of galaxies to be stacked, a 80″80″ region around individual galaxies is extracted from both NBH and images. Some galaxies are rejected from each sample, because they are found in masked regions in the NBH image, where some artefacts and regions with low quality caused by bright/saturated stars are seen. Then, the zero point of magnitude and the point spread function (PSF) are matched between the NBH and images for individual galaxies. The original NBH and images are scaled to have same zero point of magnitude. We note that Sobral et al. (2012b) show that small colour-corrections in (–NBH) colour are required to trace the underlying continuum level and estimate emission line flux correctly, simply because the NBH filter is not in the centre of the -band. We thus performed the correction using the () colour according to Sobral et al. (2012b). The PSF in the original NBH image has a FWHM of ″, while that in the image has FWHM of ″. The NBH PSF is therefore degraded to match the -band seeing by the convolution of a Gaussian kernel. After performing these corrections for the zero point of magnitude and PSF, (NBH–) images are created by the subtraction of the image from the NBH image.
The individual (NBH–) images are averaged together to make the stacked (NBH–) image for each sample. The photometry is calculated at the centre of the stacked image with various apertures ranging from 2.0″ up to 6.0″ diameter. We note that the photometry with 4.8″ diameter aperture is found to recover the total flux of the emission line on the stacked image, and then the (NBH–) colour is converted into an emission line flux. Tuned aperture sizes could in principle be dependent on the emission line flux, but we do not find the significant dependence between the size and the luminosity. Thus, we use a common aperture with 4.8″ diameter to measure the total fluxes in all samples. We also note that both H and [N II] emission lines can contribute to this emission flux, but no information of [N II] flux for individual emitters is available. Therefore, we corrected for the contribution of [N II] flux by assuming that [N II]/H ratio of the emitters is 0.22 (Sobral et al., 2012a).
The [N II]/H ratio is known as a indicator of metallicity, and thus it is probably dependent on the stellar mass. Indeed, we find for the SDSS galaxies that the [N II]/H line ratio correlates with stellar mass more strongly than with H or [O II] luminosities. Our samples include the emitters with a wide range of stellar mass, but the median stellar mass in each sample only varies by a factor of four, from M⊙ to M⊙. According to the mass–metallicity relation that Yabe et al. (2012) have found for star-forming galaxies at , these median stellar masses correspond to the [N II]/H ratios of 0.14–0.25, which are comparable to or slightly lower than the value we assumed. Even if the lowest ratio of [N II]/H =0.14 is used instead, the H luminosities would be increased by only a factor of 1.07. It should be noted that the assumption of constant typical value of [N II]/H is reasonable, since average H luminosities are derived in this study (see also Figure 4).
Contamination in the [O II] emitter samples would lead to the H fluxes measured on the stacked images being underestimated, since the images without H flux for the contaminants are also stacked. Although the bulk of the contaminants are removed using spectroscopic and photometric redshifts and colour cuts (§2.1), some contamination will remain. Using the spectroscopically confirmed NB921 emitters, and accounting as best as possible for biases in the selection of spectroscopic targets, the residual rate of the contamination is estimated to be around 157%. More specifically, it is found that the [O II] emitter sample could include % contaminations at and % ones at (most of which are galaxies with a strong Balmer/4000Å break at ). We have also found that there is no clear trend of the contamination rate with emission line flux. Thus, a correction for our best-estimate of the contamination, 15%, is applied to the stacked fluxes for the [O II] emitter samples in an attempt to account for this.
AGNs may be included in our emitter samples as contaminants. However, galaxies hosting a strong type-1 AGN, with their SED dominated by AGN light, are likely to fail in our SED fitting procedure because our code does not include an AGN template SED; they will thus be excluded from our analysis as only galaxies well-fitted by galaxy SED templates are used. Galaxies hosting an obscured type-2 AGN may be included as they can be fitted with galaxy SED templates. However, such type-2 AGNs usually have a H /[O II] ratio above unity (e.g., Cid Fernandes et al., 2010), and so any AGN contamination in the z=1.47 [O II] samples would, if anything, bias the stacked H flux upwards, making the underlying trend found in Section 3.2 even stronger.
To estimate the error in the flux measured on the stacked image, 10,000 identical apertures are distributed at random across blank sky region around the galaxy, and then the 1 error is derived by fitting a Gaussian profile to the histogram of the sky counts.
3.2 Stacking analysis for the emitter samples
| [O II] luminosity | Number | H luminosity | flux ratio |
|---|---|---|---|
| (erg s-1) | (erg s-1) | (H /[O II]) | |
| 42.43 | 61 | 42.40 | 1.150.35 |
| 42.22 | 127 | 42.13 | 0.990.16 |
| 42.03 | 125 | 42.02 | 1.190.13 |
| 41.90 | 126 | 41.96 | 1.410.13 |
| 41.77 | 124 | 41.65 | 0.920.13 |
| 41.50 | 246 | 41.53 | 1.280.37 |
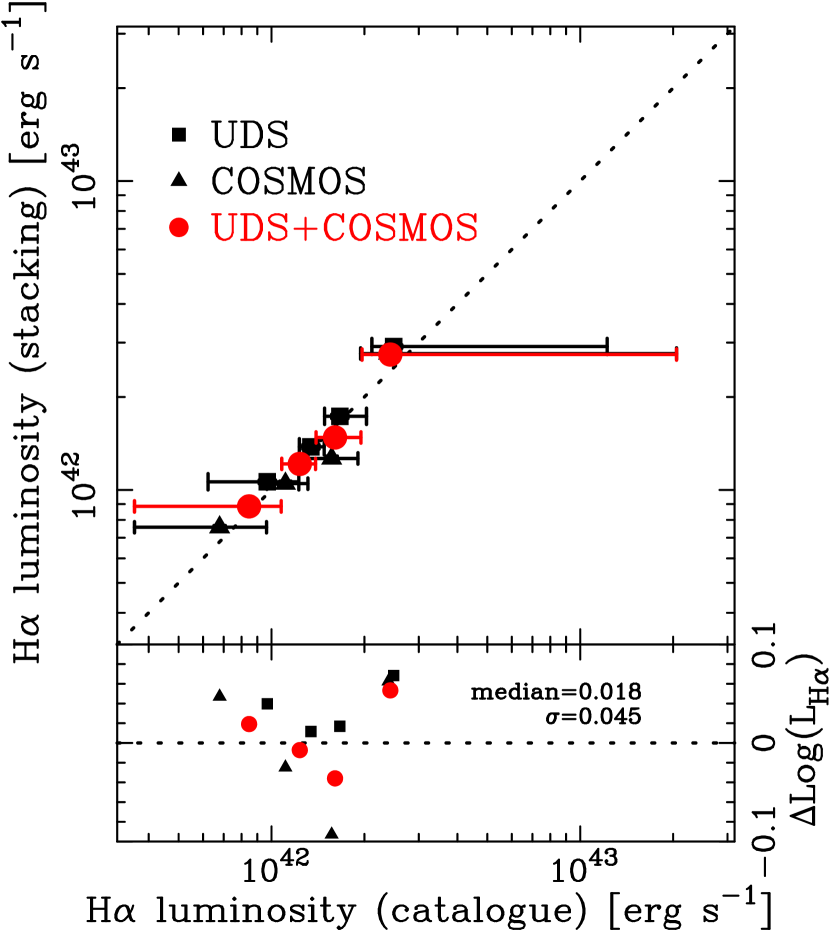
Samples of galaxies to be stacked are created from the H or [O II] emitters in the UDS and COSMOS fields by dividing them on the basis of their emission line luminosities, so that they contain nearly equal numbers of galaxies. However, the number of galaxies for the sample in the brightest (faintest) luminosity bin is smaller (larger) than the other samples. The stacking analysis was conducted firstly for H emitter samples. The analysis for galaxies with H emission detected individually enables us to check our stacking analysis by comparing our results with individually measured H luminosities. Figure 4 shows the comparison between median H luminosity drawn from the catalogues for each H emitter sample and that measured on the stacked image. The median and standard deviation of (LHα/erg s-1), the difference between both H luminosities, are 0.018 and 0.045, respectively. The good agreement shows that our procedure in the stacking analysis recovers well the average of actual individual measurements. We then moved on the stacking analysis for samples of [O II] emitters which are classified on the basis of their [O II] luminosities.
Figure 5 shows the average H luminosities of galaxies at in the individual fields of UDS, COSMOS and the combination of the two, as a function of their [O II] luminosity (see also Table LABEL:tbl;OII). The H luminosity is estimated from the stacked NBH – image with a 4.8″aperture (§3.1), and the [O II] luminosity is a median value of individual [O II] luminosities of emitters in the sample which are derived from NB921 imaging. It should be noted that we apply an aperture correction to the [O II] luminosities in order to ensure a matched comparison with the H luminosities. We obtain this correction by comparing the 2″ photometry (Sobral et al., 2012a, b) and that obtained with 4.8″apertures on the stacked NB921– images. We find that a correction of 1.6 is required to recover total stacked luminosities. Also, the H luminosities are corrected by 3% for the bias caused by the difference of profile of the two narrow-band filters (§2.2) and by 15% for the possible contamination of emitters at different redshifts that might be included in the sample (§3.1).
There is a clear positive correlation between the mean [O II] and H luminosities, with almost constant luminosity ratio for [O II] emitters at . This fact suggests that the [O II] luminosity can be easily calibrated as a SFR indicator for galaxies with SFRs down to 1.4 M⊙yr-1, even at . The distribution of local galaxies extracted from the SDSS sample is also shown in the figures, and the median H luminosities are plotted in each [O II] luminosity bin. For [O II] emitters with a given [O II] luminosity, H luminosities are on average lower than those of local galaxies, implying that the ratio of H to [O II] is different between local galaxies and [O II] emitters at . To evaluate the statistical significance of the difference in H /[O II] ratio, we compare the H /[O II] ratios of [O II] emitters at with those of local galaxies, calculate how significantly the [O II] emitters at deviate towards a lower value from the local galaxies in each luminosity bin, and then combine these in quadrature (using equal weighting) to give a total offset significance. We find that there is an overall difference in the line ratio which is significant at the 2.8 level.
The systematic offset is intriguing. It is unlikely that the offset is caused by a difference in stellar mass, since the mass distributions of the two sample are matched to each other (§2.4). Possible systematic effects that might drive the offset are discussed in the next sub-section, but are unlikely to be able to account for all of the difference, suggesting a small but genuine cosmic evolution of the mean H to [O II] ratio.
3.3 Possibility of underestimation of H luminosity
One possible cause of bias towards low H luminosities for [O II] emitters at with a given [O II] luminosity is contamination in the [O II] emitter samples from emitters at different redshifts which are not removed by our spectroscopic redshift, photometric redshift and colour-colour selection cuts. As discussed in §3.1, a correction for the contamination, 15%, has already been applied to the stacked fluxes. If the upper limit to the contamination of 22% is the true contamination, then the calculated H luminosities for the [O II] emitters can be also underestimated by 7%.
Another possibility is that the contribution of [N II] emission is lower than what we assume in this paper as discussed in §3.1. This effect can result in the underestimation of H luminosity by 7% at most. Finally, there is a bias caused by the difference of profile of the two narrow-band filters (§2.2) which can lead to the H luminosities being underestimated in the wings of the filter profile. Our simulations have led us to apply a 3% correction factor for this, but these simulations assume a uniform redshift distribution for the [O II] emitters across the redshifts probed. If large-scale structure causes the [O II] emitters to be clustered at the low or high redshift end of the filter coverage, the true correction factor could potentially be a few percent higher.
In order for the H luminosities at to be comparable to those of galaxies at for a given [O II] luminosity, all of the effects that might potentially cause an underestimation of H luminosities would have to be at or above their maximal combined values of %. Thus, it is likely that the offset of H luminosities for galaxies with a given [O II] luminosity is real, and the H /[O II] ratios of [O II] emitters at seem to be shifted towards lower values than those of the local galaxies to some extent. In the next section, we discuss the implication of the different H /[O II] ratio in the properties of galaxies.
4 Discussion
4.1 Line ratios for the local galaxies
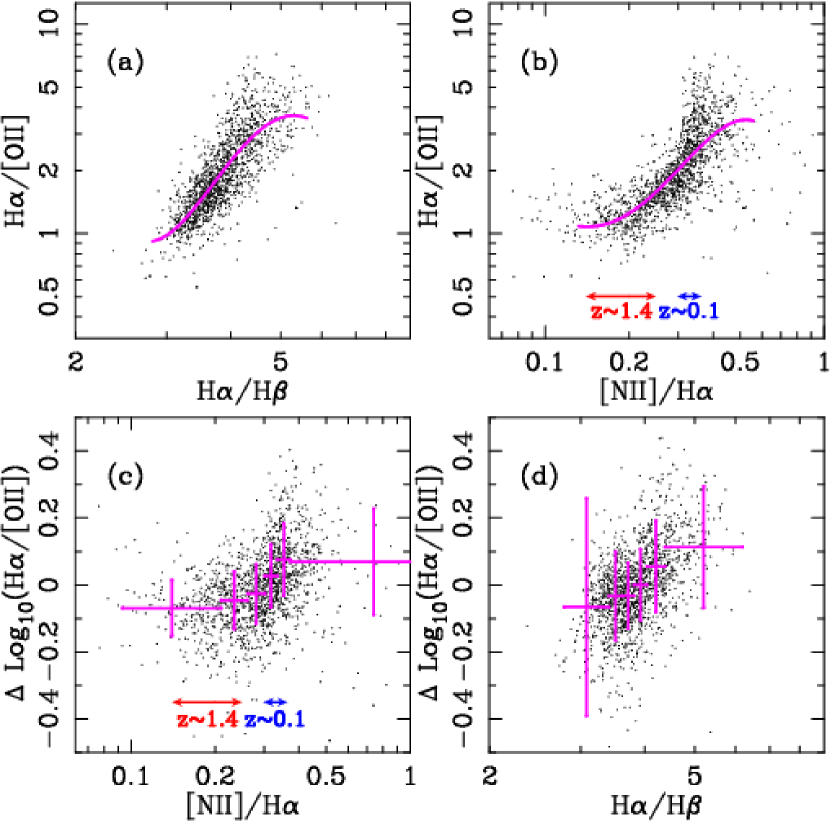
As discussed by Sobral et al. (2012a), H /[O II] ratios can be dependent on both dust extinction and metallicity, because the two factors both influence the [O II] luminosity more than the H luminosity. Therefore, before discussing the line ratios found in the previous section (Figure 5), the SDSS sample with matched mass distribution is used to evaluate how the two factors of dust extinction and metallicity relate to the ratio of H /[O II] and to understand which factors are main driver of the difference in the line ratio between [O II] emitters at and galaxies at . The Balmer decrement of H /H is an indicator of dust extinction, while the ratio of [N II]/H , the so-called N2 index, offers a rough estimator of metallicity. The H /[O II] ratios for the SDSS sample described in §2.4 are plotted as a function of H /H and [N II]/H in Figure 6, where a polynomial function of the fourth degree is fitted to the data. The figure implies that the ratio of H to [O II] is dependent on both factors in the sense that it increases with higher dust extinction and higher metal abundance.
It is natural to expect that the H /[O II] ratios are sensitive to dust, since a large amount of dust prevents more [O II] emissions at rest-frame 3727Å from escaping from the star-forming regions in a galaxy than H emissions at rest-frame 6563Å. On the other hand, the H /[O II] line ratio is also dependent on the metallicity as shown in Figure 6. According to the metallicities estimated from the mass-metallicity relations that recent studies have suggested, the figure suggests that the difference in metallicity between star-forming galaxies at and could account for an offset of (H /[O II])dex.
In reality, dust attenuation and metallicity are likely to be correlated. To investigate the independent effect of metallicity on the line ratio, Figure 6 also shows the offsets of H /[O II] ratio from the best fitted polynomial function shown in Figure 6, as a function of [N II]/H , i.e, metallicity. A weak correlation is seen in the sense that the offset of (H /[O II]) gets larger with increasing [N II]/H , although the dispersion is large. At fixed dust attenuation, the difference in metallicity between star-forming galaxies at and suggests an offset of at most dex in the mean value of (H /[O II]). This seems to suggest that the metallicity is not the major factor on the offset of the H /[O II] ratio. The same suggestion is also obtained with larger sample of SDSS data by Sobral et al. (2012a). In contrast, Figure 6 shows the offsets of H /[O II] ratio from the best fitted polynomial function shown in Figure 6, as a function of H /H . This figure suggests that the offset is larger with higher dust extinction and the dependence of the offset on the dust extinction seems to be stronger than the dependence seen in Figure 6 for metallicity, although dispersion is still large. This may suggest that dust extinction is the more important factor in changing the H /[O II] ratio.
4.2 Implications for dust extinction and metallicity
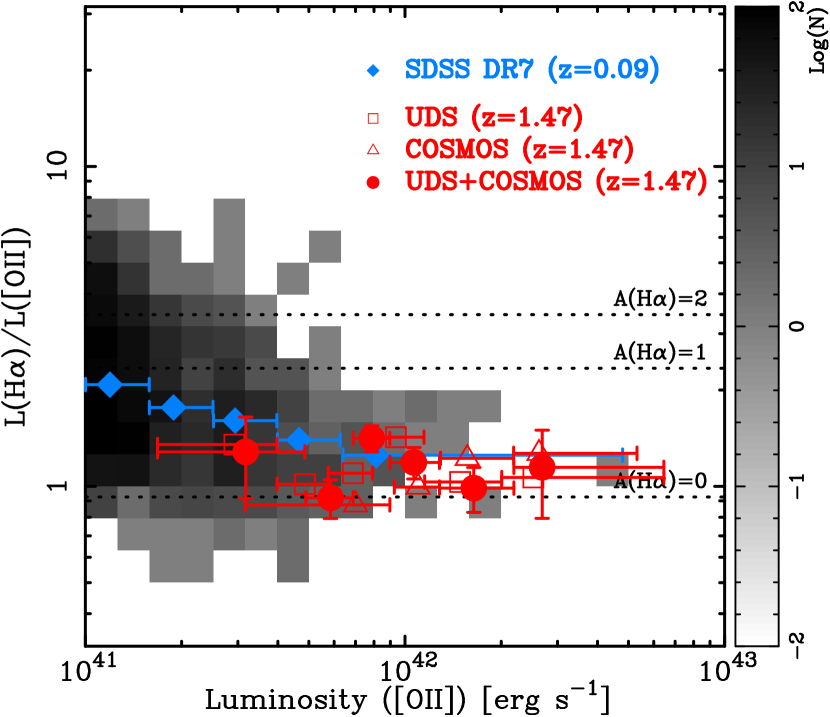
The average H /[O II] ratios are plotted in Figure 7 as a function of [O II] luminosity. We find that they shift slightly towards a lower value at significance than those of galaxies at . According to the results of Figure 6, the ratio of H /[O II] implies that the typical [O II] emitters at are not dusty, metal-rich galaxies. Moreover, it is unlikely that the metallicities of the [O II] emitters at deviate significantly from the mass-metallicity relation that Yabe et al. (2012) have found for galaxies at . That is, it seems that metallicity is not a main cause of the difference in the H /[O II] ratio, although we cannot completely rule out the possibility that the observed line ratios are in part dependent on the metallicity, as suggested by Figure 6. We thus discuss the line ratios in terms of the dust extinction.
The lines in Figure 7 show the H /[O II] line ratio under the assumption that the ratios are changed due to the amount of dust which is expressed as an attenuation in H , (the best-fitted polynomial function shown in Figure 6). In this case, all of the H /[O II] ratios for the [O II] emitters at are distributed around the line corresponding to 0.35, suggesting that [O II] emitters at are likely to be less subject to dust extinction. This result is not surprising at all, since [O II] emissions at rest-frame 3727Å should be sensitive to dust extinction. Although this is within expectations, it is important to directly confirm with nebular emissions that typical [O II] emitters are on average a less dusty population over the wide range of the luminosity down to erg s-1, i.e, SFR=1.4 M⊙yr-1 (Kennicutt, 1998) at high redshift of .
Moreover, Figure 7 suggests that local galaxies selected based on [O II] luminosity tend to be more subject to dust attenuation compared with [O II] emitters at . However, the amounts of dust attenuation are less than A(H )=1 (which is a typical value for H emitters) in almost all bins of [O II] luminosity. On the other hand, Sobral et al. (2012a) have found that H emitters at shows the average H /[O II] ratios consistent with those of the local galaxies with A(H )1. Thus, [O II] emitters are likely to have smaller amount of dust extinction on average than H emitters at both redshifts of and 1.47, and more interestingly, typical [O II] emitters at seem to be less dusty than those in the local Universe.
Recent [O II] emission surveys at have found that there are [O II] emitters with red colours comparable to red sequence on the colour–magnitude diagram. However, the fact that [O II] emitters at typically show little dust attenuation implies that the red [O II] emitters are likely to be passive galaxies with AGN activity in the core of galaxy, not dusty starburst galaxies. Indeed, we confirm that mean H /[O II] line ratios for [O II] emitters with ()2.2 are comparable to those for blue [O II] emitters by conducting the stacking analysis in the same manner as described above for the samples classified by the colours. These results support the similar conclusion on the population of red [O II] emitters found in the galaxy cluster (Hayashi et al., 2011) as well as those in lower redshifts (Yan et al., 2006; Lemaux et al., 2010; Tanaka et al., 2012). Moreover, the result we have found in this paper highlights that surveys of star formation activity based on only [O II] emissions might result in the underestimation to some extent, because [O II] emission surveys tend to be biased toward less dusty galaxies and therefore will miss the most dusty starburst galaxies.
5 Conclusions
We investigate the mean relation between H and [O II] luminosities for [O II] emitters at in the UDS and COSMOS fields using a stacking analysis which enables us to examine the H luminosity of galaxies at even if the individual galaxies are too faint to detect both H and [O II] emission lines simultaneously. The [O II] emitters at are selected with the NB921 narrow-band data taken with Suprime-Cam on Subaru Telescope, while the H luminosities are measured on the stacked NBH narrow-band data taken with WFCAM on UKIRT.
We find that on average there is positive correlation between H and [O II] luminosities for not only bright galaxies but also faint ones with [O II] luminosity down to erg s-1, i.e, SFR=1.4 M⊙yr-1. The trend that galaxies with higher [O II] luminosities have higher H luminosities is consistent with that of the local galaxies, suggesting that [O II] luminosities can be used as an indicator of SFR even at the high redshift of .
However, we have to use the [O II] luminosities with caution to estimate SFRs at based on the relation calibrated with local galaxies. This is because [O II] emitters at show observed H /[O II] line ratios corresponding to 0.35 and are less subject to dust attenuation than the local galaxies selected based on [O II] luminosity. Therefore, [O II]-selected emitters at are biased toward less dusty populations. The use of dust-correction relations derived with H emitter samples may cause us to overestimate the amount of dust extinction and hence the dust-corrected SFR. At the same time, surveys of star formation activity based on [O II] emissions may miss populations of dusty starburst galaxies.
On the other hand, we note a caveat to our interpretation of the results in terms of dust extinction only, because the H /[O II] line ratio is also dependent on the metallicity. Hence the discrepancy of the line ratio between [O II] emitters at and local galaxies may be explained in terms of metallicity difference. Therefore, the possibility that the low H /[O II] ratio is not only due to the lower dust extinction, but also the lower metallicities of [O II] emitters at than local galaxies, cannot be completely ruled out. To distinguish the two factors of dust extinction and metallicity completely, we require deep spectroscopy to obtain the nebular emissions from the individual or stacked spectra.
Acknowledgments
We would like to thank an anonymous referee for carefully reading our manuscript and providing helpful comments. MH is grateful for financial support from the Japan Society for the Promotion of Science (JSPS) fund, “Institutional Program for Young Researcher Overseas Visits” to stay at the IfA, Royal Observatory of Edinburgh for two months in 2011. DS acknowledges financial support from the Netherlands Organisation for Scientific research (NWO) through a Veni fellowship and the NOVA Research school for a NOVA fellowship. IRS acknowledges support from the Leverhulme Trust and STFC. The United Kingdom Infrared Telescope is operated by the Joint Astronomy Centre on behalf of the Science and Technology Facilities Council of the U.K. Data used in this paper are in part collected at Subaru Telescope, which is operated by the National Astronomical Observatory of Japan.
References
- Abazajian et al. (2009) Abazajian K. N., Adelman-McCarthy J. K., Agüeros M. A., Allam S. S., Allende Prieto C., An D., Anderson K. S. J., Anderson S. F., Annis J., Bahcall N. A., et al. 2009, ApJS, 182, 543
- Adelman-McCarthy et al. (2008) Adelman-McCarthy J. K., Agüeros M. A., Allam S. S., Allende Prieto C., Anderson K. S. J., Anderson S. F., Annis J., Bahcall N. A., Bailer-Jones C. A. L., el al. 2008, ApJS, 175, 297
- Best et al. (2010) Best P., Smail I., Sobral D., Geach J., Garn T., Ivison R., Kurk J., Dalton G., Cirasuolo M., Casali M., 2010, ArXiv:1003.5183
- Bouwens et al. (2011) Bouwens R. J., Illingworth G. D., Oesch P. A., Labbé I., Trenti M., van Dokkum P., Franx M., Stiavelli M., Carollo C. M., Magee D., Gonzalez V., 2011, ApJ, 737, 90
- Bruzual (2007) Bruzual G., 2007, in Vallenari A., Tantalo R., Portinari L., Moretti A., eds, From Stars to Galaxies: Building the Pieces to Build Up the Universe Vol. 374 of Astronomical Society of the Pacific Conference Series, Stellar Populations: High Spectral Resolution Libraries. Improved TP-AGB Treatment. p. 303
- Bruzual & Charlot (2003) Bruzual G., Charlot S., 2003, MNRAS, 344, 1000
- Calzetti et al. (2000) Calzetti D., Armus L., Bohlin R. C., Kinney A. L., Koornneef J., Storchi-Bergmann T., 2000, ApJ, 533, 682
- Casali et al. (2007) Casali M., Adamson A., Alves de Oliveira C., Almaini O., Burch K., Chuter T., Elliot J., Folger M., Foucaud S., Hambly N., Hastie M., Henry D., et al. 2007, A&A, 467, 777
- Chabrier (2003) Chabrier G., 2003, PASP, 115, 763
- Cid Fernandes et al. (2010) Cid Fernandes R., Stasińska G., Schlickmann M. S., Mateus A., Vale Asari N., Schoenell W., Sodré L., 2010, MNRAS, 403, 1036
- Daddi et al. (2007) Daddi E., Dickinson M., Morrison G., Chary R., Cimatti A., Elbaz D., Frayer D., Renzini A., Pope A., Alexander D. M., Bauer F. E., Giavalisco M., Huynh M., Kurk J., Mignoli M., 2007, ApJ, 670, 156
- Furusawa et al. (2008) Furusawa H., Kosugi G., Akiyama M., Takata T., Sekiguchi K., Tanaka I., Iwata I., Kajisawa M., Yasuda N., Doi M., Ouchi M., Simpson C., etal. 2008, ApJS, 176, 1
- Geach et al. (2008) Geach J. E., Smail I., Best P. N., Kurk J., Casali M., Ivison R. J., Coppin K., 2008, MNRAS, 388, 1473
- Gilbank et al. (2010) Gilbank D. G., Baldry I. K., Balogh M. L., Glazebrook K., Bower R. G., 2010, MNRAS, 405, 2594
- Goto et al. (2010) Goto T., Takagi T., Matsuhara H., Takeuchi T. T., Pearson C., Wada T., Nakagawa T., Ilbert O., Le Floc’h E., Oyabu S., Ohyama Y., Malkan M., et al. 2010, A&A, 514, A6
- Hayashi et al. (2011) Hayashi M., Kodama T., Koyama Y., Tadaki K.-I., Tanaka I., 2011, MNRAS, 415, 2670
- Hopkins & Beacom (2006) Hopkins A. M., Beacom J. F., 2006, ApJ, 651, 142
- Kennicutt (1998) Kennicutt Jr. R. C., 1998, ARA&A, 36, 189
- Koekemoer et al. (2007) Koekemoer A. M., Aussel H., Calzetti D., Capak P., Giavalisco M., Kneib J.-P., Leauthaud A., Le Fèvre O., McCracken H. J., Massey R., Mobasher B., Rhodes J., Scoville N., Shopbell P. L., 2007, ApJS, 172, 196
- Lawrence et al. (2007) Lawrence A., Warren S. J., Almaini O., Edge A. C., Hambly N. C., Jameson R. F., Lucas P., Casali M., Adamson A., Dye S., Emerson J. P., Foucaud S., et al. 2007, MNRAS, 379, 1599
- Lemaux et al. (2010) Lemaux B. C., Lubin L. M., Shapley A., Kocevski D., Gal R. R., Squires G. K., 2010, ApJ, 716, 970
- Ly et al. (2011) Ly C., Lee J. C., Dale D. A., Momcheva I., Salim S., Staudaher S., Moore C. A., Finn R., 2011, ApJ, 726, 109
- Ly et al. (2007) Ly C., Malkan M. A., Kashikawa N., Shimasaku K., Doi M., Nagao T., Iye M., Kodama T., Morokuma T., Motohara K., 2007, ApJ, 657, 738
- Madau et al. (1996) Madau P., Ferguson H. C., Dickinson M. E., Giavalisco M., Steidel C. C., Fruchter A., 1996, MNRAS, 283, 1388
- Magnelli et al. (2009) Magnelli B., Elbaz D., Chary R. R., Dickinson M., Le Borgne D., Frayer D. T., Willmer C. N. A., 2009, A&A, 496, 57
- Magnelli et al. (2012) Magnelli B., Lutz D., Santini P., Saintonge A., Berta S., Albrecht M., Altieri B., Andreani P., et al. 2012, A&A, 539, A155
- Miyazaki et al. (2002) Miyazaki S., Komiyama Y., Sekiguchi M., Okamura S., Doi M., Furusawa H., Hamabe M., Imi K., Kimura M., Nakata F., Okada N., Ouchi M., Shimasaku K., Yagi M., Yasuda N., 2002, PASJ, 54, 833
- Moustakas et al. (2006) Moustakas J., Kennicutt Jr. R. C., Tremonti C. A., 2006, ApJ, 642, 775
- Ouchi et al. (2009) Ouchi M., Mobasher B., Shimasaku K., Ferguson H. C., Fall S. M., Ono Y., Kashikawa N., Morokuma T., Nakajima K., Okamura S., Dickinson M., Giavalisco M., Ohta K., 2009, ApJ, 706, 1136
- Ouchi et al. (2010) Ouchi M., Shimasaku K., Furusawa H., Saito T., Yoshida M., Akiyama M., Ono Y., Yamada T., Ota K., Kashikawa N., Iye M., Kodama T., Okamura S., Simpson C., Yoshida M., 2010, ApJ, 723, 869
- Pérez-González et al. (2005) Pérez-González P. G., Rieke G. H., Egami E., Alonso-Herrero A., Dole H., Papovich C., Blaylock M., Jones J., Rieke M., Rigby J., Barmby P., Fazio G. G., Huang J., Martin C., 2005, ApJ, 630, 82
- Scoville et al. (2007) Scoville N., Aussel H., Brusa M., Capak P., Carollo C. M., Elvis M., Giavalisco M., Guzzo L., Hasinger G., Impey C., Kneib J.-P., LeFevre O., Lilly S. J., Mobasher B., Renzini A., Rich R. M., et al. 2007, ApJS, 172, 1
- Shioya et al. (2008) Shioya Y., Taniguchi Y., Sasaki S. S., Nagao T., Murayama T., Takahashi M. I., Ajiki M., Ideue Y., Mihara S., Nakajima A., Scoville N. Z., Mobasher B., Aussel H., Giavalisco M., Guzzo L., Hasinger G., et al. 2008, ApJS, 175, 128
- Sobral et al. (2009) Sobral D., Best P. N., Geach J. E., Smail I., Kurk J., Cirasuolo M., Casali M., Ivison R. J., Coppin K., Dalton G. B., 2009, MNRAS, 398, 75
- Sobral et al. (2011) Sobral D., Best P. N., Smail I., Geach J. E., Cirasuolo M., Garn T., Dalton G. B., 2011, MNRAS, 411, 675
- Sobral et al. (2012a) Sobral D., Best P. N., Matsuda Y., Smail I., Geach J. E., Cirasuolo M., 2012a, MNRAS, 420, 1926
- Sobral et al. (2012b) Sobral D., Smail I., Best P. N., Geach J. E., Matsuda Y., Stott J. P., Cirasuolo M., Kurk J., 2012b, MNRAS, arXiv:1202.3436
- Tanaka et al. (2012) Tanaka M., Finoguenov A., Lilly S. J., Bolzonella M., Carollo C. M., Contini T., Iovino A., Kneib J.-P., Zamorani G., Bardelli S., Bongiorno A., Caputi K., et al. 2012, PASJ, 64, 22
- Tremonti et al. (2004) Tremonti C. A., Heckman T. M., Kauffmann G., Brinchmann J., Charlot S., White S. D. M., Seibert M., Peng E. W., Schlegel D. J., Uomoto A., Fukugita M., Brinkmann J., 2004, ApJ, 613, 898
- Wardlow et al. (2011) Wardlow J. L., Smail I., Coppin K. E. K., Alexander D. M., Brandt W. N., Danielson A. L. R., Luo B., Swinbank A. M., Walter F., et al 2011, MNRAS, 415, 1479
- Weiner et al. (2007) Weiner B. J., Papovich C., Bundy K., Conselice C. J., Cooper M. C., Ellis R. S., Ivison R. J., Noeske K. G., Phillips A. C., Yan R., 2007, ApJL, 660, L39
- Yabe et al. (2012) Yabe K., Ohta K., Iwamuro F., Yuma S., Akiyama M., Tamura N., Kimura M., Takato N., Moritani Y., Sumiyoshi M., Maihara T., Silverman J., Dalton G., Lewis I., Bonfield D., Lee H., Curtis Lake E., Macaulay E., Clarke F., 2012, PASJ, 64, 60
- Yan et al. (2006) Yan R., Newman J. A., Faber S. M., Konidaris N., Koo D., Davis M., 2006, ApJ, 648, 281