IRS-TR 12002: Constructing a Short-Low Truth Spectrum of the Standard Star HR 6348
Abstract
This report describes in detail the generation of a “truth” spectrum of HR 6348, using observations with the Short-Low (SL) module of the Infrared Spectrograph of HR 6348, and the A dwarfs Lac and UMi. Using spectral ratios, we can propagate Kurucz models of the A dwarfs to the K giant HR 6348, which can then serve to calibrate the remaining database of SL spectra. Mitigation in the vicinity of the Pfund- line is necessary to reduce residual artifacts at 7.45 \mum. In general, the new SL spectrum of HR 6348 has a spectroscopic fidelity of 0.5 % or better. Artifacts from the hydrogen recombination lines in the A dwarfs will generally be smaller than this limit, although the residual artifact from the blend of lines near Pfund- exceeds the limit at 0.7 %.
1 Introduction
The Infrared Spectrograph (IRS; Houck et al. 2004) on the Spitzer Space Telescope (Werner et al. 2004) operated from launch in August, 2003 to the exhaustion of onboard cryogens in May, 2009. During this period, the IRS obtained over 16,000 low-resolution spectra, most with both the Short-Low (SL) and Long-Low (LL) modules. The cryogenic mission included hundreds of observations of standard stars, most of which were A dwarfs or K giants. The use of standard stars to calibrate the spectra of other sources uses the equation
| (1) |
where the subscript “T” denotes the actual spectrum of a target, the subscript “O” denotes its observed spectrum, “C” refers to the calibrator (or standard star), and “S” refers to the science target (the source being calibrated). The spectral correction needed to convert raw spectra from the SL module into accurate flux-density units is often referred to as the relative spectral response function, or RSRF. It is the ratio . Any errors in the assumed spectrum for a chosen standard will propagate to the entire spectral database. The spectrum is commonly referred to as a “truth” spectrum, although it will never be perfect. Our objective is to minimize the imperfections in the truth spectra for our chosen standards, because those imperfections will propagate to the full SL database as artifacts.
The IRS Team at Cornell chose HR 6348 as the primary standard for SL and LL for several reasons. First, it is relatively bright, allowing quick integrations to obtain high signal/noise (SN) ratios. Second, it is faint enough to use the IRS Red Peak-Up sub-array for target acquisition, which improves our ability to center it in the spectroscopic slit and provides contemporaneous infrared photometry. Third, it is close enough to the northern continuous viewing zone (CVZ) to allow observations in nearly all IRS observing campaigns. And fourth, it is an early K giant with relatively weak molecular bands, most notably from SiO at 8 \mum. Later K giants have stronger bands which make their use as standards more challenging.
Prior to launch, the IRS Teams at Cornell and the Spitzer Science Center (SSC) decided to rely on two methods to estimate truth spectra: (1) synthetic spectra generated from stellar models, and (2) spectral templates, which are based on observed truth spectra of stars with identical spectral classifications. As described by Sloan et al. (2013), neither method proved suitable. Synthetic spectra do not predict the depth of molecular bands in late-type stars with sufficient accuracy, although they work well for early-type stars with only atomic lines in their spectra. Additionally, the variations in the depths of molecular bands within a given spectral class are large enough to make spectral templates too inaccurate.
This report describes in detail the generation of a fully calibrated spectrum of HR 6348, to be used as the assumed spectrum when using observations of HR 6348 to determine the spectral correction (or RSRF) for SL. Without a means to estimate its truth spectrum apriori, we chose to repeat the methodology of Cohen et al. (1992a,b,c), who calibrated the spectrum of the K5 giant Tau using similar observations and models of the A dwarfs CMa and Lyr. Over the next decade, they built a library of 16 calibrated spectra of standard stars, any of which could serve as a “truth” spectrum (Cohen et al. 1995, 1996a, 1996b, 2003).
The general plan for HR 6348 follows theirs. Using Kurucz models of the A dwarfs Lac and and UMi, we first calibrate the low-resolution IRS spectrum of HR 6348. Then using this standard star, we can calibrate additional standards and propagate the calibration to the entire database of low-resolution IRS spectra. This report concentrates on the spectra in the SL module, which covers the 5–14 \mum range. IRS-TR 12003 (Sloan & Ludovici 2012b) will describe the calibration of HR 6348 using data from LL and the combination of data from SL, LL and the Red-PU sub-array to produce a photometrically calibrated 5–37 \mum spectrum of HR 6348.
2 Kurucz models
We begin with a Kurucz model of Lac supplied to the IRS Team by M. Cohen. The team received the original low-resolution model prior to launch; they received a high-resolution model with (/) = 1000 in September, 2004. To shift this model to the wavelength grid and resolution of SL and LL, we convolved it with gaussians with the widths given by Table 1. These gaussians were chosen to reproduce the widths of the hydrogen recombination lines as observed in SL and LL.
| Table 1—Convolution Parameters | |
|---|---|
| Order | Gaussian width (in pixels) |
| SL2 | 0.75 |
| SL1 and SL-bonus | 1.00 |
| LL2 | 0.95 |
| LL1 and LL-bonus | 0.75 |
We also shifted the models photometrically to match the Red PU photometry as calibrated by IRS-TR 11002 (Sloan & Ludovici 2011). This latter step is not essential, because the loss of flux in some pointings in SL will require that we rescale the final SL spectrum of HR 6348 to match LL.
In order to fit the available optical and infrared photometry, the Cohen-supplied model is based on an A2 dwarf, even though the spectral class of Tau is A1 V. The interstellar extinction () is zero. The low-resolution model for UMi (A1 Vn) differs from Lac only in its photometric scaling. Because we did not have a high-resolution model for UMi, we used the model for Lac, scaled to match the Red PU photometry.
3 Procedure
To calibrate the spectrum of HR 6348, we followed the same procedure in all three of the available orders. We calibrated HR 6348 in each of the two nod positions in each order. For each nod position, we calibrated the data twice, once with Lac and once with UMi. Within each nod, we combined the separately calibrated data by forcing them to a spline-smoothed average while preserving their separate noise (and artifact) characteristics. When combining the two spectra to a single nod spectrum, we set the weighting for one of the spectra to zero if it showed more structure than the other. We followed an identical technique when combining the two nod spectra into one spectrum for the order in question. Generally, this approach conserves the overall shape of the spectrum, while at each stage, it selects for the smoother input. The next three sections describe the procedure for SL1, SL2, and the SL-bonus order (SL-b), respectively.
We did not use all of the available data for any of the three stars considered. IRS-TR 12001 (Sloan & Ludovici 2012a) describes how the level and overall shape of a spectrum can vary depending on its position within the slit. These spectral pointing-induced throughput errors, or SPITE, have been a concern since before Spitzer launched. We reject any pointings if either the total throughput loss in SL1 is 8% of more, or if the change in color, as measured between the 7.5–9.5 \mum and 11.5–14.0 \mum windows, is more than 1%. Additional images might also face rejection for a variety of reasons, including data drop-outs and residual images from previously observed bright sources.
In SL, the only suspicious artifact on the order of 1% or larger appears at 7.45 \mum, at the position of a blend of the Pfund- line with other hydrogen recombination lines. Sec. 7 explains how we mitigated for this artifact.
Our spectrum is only valid in the wavelength regimes for which the data are valid. However, it is advantageous to make a reasonable estimate of the spectrum at all wavelengths where SL obtained data, even if of dubious quality. Sec. 7 also describes how we filled out the available wavelength space.
4 Short-Low Order 1
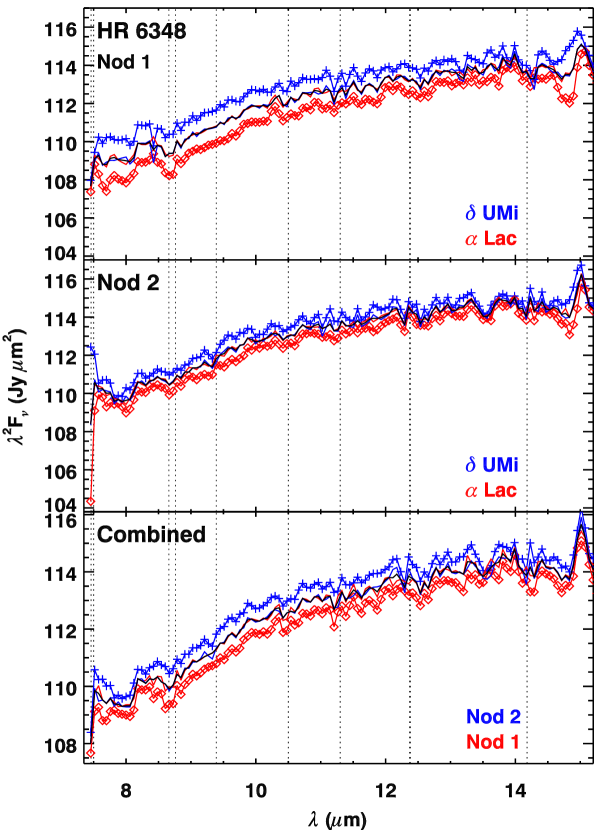
Figure 1 illustrates the construction of the SL1 spectrum of HR 6348. The top two panels show each nod separately. Generally, when one calibration showed more structure than the other in a given wavelength range, we used only data for the other. For Nod 1, we ignored the Lac-calibrated spectrum at 8.60–8.73 and 10.24-10.36 \mum. For Nod 2, we dropped the Lac-calibrated spectrum at 8.91–9.09 \mum and the UMi-calibrated spectrum at 11.02–11.14 \mum. When combining the nods, we dropped Nod 1 at 8.30–8.60, 8.73–8.85, and 10.42–10.54 \mum and Nod 2 at 8.18–8.24 and 9.21-9.33 \mum.
5 Short-Low Order 2
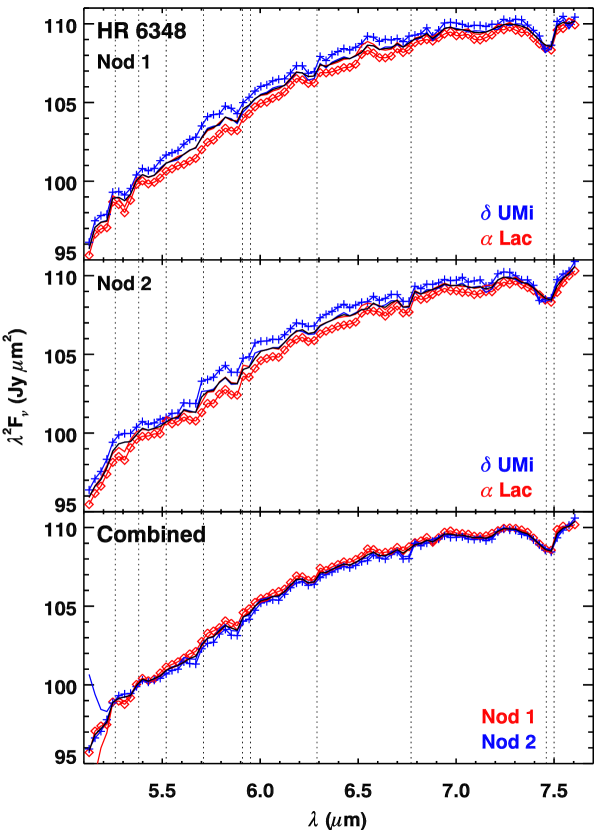
Figure 2 illustrates the construction of HR 6348 in SL2, following the same procedure as in SL1. Because the first four pixels (5.13–5.22 \mum) of the Lac calibration created problems for the spline-fitting algorithm, we replaced these with the corresponding data from the UMi calibration (keeping the nods separate). As before, data in a pair being combined showing more structure than its counterpart were ignored. When combining the spectra for Nod 1, we discounted the Lac calibration at 5.25–5.43 and 6.52–6.58 \mum and the UMi calibration at 5.91–5.97, 6.22–6.28, and 7.42–7.49 \mum. For Nod 2, the rejected data included the Lac calibration at 5.19–5.43, 5.52, 5.91-5.94, and 6.52–6.58 \mum and UMi calibration at 5.97–6.00, 6.22–6.28, and 7.42–7.49 \mum. When combining the nods, we rejected the Nod 1 data at 5.31–5.34 and 5.43–5.49 \mum and the Nod 2 data at 5.61–5.67, 5.82–5.88, and 6.73–6.79 \mum.
6 Short-Low Bonus Order
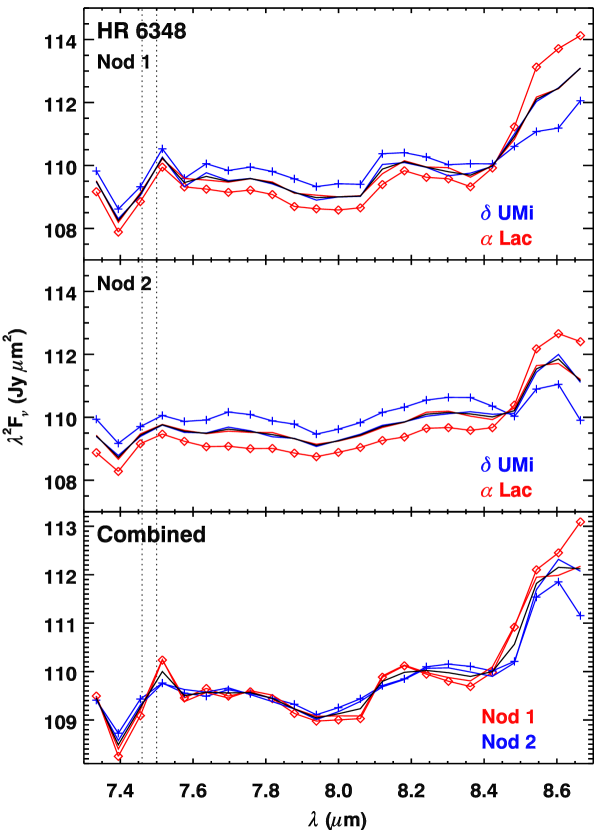
Figure 3 presents the construction of HR 6348 in the SL-bonus order. Unlike the other two orders, none of the data were rejected. We simply used everything when combining calibrations to make the two nods, and when combining the two nods to make a single spectrum.
7 Repairing Artifacts and Segment Ends
| Table 2—Wavelength Ranges | ||
|---|---|---|
| Spectral | Full range | Useful range |
| segment | \mum | \mum |
| SL2 | 5.13–7.61 | 5.13–7.52 |
| SL-bonus | 7.33–8.66 | 7.76–8.36 |
| SL1 | 7.46–15.26 | 7.58–14.17 |
In Figures 1–3, the vertical dotted lines mark the positions of the more significant hydrogen recombination lines in the A dwarfs. Much of the spectral structure in our calibration of HR 6348 is in the vicinity of these lines, suggesting that our low-resolution truth spectrum for the A dwarfs is imperfect. The possible artifacts are more noticeable in SL2, especially at 7.5 \mum, where the Pfund- line is blended with the 8–6 and other transitions. We estimate that the Pfund- artifact has a peak strength of 1.5%.
Most of the possible artifacts have a strength of 0.5% or less, and because they are generally offset to the blue with respect to the expected line centers, we have chosen to take the conservative approach and leave them alone. This decision sets a limit of 200 for a meaningful signal/noise ratio for SL data.
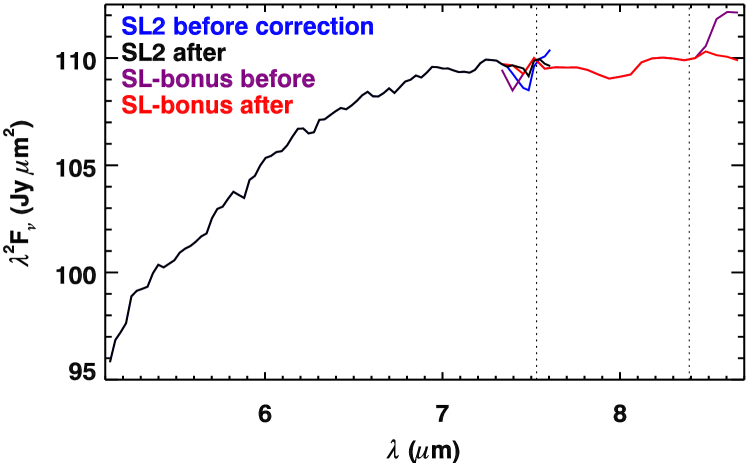
The artifact at 7.5 \mum clearly exceeds our 0.5 % limit and must be dealt with. With an artifact this pronounced, we can generate a correction from other data. We selected the asteroids Amalia and Isara and the ultraluminous infrared galaxy IRAS 07598+6508 as our test set. All three sources were observed by the IRS as red calibrators, and none show any spectral structure in the vicinity of the Pfund- line. We calibrated each source using the calibrated spectrum of HR 6348, as it appears in the bottom panels of Figures 1–3, as the truth spectrum. All three show the Pfund- artifact, and from these we constructed a correction running from 7.33 to 7.52 \mum, peaking at 0.8 % at 7.46 \mum. This correction removes over half of the Pfund- artifact in the spectrum of HR 6348.
We are unable to remove any more of the artifact without making a priori assumptions about what the spectrum of HR 6348 should look like in this region. This region is complicated not just by Pfund-, but also by the fact that it coincides with the boundary between SL2 and SL1, and because it marks the blue edge of the SiO absorption bandhead commonly seen in K giants.
It is useful to have a reasonable estimate for the truth spectrum at all wavelengths covered by SL, even if the module does not return meaningful data at those wavelengths. Where spectral segments overlap their neighbors, we simply use the neighboring data to fill them out. We extrapolated SL1 past its long-wavelength limit of 14.20 \mum using a 4400 K Engelke function (Engelke 1992). These steps will prevent data in these regions from being wildly miscalibrated, which is useful even if they ultimately will be discarded.
8 Quality Assessment
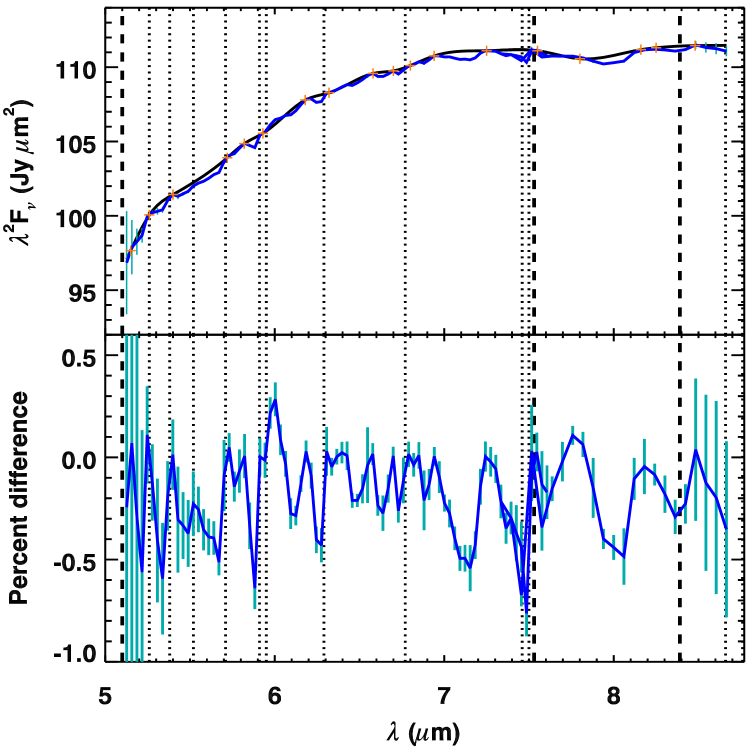
Figures 5 and 6 use fitted splines to estimate the strength of the residual structure in our spectrum of HR 6348. In SL2, the most significant feature is at the position of the Pfund line at 7.5 \mum. Given the proximity of this feature to the SL2/SL1 interface, we cannot state whether the structure in our spectrum is an artifact or really intrinsic to HR 6348. Its strength is 0.7%. There appear to be artifacts in the vicinity of the hydrogen recombination lines at 5.9 and 6.3 \mum, which may arise from differences between the actual A dwarf spectra and our model. These differences could arise from differences in line strengths, but it is also possible that differences in line profiles from our assumed gaussians could be responsible.
Some of the absorption features in HR 6348 do not coincide with hydrogen recombination lines, such as the feature at 7.1 \mum and the smaller features at 6.1, 6.5, and 6.6 \mum. Whether these features are due to real structure in HR 6348 or to imperfections in the models of A dwarfs is an open question. They are within our stated envelope of 0.5% fidelity in our spectral calibration.
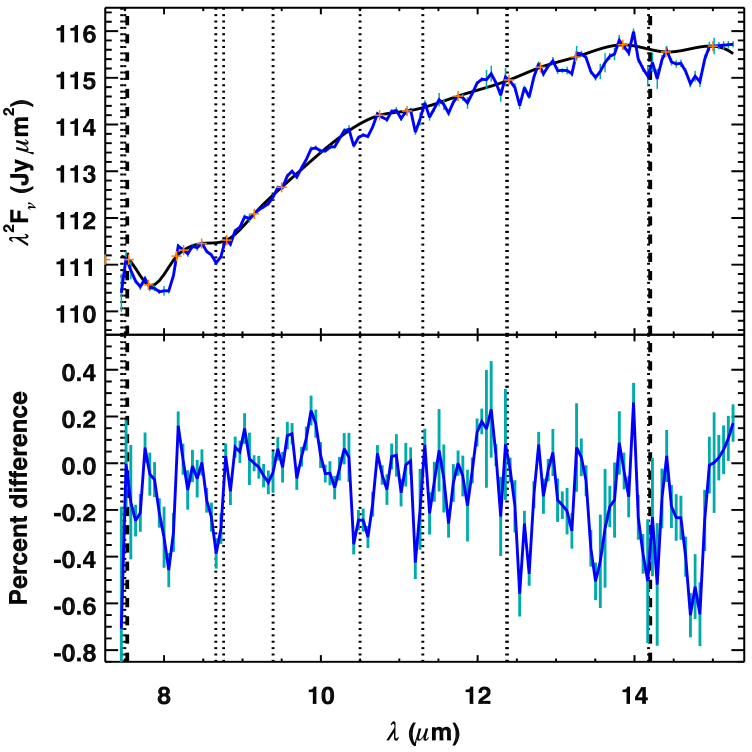
Figure 6 focuses on SL1. We chose to force the spline through much of the weak SiO band in HR 6348, but one should keep in mind that most of the structure between 7.5 and 9.0 \mum is likely to be real and due to SiO. The absorption feature at 8.6 \mum is close to the 14–8 and 10–7 hydrogen transitions and is more debatable, but if it is an artifact, its strength is only 0.3%. The broad absorption features at 12.5, 13.0, 13.5, and 14.2 \mum probably arise from OH bands and are quite likely real. The four most dominant absorption features between 9 and 12 \mum are all close to the position of hydrogen recombination lines and may well be artifacts. Their strength is generally only 0.3%.
We conclude that the spectral fidelity of the SL spectrum of HR 6348 presented here is generally better than 0.5% in SL2 and 0.3% in SL1. The notable exception is in the vicinity of the Pfund- line at 7.5 \mum, at the junction between SL2 and SL1, where the fidelity is only 0.7%.
References
- [Cohen et al.(1992a)] Cohen, M., Walker, R.G., Barlow, M.J., & Deacon, J.R. 1992, AJ, 104, 1650.
- [Cohen et al.(1992b)] Cohen, M., Walker, R.G., & Witteborn, F. C. 1992, AJ, 104, 2030.
- [Cohen et al.(1992c)] Cohen, M., Witteborn, F.C., Auguson, G., et al. 1992, AJ, 104, 2045.
- [Cohen et al.(1995)] Cohen, M., Witteborn, F.C., Walker, R.G., Bregman, J.D., & Wooden, D.H. 1995, AJ, 110, 275.
- [Cohen et al.(1996a)] Cohen, M., Witteborn, F. C., Bregman, J. D., et al. 1996a, AJ, 112, 241.
- [Cohen et al.(1996b)] Cohen, M., Witteborn, F. C., Carbon, D. F., et al. 1996b, AJ, 112, 2274.
- [Cohen et al.(2003)] Cohen, M., Megeath, S. T., Hammersley, P. L., Martín-Luis, F., & Stauffer, J. 2003, AJ, 125, 2645.
- [Engelke(1992)] Engelke, C. W. 1992, AJ, 104, 1248
- [Houck et al.(2004)] Houck, J.R., Roellig, T. L., van Cleve, J., et al. 2004, ApJS, 154, 18.
- [Sloan & Ludovici(2011)] Sloan, G.C. & Ludovici, D. A. 2011, “IRS-TR 11002: Calibration of the Acquisition Images from the Red Peak-Up Sub-Array.”
- [Sloan & Ludovici(2012a)] Sloan, G.C. & Ludovici, D. A. 2012a “IRS-TR 12001: Spectral Pointing-Induced Throughput Error and Spectral Shape in Short-Low Order 1.”
- [Sloan & Ludovici(2012b)] Sloan, G.C. & Ludovici, D. A. 2012b, “IRS-TR 12003: Constructing Low-Resolution Truth Spectra of the Standard Stars HR 6348 and HD 173511.”
- [1] Sloan, G.C. et al. 2013, AJ, in preparation.
- [2] Werner, M.W., Roellig, T. L., Low, F. J., et al. 2004, ApJS, 154, 1.