Hofstadter’s butterfly in moiré superlattices: A fractal quantum Hall effect
pacs:
xxElectrons moving through a spatially periodic lattice potential develop a quantized energy spectrum consisting of discrete Bloch bands. In two dimensions, electrons moving through a magnetic field also develop a quantized energy spectrum, consisting of highly degenerate Landau energy levels. In 1976 Douglas Hofstadter theoretically considered the intersection of these two problems and discovered that 2D electrons subjected to both a magnetic field and a periodic electrostatic potential exhibit a self-similar recursive energy spectrumHofstadter:1976 . Known as Hofstadter’s butterfly, this complex spectrum results from a delicate interplay between the characteristic lengths associated with the two quantizing fieldsHofstadter:1976 ; Wannier:1978 ; Claro:1979 ; Streda:1982b ; Thouless:1982 ; MacDonald:1983 ; Koshino:2006 ; Nemec:2007 ; Bistritzer:2011 ; Moon:2012 ; Beugeling:2012 , and represents one of the first quantum fractals discovered in physics. In the decades since, experimental attempts to study this effect have been limited by difficulties in reconciling the two length scales. Typical crystalline systems ( nm periodicity) require impossibly large magnetic fields to reach the commensurability condition, while in artificially engineered structures ( nm), the corresponding fields are too small to completely overcome disorderWeiss:1990 ; Gerhardts:1991 ; Albrecht:1998 ; Nakamura:1998 ; Albrecht:1999 ; Schlosser:1999 ; Albrecht:2003 ; Geisler:2004 ; Melinte:2004 . Here we demonstrate that moiré superlattices arising in bilayer graphene coupled to hexagonal boron nitride provide a nearly ideal-sized periodic modulation, enabling unprecedented experimental access to the fractal spectrum. We confirm that quantum Hall effect features associated with the fractal gaps are described by two integer topological quantum numbers, and report evidence of their recursive structure. Observation of Hofstadter’s spectrum in graphene provides the further opportunity to investigate emergent behaviour within a fractal energy landscape in a system with tunable internal degrees of freedom.
The total number of electron states per area of a completely filled Bloch band is exactly , where is the area of the unit cell of the periodic potential. In a magnetic field, the number of states per area of each filled Landau level (LL) is given by where is the magnetic flux quanta. The quantum description of electrons subjected simultaneously to both a periodic electric field and a magnetic field can be simply parameterized by the dimensionless ratio where is magnetic flux per unit cell. The general solution of this problem, however, exhibits a rich complexity due to the incommensurate periodicities between the Bloch and Landau statesHarper:1955 . In his seminal workHofstadter:1976 , Hofstadter showed that for commensurate fields, corresponding to rational values of , where and are co-prime integers, the single-particle Bloch band splits into subbands (beginning with the Landau level description it is equivalently shownWannier:1978 that at these same rational values each Landau level splits into p subbands). This results in a quasi-continuous distribution of incommensurate quantum states that exhibits self-similar recursive structure, yielding the butterfly-like fractal energy diagram (see SI).
Important insight into this problem was subsequently provided by WannierWannier:1978 , who considered the density of charge carriers, , required to fill each fractal subband. Replotting the Hofstadter energy spectrum as integrated density versus field, Wannier realized that all spectral gaps are constrained to linear trajectories in the density-field diagram. This can be described by a simple Diophantine relation
| (1) |
where and are the normalized carrier density and magnetic flux, respectively, and and are both integer valued. Here represents the Bloch band filling fraction, which is distinct from the usual Landau level filling fraction, (the two are related by the normalized flux, i.e. . The physical significance of the and quantum numbers became fully apparent with the discovery of the integer quantum Hall effectKlitzing:1980 in 1980, after which it was shown, simultaneously by both StřredaStreda:1982b and Thouless et alThouless:1982 , that the Hall conductivity associated with each mini-gap in the fractal spectrum is quantized according to . The second quantum number, , physically corresponds to the Bloch band filling index in the fractal spectrumMacDonald:1983 . This formalism suggests several unique and unambiguous experimental signatures associated with the Hofstadter energy spectrum that are distinct from the conventional quantum Hall effect: i) the Hall conductance can vary non-monotonically and can even fluctuate in sign, ii) Hall conductance plateaus together with vanishing longitudinal resistance can appear at non-integer LL filling fractions, iii) the Hall conductance plateau remains quantized to integral multiples of , however, the quantization integer is not directly associated with the usual LL filling fraction. Instead, quantization is equal to the slope of the gap trajectory in the versus Wannier diagram, in accordance with the Diophantine equation.
Mini-gaps within the fractal energy spectrum become significant only once the magnetic length (), which characterizes the cyclotron motion, is of the same order as the wavelength of the periodic potential, which characterizes the Bloch waves. For usual crystal lattices, where the inter-atomic spacing is a few ångstroms, the necessary magnetic field is impossibly large, in excess of 10,000 T. The main experimental effort therefore has been to lithographically define artificial superlatticesWeiss:1990 ; Gerhardts:1991 ; Albrecht:1998 ; Nakamura:1998 ; Albrecht:1999 ; Schlosser:1999 ; Albrecht:2003 ; Geisler:2004 ; Melinte:2004 with unit cell dimension of order tens of nanometers so that the critical magnetic field remains small enough to be achievable in the lab, yet still large enough so that the quantum Hall effect is fully resolved without being smeared out by disorder. Fabricating the optimally-sized periodic lattice, while maintaining coherent registry over the full device and without introducing substantial disorder has proven a formidable technical challenge. Patterned GaAs/AlGaAs heterostructures with nm periodic gates provided the first experimental support for Hofstadter’s predictionsSchlosser:1999 ; Albrecht:2003 ; Geisler:2004 . However, limited ability to tune the carrier density or reach the fully developed quantum Hall effect (QHE) regime in these samples has made it difficult to map out the complete spectrum. While similar concepts have also been pursued in non-solid-state model systemsKuhl:1998 ; Jaksch:2003 , the rich physics of the Hofstadter spectrum remains largely unexplored.
Heterostructures consisting of atomically thin materials in a multi-layer stack provide a new route towards realizing a two-dimensional system with laterally modulated periodic structure. In particular, coupling between graphene and hexagonal boron nitride (hBN), whose crystal lattices are isomorphic, results in a periodic moiré pattern. The moiré wavelength is directly related to the angular rotation between the two latticesXue:2011 ; Decker:2011 ; Yankowitz:2012 , and is tunable through the desired length scales without the need for lithographic techniquesBistritzer:2011 ; Moon:2012 . Moreover hBN provides an ideal substrate for achieving high mobility graphene devices, crucial for high resolution quantum Hall measurementsDean:2010 ; Dean:2011 , while field effect gating in graphene allows the Fermi energy to be continuously varied through the entire moiré Bloch band.
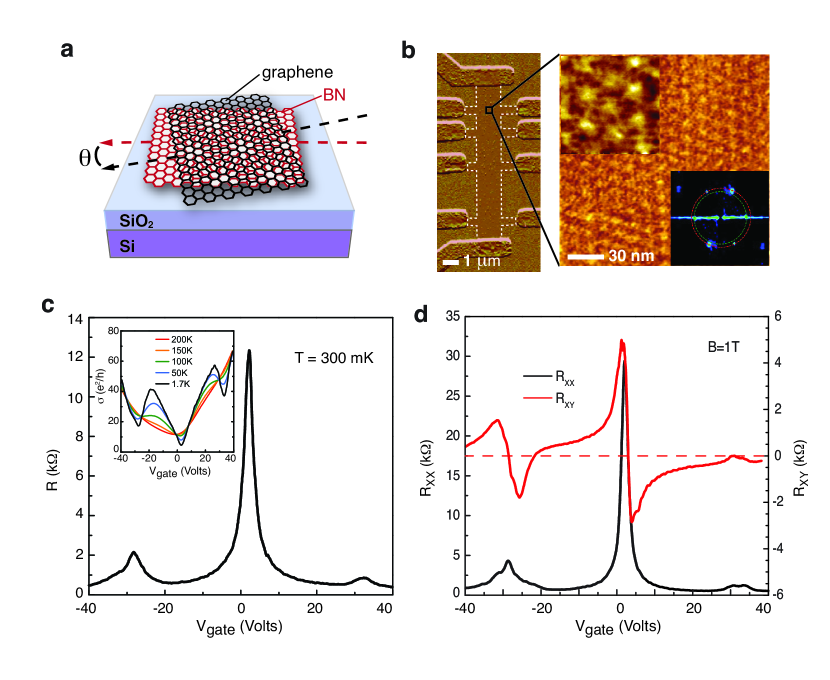
In this study, Bernal-stacked bilayer graphene (BLG) Hall bars are fabricated on hBN substrates (Fig. 1a,b) using mechanical exfoliation followed by co-lamination (see methods). Fig. 1b shows a non-contact atomic force microscopy (AFM) image acquired from an example device. In the magnified region, a moiré pattern is visible with triangular symmetry. Fast Fourier transform (FFT) analysis of the image, shown in the inset, indicates that the moiré wavelength is nm. This is comparable to the maximal wavelength of nm expected for graphene on hBNDecker:2011 ; Xue:2011 ; Yankowitz:2012 (set by the 1.8% lattice mismatch between the two crystals), suggesting that in this device the BLG lattice is oriented with near zero angle mismatch to the underlying hBN lattice.
Fig. 1c shows transport data measured from the same device. In addition to the usual resistance peak at the charge neutrality point (CNP), occurring at gate voltage V, two additional satellite resistance peaks appear, symmetrically located at V away from the CNP. These satellite features are consistent with a depression in the density of states (DOS) at the superlattice Brillouin zone band edge, analogous to previous spectroscopic measurements of single layer graphene coupled to a moiré patternYankowitz:2012 ; Li:2009 . Assuming non-overlapping bands, , gives an estimate of the moiré wavelength to be nm (see supplemental information), in good agreement with the AFM measurements. The nature of these satellite peaks can be further probed in the semi-classical, low -field transport regime. In Fig. 1d, longitudinal resistance, , and transverse Hall resistance, , are plotted versus gate voltage at T. Near the central CNP, the Hall resistance changes sign as the Fermi energy passes from the electron to the hole band. The same trend also appears near , consistent with the Fermi energy passing through a second band edge. This provides further confirmation that the moiré pattern, acting as a periodic potential superlattice, gives rise to a mini-Brillouin zone band Wallbank:2012 . The satellite peaks vanish at temperatures above 100 K (inset of Fig. 1c), indicating that the coupling between the BLG and hBN atomic lattices is of order 10 meV.
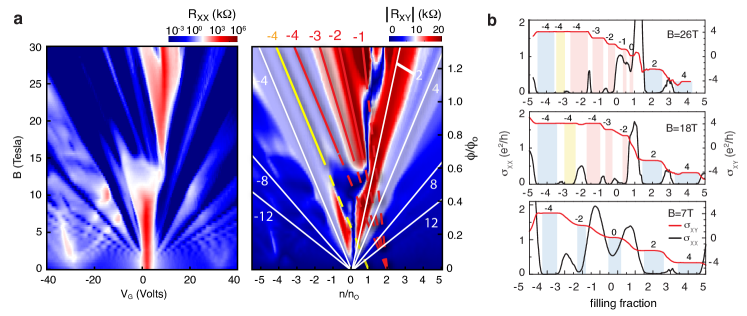
In the remainder of this letter, we focus on magnetotransport measured at high field. Fig. 2a shows the evolution of and for magnetic fields up to 31 T. In the left panel is plotted against the experimentally tunable gate voltage and magnetic field (a so-called Landau fan diagram). In the right panel, the magnitude of the corresponding is plotted against the dimensionless parameters appearing in the Diophantine equation, and . This “Wannier diagram” is simply the Landau fan diagram with both axes relabeled by dimensionless units defined by normalizing to the moiré unit cell area.
In a conventional quantum Hall system, the Landau fan diagram exhibits straight lines, tracking minima in and plateaus in . Plotted against and , the slope of each line is precisely the LL filling fraction, , and all lines converge to the origin. White lines in Fig. 2a identify QHE states matching this description, tracking LL filling fractions and . This is consistent with the usual QHE hierarchy associated with a conventional degenerate BLG spectrum.
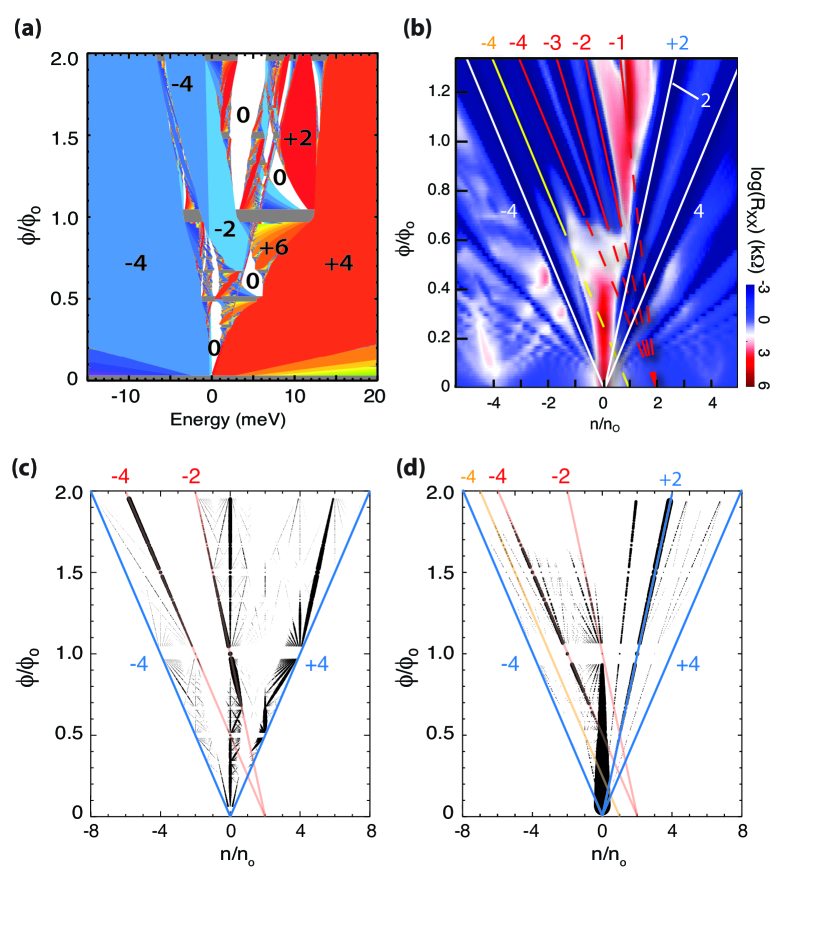
At large magnetic fields, several additional QHE states, exhibiting minima in together with plateaus in , develop outside the usual BLG sequence that also follow straight lines in the Landau fan diagram but converge to non-zero values of . Yellow and red lines in Fig. 2a trace examples of these anomalous QHE states appearing within the lowest LL. Unlike the conventional QHE states, each of the anomalous QHE states is characterized by both an integer valued intercept, (yellow and red lines converge to and 2, respectively) and an integer valued slope, (labeled along the top axis in the figure). In Fig. 2b, longitudinal and Hall conductivities acquired at constant magnetic field (corresponding to horizontal line cuts through the fan diagram in Fig. 2a) are plotted against LL filling fraction, . At large magnetic fields the anomalous QHE states are remarkably well developed, exhibiting wide plateaus in concomitant with zero valued . Moreover, these states appear in general at non-integer filling fractions. Comparison between Fig. 2a and 2b further reveals that Hall conductivity plateaus are quantized to integer values , where the quantization integer equals the slope in the Wannier diagram. Similar internal structure is observed within higher order Landau levels (see Fig. 3 and also supplemental info). The anomalous QHE states observed here are consistent with fully developed spectral gaps resulting from a Hofstadter-type energy spectrum. Moreover, our ability to fully map the density-field space provides a remarkable confirmation of the Diophantine equation, where we observe direct evidence that QHE features associated with the Hofstadter spectral gaps are characterized by the two quantum numbers, , and , corresponding to the intercept and slope, respectively, in the Wannier diagram.
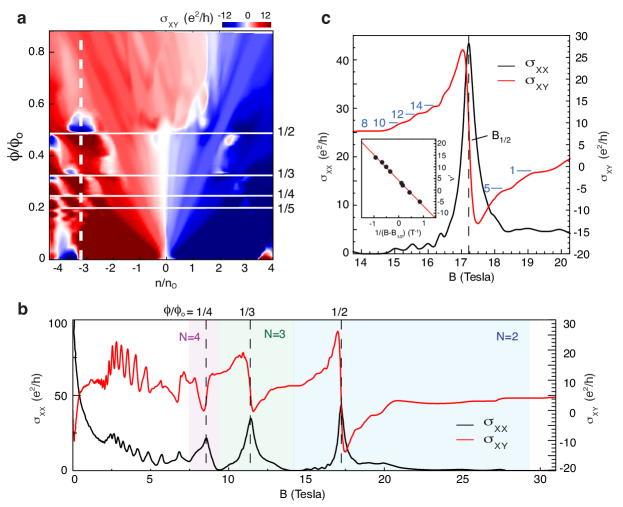
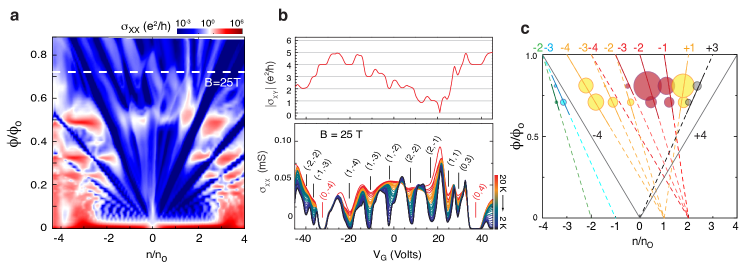
Fig. 3 shows similar data to Fig. 2, but acquired from a separate device in which the moiré wavelength is only 11.6 nm. Again, QHE states appear outside of the conventional Bernal-stacked BLG sequence following straight lines whose origin and slope are both integer valued, and with the slope exactly matching the Hall quantization, in precise agreement with the Diophantine equation. Similar to the previous device, the insulating state undergoes a dramatic change near when anomalous QHE states associated with the fractal gaps begin to fully develop.
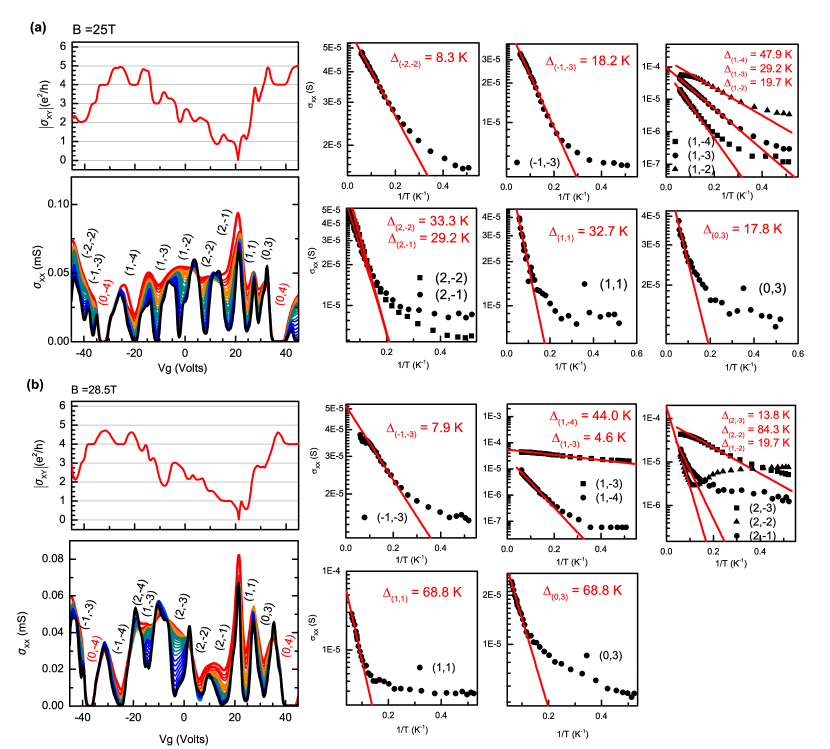
In Fig. 3b the lower panel shows acquired at T, corresponding to a horizontal line cut through Fig. 3a, with varying sample temperature. The magnitude of the fractal gaps were estimated from the temperature dependence of the minima in the thermally activated regime (see methods). This analysis was performed at two magnetic field values, T and 28.5 T. Fig. 3c summarizes our findings. Each fractal gap is marked by a circle centered at the corresponding , coordinate, and with radius scaled relative to the largest gap value (all gap values are given in the supplemental information). With increasing magnetic field spectral energies develop in a complicated way where some gaps grow with field (e.g. and ), while others diminish (e.g. ). At fixed magnetic field it appears generally true that for constant values, fractal gap states with increasing exhibit increasing gap size. For example, at T, K, whereas K. This contradicts Hofstadter’s prediction that fractal gaps corresponding to lower quantum numbers exhibit larger gap values. We note that such a trend was subsequently found to be specific to square lattice symmetries Wannier:1978 ; Claro:1979 ; MacDonald:1983 . Furthermore, a non-trivial case also arises when two fractal gap states overlapWannier:1978 , such as in our data between the (1,-2) and (2,-3) states as . Further theoretical analysis specific to moiré-patterned BLG is necessary to fully understand the trends highlighted here.
Fig. 4a shows a normalized Landau fan diagram of values corresponding to the same data in Fig. 3a. Dashed horizontal lines in the figure label special values , where is integer valued. Referred to by Hofstadter as the “pure cases”Hofstadter:1976 , these lines of high symmetry provide the framework for the recursive structure of the butterfly spectrum, marking the boundaries of the repeating sub-cells that appear within the main cellMacDonald:1983 . It appears that at particular points in the fan diagram, tends towards zero, inverting sign as the magnetic field is swept through these pure fractions. This is further revealed by the single line-trace in in Fig. 4b. At low magnetic fields, we observe the semi-classical Weiss oscillations previously reported for square superlatticesWeiss:1990 ; Gerhardts:1991 ; Schlosser:1999 ; Albrecht:1998 . In the quantum Hall regime, the longitudinal conductivity shows a local peak as the magnetic field passes through the pure fractions, with the corresponding Hall conductivity exhibiting a sharp transition. Near the field corresponding to , labeled in Fig. 4c as , plateaus appear in together with minima in resembling a mini QHE series centered around . If we redefine the local effective magnetic field as , then according to the usual QHE formalism we expect the relation , where is an effective filling fraction given by the Hall quantization, labels the effective magnetic field position of the minima, and represents an effective carrier density. Inset in Fig. 4c shows a plot of versus and indeed, the data follows a linear trend. In spite of the large magnetic field ( T), this remarkable observation indicates that locally the electrons behave as if the magnetic field is reduced to zero. We regard this as compelling evidence of the long-predicted recursive nature of the Hofstadter spectrum where repeated mini fan diagrams emerge within the main one. Interestingly, the linear trend shown inset in Fig. 4c does not pass through the origin, but is vertically offset by . The origin of this offset is unclear but may be related to disorder effects since in this regime the spectrum is not fully gappedKoshino:2006 .
Finally, we discuss the apparent broken symmetries observed in our data. We first note that the most prominent fractal gap states within the lowest Landau level of both devices correspond to positive , but negative quantum numbers. Likewise, the overall fractal gap structure appears stronger on the hole side (negative density values) than the electron side (positive density values). This electron/hole asymmetry results from coupling between BLG and hBN, which, in a single-particle tight binding calculation, tends to break the bipartite nature of the BLG lattice. We further note that our data exhibits complete symmetry breaking of both spin and pseudospin degeneracy, with fractal gaps appearing for both even and odd values of and , whereas only multiples of 4 may be expected in a fully degenerate case. The pseudospin degeneracy, which is related to the spacial inversion symmetry, is lifted due to asymmetric coupling to the substrate, where the bottom graphene layer interacts more strongly with the BN substrate than the top graphene layer. In the high magnetic field regime, Zeeman coupling may break spin symmetry to yield odd integer QHE states. A detailed consideration of these effects can be found in the supplemental information. However, we note that at these fields the Coulomb energy is more than an order of magnitude larger than ZeemanDean:2011 , suggesting that interaction-induced spontaneous symmetry breaking of the internal quantum degrees of freedom may be necessary to understand our experimental observations.
Methods
Devices were fabricated using a co-lamination mechanical transfer technique similar to that described previouslyDean:2010 ; Dean:2011 . Electrical leads consisting of a Cr/Pd/Au metal stack were deposited using standard electron-beam lithography after which the sample was etched into a Hall bar by exposure to oxygen plasma. Graphene/hBN stacks were fabricated on doped Si substrates with a nm oxide layer. More than 20 devices were made in similar way, where 6 devices show similar behavior to that reported here. We focus only on 2 high quality devices in the text, listing other examples in the supplementary materials. In electrical measurements the charge carrier density was varied using the doped silicon as a field effect gate. Four-terminal transport measurements were performed using a lock-in amplifier at 17 Hz with a nA source current. Samples were measured in a 31 T resistive magnet and 3He cryostat (sample in vapour). Longitudinal and Hall conductivities were calculated from the corresponding measured resistance according to and , respectively.
AFM images were acquired after device fabrication was complete, using an Omicron low temperature AFM system operated at room temperature. Imaging was performed using V and Hz. Images were filtered to remove noise.
Gap energies were estimated from the temperature dependence of longitudinal conductivity minima in the thermally activated regime, where is the energy gap, is Boltzmann’s constant and is the electron temperature. Each gap value was determined from the corresponding Arrhenius plot by fitting to the linear regime.
Acknowledgments
We thank A. MacDonald for helpful discussions. A portion of this work was performed at the National High Magnetic Field Laboratory, which is supported by National Science Foundation Cooperative Agreement No. DMR-0654118, the State of Florida and the U.S. Department of Energy. This work is supported by AFOSR MURI, FCRP through C2S2 and FENA. PK and FG acknowledge sole support from DOE (DE-FG02-05ER46215). JK and MI were supported by by the National Science Foundation under Grant No. 0955625.
References
- (1) Hofstadter, D. Energy levels and wave functions of Bloch electrons in rational and irrational magnetic fields. Phys. Rev. B 14, 2239–2249 (1976).
- (2) Wannier, G. H. A Result Not Dependent on Rationality for Bloch Electrons in a Magnetic Field. phys. stat. sol. (b) 88, 757–765 (1978).
- (3) Claro, F. H. & Wannier, G. H. Magnetic subband structure of electrons in hexagonal lattices. Phys. Rev. B 19, 6068 (1979).
- (4) Středa, P. Quantised Hall effect in a two-dimensional periodic potential. J. Phys. C: Solid State Phys. 15, L1299–L1303 (1982).
- (5) Thouless, D., Kohmoto, M., Nightingale, M. & den Nijs, M. Quantized Hall Conductance in a Two-Dimensional Periodic Potential. Phys. Rev. Lett 49, 405–408 (1982).
- (6) MacDonald, A. Landau-level subband structure of electrons on a square lattice. Phys. Rev. B 28, 6713–6717 (1983).
- (7) Koshino, M. & Ando, T. Hall plateau diagram for the Hofstadter butterfly energy spectrum. Phys. Rev. B 73, 155304 (2006).
- (8) Nemec, N. & Cuniberti, G. Hofstadter butterflies of bilayer graphene. Phys. Rev. B 75, 201404(R) (2007).
- (9) Bistritzer, R. & MacDonald, A. Moiré butterflies in twisted bilayer graphene. Phys. Rev. B 84, 035440 (2011).
- (10) Moon, P. & Koshino, M. Energy Spectrum and Quantum Hall Effect in Twisted Bilayer Graphene. Phys. Rev. B 85, 195458 (2012).
- (11) Beugeling, W., Goldman, N. & Smith, C. Topological phases in a two-dimensional lattice: Magnetic field versus spin-orbit coupling. Phys. Rev. B 86, 075118 (2012).
- (12) Weiss, D., von Klitzing, K., Ploog, K. & Weimann, G. Landau level broadening and Van Hove singularities in lateral surface superlattices. Surface Science 229, 88–91 (1990).
- (13) Gerhardts, R., Weiss, D. & Wulf, U. Magnetoresistance oscillations in a grid potential: Indication of a Hofstadter-type energy spectrum. Phys. Rev. B 43, 5192–5195 (1991).
- (14) Albrecht, C. et al. Novel magneto-resistance oscillations in short period lateral superlattices. Physica B: Condensed Matter 249, 914–917 (1998).
- (15) Nakamura, Y., Inoshita, T. & Sakaki, H. Novel magneto-resistance oscillations in laterally modulated two-dimensional electrons with 20nm periodicity formed on vicinal GaAs (111)B substrates. Physica E: Low-dimensional Systems and Nanostructures 2, 944–948 (1998).
- (16) Albrecht, C. et al. Fermiology of two-dimensional lateral superlattices. Phys. Rev. Lett. 83, 2234–2237 (1999).
- (17) Schlösser, T., Ensslin, K., Kotthaus, J. P. & Holland, M. Landau subbands generated by a lateral electrostatic superlattice - chasing the Hofstadter butterfly. Semicond. Sci. Technol. 11, 1582–1585 (1999).
- (18) Albrecht, C. et al. Evidence of Hofstadter’s fractal energy spectrum in the quantized Hall conductance. Physica E: Low-dimensional Systems and Nanostructures 20, 143–148 (2003).
- (19) Geisler, M. C. et al. Detection of Landau band coupling induced rearrangement of the Hofstadter butterfly. Physica E: Low-dimensional Systems and Nanostructures 25, 227–232 (2004).
- (20) Melinte, S. et al. Laterally Modulated 2D Electron System in the Extreme Quantum Limit. Phys. Rev. Lett. 92, 036802 (2004).
- (21) Harper, P. G. Single Band Motion of Conduction Electrons in a Uniform Magnetic Field. Proc. Phys. Soc. A 68, 874–878 (1955).
- (22) Klitzing, K., Dorda, G. & Pepper, M. New method for high-accuracy determination of the fine-structure constant based on quantized Hall resistance. Phys. Rev. Lett. 45, 494–497 (1980).
- (23) Kuhl, U. & Stöckmann, H. J. Microwave Realization of the Hofstadter Butterfly. Phys. Rev. Lett. 80, 3232–3235 (1998).
- (24) Jaksch, D. & Zoller, P. Creation of effective magnetic fields in optical lattices: the Hofstadter butterfly for cold neutral atoms. New J. Phys. 5, 56–56 (2003).
- (25) Xue, J. et al. Scanning tunnelling microscopy and spectroscopy of ultra-flat graphene on hexagonal boron nitride. Nature materials 10, 282–285 (2011).
- (26) Decker, R. et al. Local electronic properties of graphene on a BN substrate via scanning tunneling microscopy. Nano Lett. 11, 2291–2295 (2011).
- (27) Yankowitz, M. et al. Emergence of superlattice Dirac points in graphene on hexagonal boron nitride. Nature Physics 8, 382–386 (2012).
- (28) Dean, C. R. et al. Boron nitride substrates for high-quality graphene electronics. Nature Nanotechnology 5, 722–726 (2010).
- (29) Dean, C. R. et al. Multicomponent fractional quantum Hall effect in graphene. Nature Physics 7, 693–696 (2011).
- (30) Li, G. et al. Observation of Van Hove singularities in twisted graphene layers. Nature Physics 6, 109–113 (2009).
- (31) Wallbank, J. R., Patel, A. A., Mucha-Kruczynski, M., Geim, A. K. & Fal’ko, V. I. Generic miniband structure of graphene on a hexagonal substrate. ArXiv e-prints (2012). eprint 1211.4711.
Supplementary Information
S1 Wannier diagram
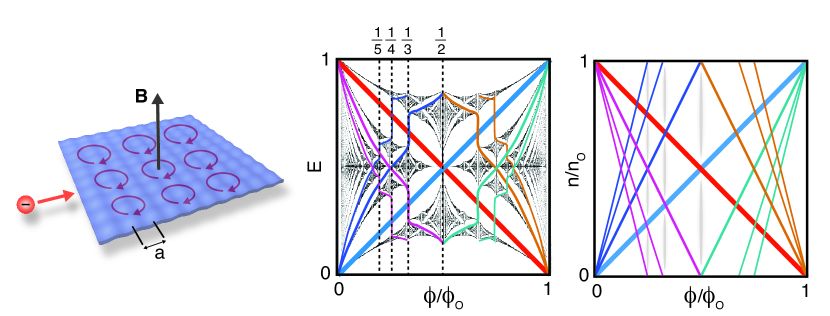
Fig. S1b and S1c illustrates the relationship between the energy-field diagram and density-field diagram. As first demonstrated by Wannier (see main text), all spectral gaps follow linear trajectories in the density-field space according to a dimensionless Diophantine equation (Eqn. 1 in the main text). The Wannier diagram is experimentally accessible by performing transport measurement while varying the carrier density and magnetic field. In the quantum Hall regime, spectral gaps in the spectrum appear as minima in longitudinal resistance, , and quantized plateaus in the transverse Hall resistance, .
S2 Replotting Landau fan diagram in dimensionless units

The relevant quantities in the Landau fan diagram for a 2D electron system with a superimposed periodic potential are the size of the superlattice unit cell, and the number of flux penetrating this unit cell. For a square superlattice the magnetic flux penetrating the unit cell is
| (2) |
where, is the applied magnetic field, is the unit cell area, and is the magnetic flux quantum. For a hexagonal superlattice, the unit cell area is where is the unit cell basis vector, giving
| (3) |
We also normalize the electron density by the inverse area of the unit cell, i.e., , where
| (4) |
We can define the critical field as the field were , i.e. when the magnetic length approaches the scale were there is approximately 1 flux quantum per unit cell area. From 2 and 3, this gives the corresponding critical magnetic field
| (5) |
The same analysis for a square lattice gives . Fig. S2 shows the critical field versus unit cell wavelength. The ideal unit cell length is highlighted in the grey shaded region, spanning the magnetic field range from a few Tesla up to approximately 40 Tesla.
S3 Moiré superlattices in bilayer graphene on hBN
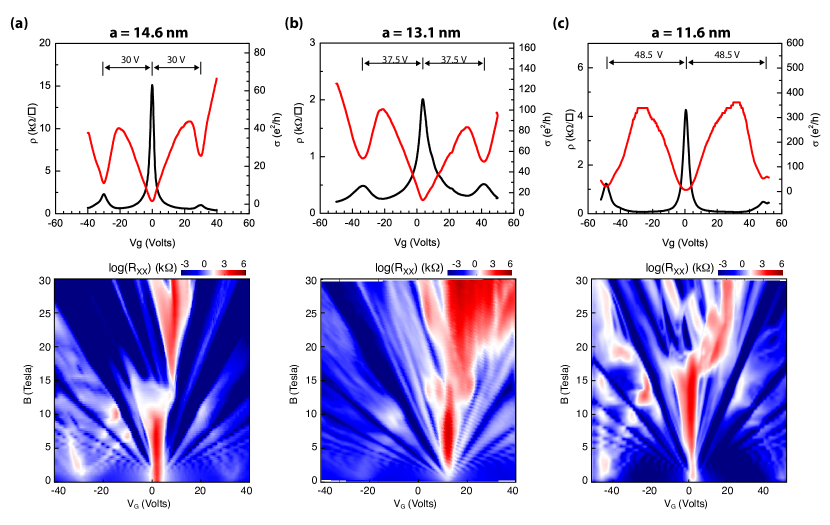
Fig. S3 shows three different bilayer graphene/hBN devices that exhibit modulated transport due to the presence of a moiré pattern. Device s1 (Fig. S3a) corresponds to the device in Fig. 2 of the main text, with the longest moiré wavelength observed in our devices, s3 (Fig. S3c) corresponds to Fig. 3 of the main text, with the shortest moiré wavelength amongst our devices. Device s2 (Fig. S3b) shows a device with an intermediate moiré wavelength. Assuming a filled band model the moiré wavelength was determined from the satellite peak position according to
| (6) |
where is the field-effect density at the satellite peak position, where is the unit cell area of the moiré pattern (assuming hexagonal symmetry; see Fig. 1 in the main text) with the moiré wavelength, is the electron spin degeneracy and is the valley, or pseudospin, degeneracy. is calculated according to a standard parallel plate capacitor model to be , where is the geometric capacitance, is the gate voltage corresponding to the position of the satellite resistance peak and is the gate voltage corresponding the central charge neutrality peak. Substituting back into equation 6 and solving for the moiré wavelength gives
| (7) |
For the three devices in Fig S3, the satellite peaks appear at 30 V, ,37.5 V, and 48.5 V, giving moiré wavelengths 14.6 nm, 13.1 nm and 11.6 nm, respectively.
S4 Theoretical Spectrum for bilayer graphene on hBN
The Diophantine equation represents a universal set of constraints describing all possible gaps within the Hofstadter spectrum. Which gaps remain open for a particular device depends critically on the details of the system. Fig. S4a shows the calculated Hofstadter spectrum for Bernal-stacked bilayer graphene oriented to hBN. Here graphene and hBN are modeled by tight-binding honeycomb lattices with the lattice periods nm and nm, Liu_et_al_2003a respectively. We assume that Bernal graphene bilayer and hBN monolayer are aligned with zero rotation angle, and the ratio between the two lattice constants is round to a rational number to give a finite moire superlattice period nm. We assume the interlayer distance of bilayer grpahene to be 0.335 nm and that between hBN and graphene 0.322 nm Giovannetti_et_al_2007a . We consider only a orbital state on each atomic site, and set on-site potential to 0, 3.34 eV and eV for C, B and N atoms, respectively. Slawinska_et_al_2010a For the hopping amplitudes between different sites, we adopt the Slater-Koster parametrization used for twisted bilayer graphene Moon_and_Koshino_2012a , irrespective of combination of atoms. To compute the low-energy spectrum in magnetic field, we take the low-lying Landau levels ( eV) of isolated bilayer graphene as the basis, Moon_and_Koshino_2012a and the coupling with hBN states in the high-energy region is included as on-site potential on the bottom graphene layer (faced to hBN) in the second-order perturbation.
In Fig. S4b, the energy spectrum is replotted as a Wannier type diagram where the energy axis is replaced by the normalized density. Fractal gaps inside the lowest Landau levels (between ) are plotted as black circles with radius proportional to the gap size. The theoretical calculation correctly predicts the experimentally observed asymmetry in the lowest Landau level (see also Fig. 3 in the main text) where fractal gaps originating from are much stronger than . Related, the calculation correctly identifies a partial lifting of the 4-fold degeneracy in graphene, evident as features associated with , rather than only multiples of . This results from broken valley degeneracy due to inversion-asymmetric coupling where the bottom graphene layer interacts more strongly with the BN substrate than the top graphene layer. Several details in the theoretical spectrum disagree with experimental observations. For example, strong mini-gaps, predicted on the electron side, are not apparent in the experiment. Additionally, in experiment all symmetries are broken at high field, with fractal gaps corresponding to both odd and even integer values of and appearing, whereas the theoretical spectrum remains two-fold degenerate at all fields since the spin Zeeman splitting is neglected.
In Fig. S4c, the Wannier diagram is recalculated including spin Zeeman splitting () and interlayer potential difference between the top and the bottom layer of bilayer graphene. The latter is assumed to be the sum of the constant term meV and the gate-induced term proportional to electron density with the relative dielectric constant . To get a better agreement, we also magnified coupling strength between graphene and hBN by a factor about 1.4 compared to the original (Fig. S4c). While additional symmetry breaking states appear, exact correspondence with our data is difficult to achieve. The model depends sensitively on physical parameters, such as interlayer coupling strength and interlayer potential difference, that are not well known. Moreover, this model does not account for many-body interaction, which may play a substantial role at these large magnetic fields. Further theoretical and experimental work is necessary to better understand the details of the observerd fractal energy spectrum.
S5 Temperature dependence
References
- (1) P. Moon and M. Koshino, Phys. Rev. B 85, 195458 (2012).
- (2) L. Liu, Y. P. Feng, and Z. X. Shen, Phys. Rev. B 68, 104102 (2003).
- (3) G. Giovannetti, P. A. Khomyakov, G. Brocks, P. J. Kelly, and J. van den Brink, Phys. Rev. B 76, 073103 (2007).
- (4) J. Sławińska, I. Zasada, and Z. Klusek, Phys. Rev. B 81, 155433 (2010).