Neutral and ionized gas around the post-Red Supergiant IRC +10 420 at au size scales††thanks: Based on observations at ESO, and in particular with VLTI, proposals 079.D-0123(A), and 383.C-0166(A) and X-Shooter, proposal SV-9434
Abstract
Context. IRC +10 420 is one of the few known massive stars in rapid transition from the Red Supergiant phase to the Wolf-Rayet or Luminous Blue Variable phase.
Aims. The star has an ionised wind and using the Br line we assess the mass-loss on spatial scales of au.
Methods. We present new VLT Interferometer AMBER data which are combined with all other AMBER data present in the literature. The final dataset covers a position angle range of and baselines up to 110 meters. The spectrally dispersed visibilities, differential phases and line flux are conjointly analyzed and modelled. We also present the first AMBER/FINITO observations which cover a larger wavelength range and allow us to observe the Na i doublet at 2.2 m. The data are complemented by X-Shooter data, which provide a higher spectral resolution view.
Results. The Br emission line and the Na i doublet are both spatially resolved. After correcting the AMBER data for the fact that the lines are not spectrally resolved, we find that Br traces a ring with a diameter of 4.18 mas, in agreement with higher spectral resolution data. We consider a geometric model in which the Br emission emerges from the top and bottom rings of an hour-glass shaped structure, viewed almost pole-on. It provides satisfactory fits to most visibilities and differential phases. The fact that we detect line emission from a neutral metal like Na i within the ionized region, a very unusual occurrence, suggests the presence of a dense pseudo-photosphere.
Conclusions. The ionized wind can be reproduced with a polar wind, which could well have the shape of an hour-glass. Closer in, the resolved Na i emission is found to occur on scales barely larger than the continuum. This fact and that many Yellow Hypergiants exhibit this comparatively rare emission hints at the presence of a “Yellow” or even “White Wall” in the Hertzsprung-Russell diagram, preventing them from visibly evolving to the blue.
Key Words.:
stars: evolution - stars: mass loss - supergiants - stars: individual IRC +10 420 - techniques: interferometric1 Introduction
The star IRC +10 420 is of central importance to our understanding of the massive star evolution across the Hertzsprung-Russell diagram from the Red Supergiant to the Wolf-Rayet or Luminous Blue Variable (LBV) phase. There are strong indications that its photospheric temperature increased very rapidly, by 2200 K over 30 years. IRC +10 420 has currently attained mid-A spectral type (see Oudmaijer 1998; Klochkova et al. 2002). Its distance of 3.5 to 5 kpc implies a luminosity typical for a star with an initial mass of around , which places it close to the Humphreys-Davidson limit in the Hertzsprung-Russell diagram (Jones et al. 1993). The spectral type makes IRC +10 420 a member of the class of Yellow Hypergiants (de Jager 1998), while its infrared excess due to circumstellar dust indicates that it was only recently undergoing extreme mass-loss, presumably in the Red Supergiant phase (Oudmaijer et al. 1996). The number of known post-Red Supergiants is very small, Oudmaijer et al. (2009) discussed two such examples, IRC +10 420 and HD 179821, while Lagadec et al. (2011) recently proposed that IRAS 17163-3907 (the “Fried Egg” nebula, so named because of its double shell structure) belongs to this class too.
The intricate circumstellar environment of IRC +10 420 has various distinctive components on different spatial scales, an overview of which can be found in de Wit et al. (2008), see also Tiffany et al. (2010). Of importance to the study presented here is the fact that the dusty environment responsible for the strong near-infrared excess has been spatially resolved with speckle interferometry at 2.11m (Blöcker et al. 1999). They found the inner radius of the dust shell to be 70 milli-arcsecond (mas), consistent with the dust condensation temperature. In addition, they found that about 60% of the -band continuum emission remains unresolved (see also Monnier et al. 2004), and this emission is identified with the photospheric radiation from the star itself. Further 1D-modelling led them to conclude that IRC +10 420 is surrounded by two separate shells centred on the star with diameters of and .
Interior to the dusty environment, IRC +10 420 displays an ionised wind, which is unusual for its spectral type. Two dedicated studies using the VLT Interferometer (VLTI) and the near-infrared AMBER instrument have aimed at elucidating the issue of the shape of the ionised wind on milli-arcsecond spatial scales. De Wit et al. (2008) show that the Br emission region is spatially resolved and derive a size of 3.3 mas along the employed VLTI baseline. Under the assumption that the transition is optically thick, they find that the total observed line flux is too small if the emitting region were a circular disk on the sky. Instead, de Wit et al. conjecture that it is possibly elongated, a geometry with the same radius, but smaller projected area, analogous to the H emission (Davies et al. 2007). Alternatively, the total line flux can be accounted for if the geometry resembles a ring-like structure, which is proposed in Driebe et al. (2009, hereafter D09). The latter publication presents observations employing two triplet VLTI configurations using the Auxiliary Telescopes for a single position angle on the sky and with AMBER in low spectral resolution mode. A stellar diameter of approximately 1.0 milli-arcsecond was determined using this dataset. These authors also present a single Unit Telescope (UT) triplet with AMBER in high spectral resolution, resolving both spatially and spectrally the Br emission line of IRC +10 420. The differential phase of the spectrally resolved line (probing the photo-centre) shows an intriguing profile and the authors’ efforts to reproduce the observables with two-dimensional radiative transfer modelling remained unsuccessful. As a corollary, the geometry of the ionized wind and mass-loss of IRC +10 420 on milli-arcsecond scales continues to pose a serious challenge.
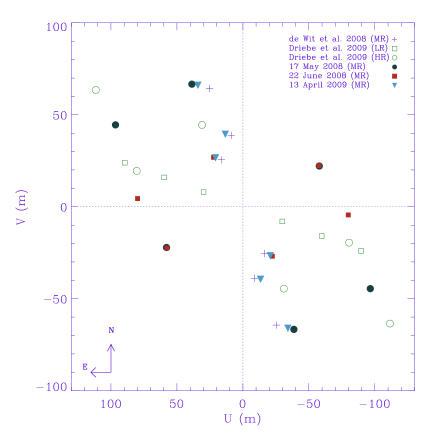
In this third VLTI/AMBER study of IRC +10 420 we present six new baselines which, together with the previously presented ones, add to a total position angle coverage of for the Br emission (see Fig. 1). Our analysis of the ionized emission, which we present here, includes all the previously published interferometric AMBER data of the object. In addition, the use of the fringe-tracker FINITO on one set of baselines provides visibility and phase information for a much larger wavelength range. We report and interpret for the first time spatial information of a neutral metallic line in addition to the hydrogen recombination line. The inclusion of the high spectral resolution data in D09 allows us to re-assess the much larger set of medium spectral resolution data in hand and we therefore revisit the object and the data taken thus far. In addition, we obtained X-Shooter data of IRC +10420 during the science verification phase, and present the part of the spectrum that overlaps with the AMBER data.
In Sect. 2 we present the new observations with the VLTI and the data reduction of AMBER in medium spectral resolution mode. We discuss in this section the effect of spectral resolution in case of unresolved spectral lines on the derived characteristic size scales. In Sect. 3 we present the new results. In the discussion section 4, a geometrical model is presented. We discuss the Na i emission, and explain this in the framework of the presence of a pseudo-photosphere. By extrapolation, the presence of this, comparatively rare emission line, in the spectra of other Yellow Hypergiants leads us to speculate that this is a general feature, and that all such objects have a pseudo-photosphere.
| Config. | Date | Station | B | P.A. | DIT | ||||||
|---|---|---|---|---|---|---|---|---|---|---|---|
| (m) | ( | (s) | (ms) | (arcsec) | |||||||
| A | 2008-05-17 | U1-U3 | 77.1 | 30.1 | 0.05 | 2.8 | 0.68 | 9 | 1000 | ||
| U3-U4 | 62.0 | 110.9 | |||||||||
| U4-U1 | 106.3 | 65.3 | |||||||||
| B | 2008-06-22 | U2-U3 | 34.9 | 39.6 | 0.05 | 2.4 | 0.78 | 9 | 1000 | - | |
| U3-U4 | 61.8 | 111.2 | - | ||||||||
| U4-U2 | 80.0 | 86.8 | - | ||||||||
| C1 | 2009-04-13 | U1-U2 | 41.8 | 19.2 | 0.187 | 4.2 | 1.1 | 5 | 200 | ||
| U2-U3 | 34.0 | 37.3 | - | ||||||||
| U3-U1 | 74.8 | 27.8 |
Calibrated visibilities correspond to 20% frame selection for config. A, and 5% for config. C. The Detector Integration Times (DIT) are the integration times per individual exposure. 1 Observations with FINITO.
2 Observations and data reduction
2.1 AMBER spectro-interferometry
New observations of IRC +10 420 were obtained with the UTs and the AMBER instrument (Petrov et al. 2007) on three separate occasions. All data were taken in the Medium Resolution (MR) mode, while we present the first MR observations of the object taken with the FINITO fringe-tracker (Gai et al. 2004). The use of FINITO in this mode extends the observed wavelength range substantially compared to the previous studies, and includes the Na i 2.2 m doublet which has long been known to be in emission (Thompson & Boroson, 1977, and see below).
We observed IRC +10 420 twice in service mode, on the nights of 17th May and 22nd June 2008 (ESO cycle P79), and once in visitor mode on the night of the of 13th April 2009 (ESO cycle P83). The VLTI configurations on these occasions were the U1-U3-U4, U2-U3-U4 and U1-U2-U3, respectively, which we further refer to as A, B, and C. The technical overview of the observations is given in Table 1. The uv-plane coverage of all the published VLTI-AMBER data with various spectral resolutions taken to date is shown in Fig. 1. This includes the medium spectral resolution observations published in de Wit et al. (2008) and the low and high spectral resolution observations presented in D09. Given its Northern declination, this is arguably the most complete coverage possible for the object.
The AMBER instrument was set-up in the medium spectral resolution mode which provides a spectral resolution of 1500 or . Configurations A and B cover a wavelength range between 2.12 and 2.19 m, and includes the Br hydrogen recombination line at 2.167 m. This transition was the main subject of the two previous AMBER studies on IRC +10 420 . The instrumental set-up of configuration C was different as it included the fringe-tracker FINITO. It allows higher precision interferometry, and a much larger wavelength range can be probed and read-out. In the present case it runs from basically 2.0 to 2.3 m. This set-up therefore allows the spatial study of the Na i doublet at 2.206 and 2.209 m, which is known to be in emission. The doublet was first reported by Thompson & Boroson (1977), and later by Hanson et al. (1996) and Humphreys et al. (2002). Importantly, the Na i emission had already been detected before the onset of Br emission was discovered by Oudmaijer et al. (1994). As the rest of the AMBER-FINITO spectrum is featureless, we restrict ourselves in the discussion to the 2.16-2.21 m wavelength range which covers the emission lines present.
All data were reduced using the amdlib (version 3.0) software package dedicated to AMBER data and provided by Jean-Marie Mariotti Centre. Atmospheric jitter causes the interference fringe pattern to be smeared out, leading to artificially low visibilities. Short integration times are thus mandatory in order to limit smearing in the absence of a fringe-tracker, and good atmospheric conditions (coherence time, seeing) are essential. A measure of successfully interfering the three telescope beams and the recording of fringes is provided by the amdlib package parameter signal-to-noise ratio (SNR, Tatulli et al. 2007b). It is based on the weighted summing of the correlated flux over all spectral channels per integration time (a so-called interferogram). Currently, the recommended approach regarding these data quality degrading effects is to make a frame selection based on an SNR criterion, and discarding low SNR frames up to a certain cut-off (e.g see Tatulli et al. 2007a). Overall the values of the instrumental visibilities depend strongly on the fraction of frames selected, as the visibilities are biased towards smaller values when more frames are included. However, significant for a study such as the present one, is that the differential visibilities, i.e. the visibility of the emission lines compared to the continuum, are not very sensitive to frame selection (see de Wit et al. 2008).
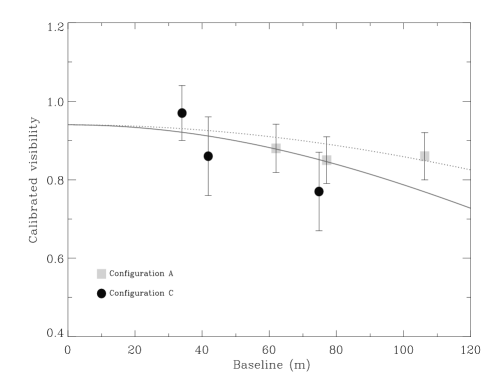
The observations in configuration A suffered from an abrupt change in weather conditions. The coherence time nearly halved in the course of the target observations, and the presence of thin cirrus was reported in the meteorological report of these service observations. Assessment of the data quality led us to consider only the first four files of a set of in total nine observation files each consisting of 1000 interferograms. The in Table 1 refers to these four files. The equally bright calibrator star HD 175743 (, uniform disk diameter 1.012 mas; Lafrasse et al. 2010) was observed under relatively constant weather conditions, albeit with a somewhat smaller coherence time than during the target observations. The calibrator star has a K 1 giant spectral type, and does not show any spectral absorption features in its flux spectrum at the employed spectral resolution. It was observed within 30 minutes of the target and again nine files were secured. From the spread around the mean, we determined a statistical uncertainty of 4-5% on the squared visibilities for any frame selection criterion. The error on the calibrated visibilities is 7%. The calibrated continuum visibilities for configurations A and C are presented in Fig. 2. They are nearly constant as function of baseline length, and this would indicate that the size of the continuum is somewhat smaller than the one proposed in D09.
The target observations in configuration B were performed under stable atmospheric conditions, although some thin cirrus was present. Again nine observations were performed with similar data quality. We retain all files in our analysis. The same calibrator star as for configuration A, HD 175743, was used, but only five observation sets were secured. The weather conditions were relatively stable and the calibrator observations were performed within 15 minutes of the target object. A statistical uncertainty between 4.5-5.5% on the squared visibilities of the calibrator was determined from the frame selection criterion. However, the absolute calibration of the visibilities delivered visibilities in excess of unity for any applied frame selection (for example they were of order 1.1 for a 20% frame selection) and are, obviously, unphysical. The instrument set-up and observing logs were checked, but no obvious reasons for this problem could be identified. We discard the absolute calibration for this set of observations.
Observations performed in configuration C were done with the assistance of the fringe tracker FINITO (Gai et al. 2004), The use of the fringe tracker stabilizes the position of the fringes on the AMBER detector allowing a longer integration time and a better SNR. The coherence time was stable for the observations, but the seeing was rather poor between 1.05 and 1.25″. As a result, FINITO was not able to lock continuously on the fringes, and, given the longer integration times on AMBER, the frame selection criterion had to be chosen more stringent. We retained only 5% of the frames leading to quite large uncertainties in the observables as shown in Fig. 6. The baseline configuration of this dataset is close to the one published in de Wit et al. (2008). In total 5 files of 200 frames were secured for both IRC +10 420 and the somewhat brighter G8 III calibrator HD 194013 (K=, uniform disk diameter 1.152 mas; Lafrasse et al. 2010). Stars of the latter spectral type and luminosity class show Br and Na i absorption, albeit quite minor (Ivanov et al. 2004).
In Fig. 2 the calibrated AMBER continuum visibilities for configuration A and C are presented as function of baseline length. The new data include the longest VLTI baseline so far and are thus well suited to verify the size of the continuum region derived from smaller baselines. To facilitiate a direct comparison with D09, we compare the calibrated visibilities to a model of a Gaussian-shaped emitting region with a full-width-at-half maximum (FWHM) of 0.98 mas and of 0.70 mas respectively. This former value corresponds to the stellar diameter derived by D09 based on the low spectral resolution AMBER data, and baseline lengths extending up to 96 meters. Future observations at longer baselines, such as e.g. provided by CHARA should allow us to distinguish between the various possible models for the stellar photosphere such as a uniform disk vs. a Gaussian, as applied here. Note that the model visibilities in Fig. 2 do not reach unity at zero spacing but rather 94%, because of the continuum contribution by the over-resolved dust component within the field of view of the UTs. This fraction was determined from the field of view analysis for the UTs presented in D09. This larger scale dust emission has been modelled previously in e.g. Blöcker et al. (1999).
The new AMBER data are largely consistent with an emitting region of 0.98 mas, although the measurement at the longest baseline hints at a smaller diameter. A simple calculation shows that for a luminosity of IRC +10 420 of (Blöcker et al. 1999) and a mid-A spectral type (Oudmaijer et al. 1996), a stellar diameter of mas can be expected (see Fig. 2). This value is independent of the adopted distance. The substantial uncertainties on the calibrated visibilities presented here render the reality of this apparent discrepancy unsure, and more precise measurements and longer baseline lengths are required for a better assessment. Moreover we note that the calibrator star used with the FINITO observations is somewhat brighter and therefore could introduce a bias towards lower calibrated target visibilities. For this paper, we adopt a value for the photospheric diameter at the K band of 0.98 mas in order to facilitate direct comparisons with Driebe et al. (2009). The continuum visibilities for the new observations presented in this paper are adopted to be the values of a Gaussian with a FWHM of 0.98 mas taking into account the 6% flux contribution by the over-resolved dust emitting structure.
Finally, we note that in medium spectral resolution the Br line profile has a FWHM corresponding to the instrumental resolution, and thus remains spectrally unresolved. The high spectral resolution (HR) observations (D09) resolve the Br emission line, which has a FWHM of , a line to continuum ratio of 2.105 at line-centre, and an equivalent width (EW) of . The MR spectral setting has or at the Br transition, which clearly renders the line profile unresolved. The MR data have the same EW, but as a consequence of the lower resolution the line is smeared out and has a smaller line-to-continuum ratio of 1.45. The fact that the lines are spectrally unresolved will, in a completely analogous manner, also lead to a smaller drop in visibility across a line. This in turn results in derived size scales that are too small. In Sect. 3.4 we will perform a consistency check between the data with different spectral resolution before analyzing the combined sets of interferometric AMBER data on IRC +10 420 .
2.2 X-Shooter spectroscopy
IRC +10420 was observed on the 15th of August 2009 (UT), during the Science Verification observations with the X-Shooter instrument. X-Shooter takes the spectrum 0.3 to 2.4 m in one shot, using three arms which cover the UV-blue, visible and near-infrared parts of the spectrum respectively (D’Odorico S. et al. 2006). It is mounted on UT2 (Kueyen) of the ESO-VLT telescopes in Mount Paranal, Chile. The observations were conducted in nodding mode, the nodding step was 6 arcsec. The slit width was 1.0 arcsec in the UV-Blue arm, and 0.4 arcsec in both the visible and the near-infrared arms. The data were reduced using the X-Shooter pipeline provided by ESO (Modigliani et al. 2010), and most of the spectrum and the details of their observations and reduction will be presented elsewhere.
Here we present data from the near-infrared spectrum covered by our AMBER observations. Although the on-target spectra were of good quality, the nodded, “sky” position spectra around Br and the Na i doublet at 2.20 m were particularly affected by bad pixels, and a satisfactory correction for these proved difficult. We therefore present the data from the first 8 on-target spectra only. The total integration time for these was 8 seconds, resulting in a signal-to-noise ratio in the continuum around Br of more than 100. This quality was matched by that of the object HD 183143, a B-type supergiant only a few degrees away from IRC +10420, and which was used as a telluric standard. The data were reduced by simply extracting the on-target spectra and subtracting the background. Given that IRC +10420 is very bright (K 3.5), the background is negligible and not having applied the normal target-sky subtraction does not affect the data at all.
The individual spectra were co-added after correcting for the slight sub-pixel wavelength shifts between them. Wavelength calibration was performed by identifying several telluric absorption lines in the 2.15-2.2 m region using the catalogue by Hinkle et al. (1995). The resulting wavelengths should be accurate to less than a tenth of the spectral resolution which was determined to be around 10,000 from measuring the FWHM of many narrow, unresolved, telluric absorption lines in the spectrum. The seeing as measured from the spatial profile of the spectrum was 1.7 pixels, corresponding to 0.35 arcsec.
Finally, the spectrum of IRC +10420 was divided by that of the telluric standard star HD 183143 to remove the telluric absorption features. Its spectrum was first corrected for its underlying Br absorption line, which was removed using multiple Gaussian fits to its clearly visible absorption profile.
3 Results
3.1 Short description of the spectrum
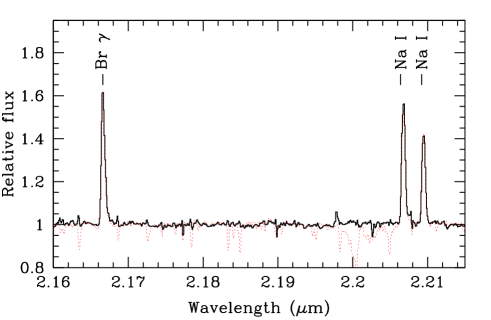
The X-Shooter spectrum in the wavelength range covered by our AMBER-FINITO observations is shown in Fig. 3. Both Br and the Na i doublet at 2.2m are in emission. The line-to-continuum ratio of the Br line is 1.6, which is significantly smaller than the value of 2.1 reported by D09. This may at first sight sound surprising as the spectral resolution of the X-Shooter data is comparable to that of AMBER’s high resolution setting. However, contrary to AMBER which over-resolves the dust continuum spatially, the X-Shooter spectrum includes the K-band continuum excess emission. The line strength, measured in terms of EW as well as line-to-continuum ratio, is therefore smaller in the X-Shooter data than in the AMBER data. As we will discuss later, the same is the case for the Na i doublet emission.
The line widths of the three emission lines are similar, of order 70 km s-1, which, corrected for the spectral resolution, corresponds to 63 km s-1. This width is comparable to most optical emission lines measured by Oudmaijer (1998). The central velocities of the emission lines are also similar, at 66 km s-1 (Local Standard of Rest, LSR) the lines are blue-shifted by about 10 km s-1 with respect to the systemic velocity of 77 km s-1 measured by Oudmaijer et al. (1996) from the CO (sub-)mm rotational lines. The equivalent width of the Br line is 4.1. This compares well with the measurement by Humphreys et al. (2002) who reported a Br EW of in their 2000 spectrum. The EW of the Na i emission is 3.7 and 2.9 for both components respectively, giving a total EW for the doublet of 6.6 . Typical errors on the EW values are 5-10 per cent.
3.2 The spectro-interferometry, visibilities and phases
The spectra, calibrated visibilities and differential phases for each AMBER configuration are shown in Figs. 4, 5, and 6. The panels of each figure show the reduced AMBER observables for each baseline: the flux (top), visibility (middle) and the differential phase (bottom) spectra. No wavelength calibration has been performed, and the spectra have simply been shifted in wavelength in order to match the emission line with the Br rest wavelength. The spectra have been divided by the interferometric calibrator star in order to remove telluric absorption components. What was evident in de Wit et al. (2008) and D09 is also observed now at different baselines and position angles: a strong line effect over Br in visibility and differential phase. The drop in visibility increases with baseline, i.e. the line is best resolved at the longer baselines, implying that the line emitting region is small, of order the resolution corresponding to the longest baselines. The equivalent width of Br line is in the AMBER spectrum taken in 2006 and the same is measured from the high resolution AMBER spectrum taken in 2008. The flux spectra of the new baselines reveal the same EW of . These values of the Br EW suggest that the line has not appreciably changed over the past three years. This is in line with the EW of the H emission line that varied little over that same time-span (Patel et al. 2008).
A new result regarding the characteristic size-scales of the emission line regions, and thanks to FINITO, involves the Na i transition for which we detect a faint but significant line effect in the visibility on the longest baseline of configuration C (Fig. 6). The small drop in visibilities at the Na i transition shows that this emission region is smaller than that of Br but larger than the photosphere of the star. A very rough estimate for the characteristic size-scale of the Na i emission is obtained by calculating the line visibility using the flux-ratios and compare this to what is expected for a Gaussian distribution at the same spatial frequencies. Ignoring for the moment that the line is spectrally unresolved and that the underlying star most likely displays photospheric absorption, the line flux implies a size scale of order two times that of the photosphere.
The Na i line emission does not show a change in differential phase across the lines unlike Br. Although there is an apparent effect close to the Na i lines, it does not coincide with the wavelength of this doublet, and further inspection of the data reveals that the SNR is too low to permit a robust measurement of a differential phase at this transition.


3.3 The field of view
We reiterate that the AMBER line-to-continuum ratios and EWs are higher than those measured from the normal long-slit, X-Shooter, spectrum. The reason for the discrepancy in EW between AMBER spectra and long-slit spectroscopy is well understood; whereas the Br line emission comes from well within the (limited) field of view of the interferometric observations, the dust continuum emission falls largely outside the field. This enhances the line flux with respect to the remaining, mostly stellar, continuum.
For example, by adding 50% of continuum (i.e. adding 0.5) to the total continuum emission reduces the EW measured from the AMBER flux spectrum from to . For reference, adding only 40% continuum leads to a Br EW of . In case of the Na i doublet, the X-Shooter EW measured over both lines is . The average AMBER spectrum however shows a Na i EW of . Just like the Br emission, here we also need to add around 40% continuum emission to obtain the EW of the transition taken with a long-slit spectrum. This leads us to conclude that the Na i emission almost entirely arises from within the interferometric field-of-view of about 60 mas, which is consistent with the smaller visibility compared to Br and indicates that the emitting region falls well within that of the Br emission.
3.4 Consistency check between MR and HR visibilities
We combine the sets of MR and HR visibilities for the Br transition in order to verify the derived characteristic length scale of the ionized wind by use of geometrical models. The large P.A. coverage presented in this paper allows us to establish any deviations from a centro-symmetric emitting region on milli-arcsecond scales, which is relevant in light of previous claims (e.g. Davies et al. 2007). As noted earlier, the Br emission remains spectrally unresolved in the MR observations, reducing the difference between line and continuum visibilities. Usage of spectrally unresolved visibilities results in an underestimate of the true size of the line emitting region. Here we perform a consistency check between the high spectral resolution and medium spectral resolution visibilities by applying a geometrical model, originally proposed in D09.
The D09 geometrical model consists of three components: (1) an over-resolved continuum emitting region, most of whose emission falls outside the AMBER field-of-view of 60 mas when the UTs are employed; (2) a star represented by a Gaussian with a FWHM of 0.98 mas; and (3) an ionized wind in the form of a ring with diameter of 4.18 mas. D09 estimate that 6% of the total continuum flux comes from the dust shell within the VLTI-AMBER field of view, the remainder of the continuum flux in the AMBER spectrum is due to the star.
We should note that these values were adopted by D09 for the entire wavelength ranges. However, the fractional flux contribution from the dust continuum, like that of the stellar continuum, changes at the Br line centre, where the line emission of course also contributes to the total flux. The over-resolved component’s contribution can then only be 2.9% of the total flux where the emission line peaks. Thus, when we correct for this, the ionized ring contributes 52.5% at line centre, and the star 44.6% to the total flux, assuming for now that there is no photospheric absorption. Inserting these corrected flux contributions and the associated absolute calibration of the HR visibilities (see D09) in the geometrical model, we find that the HR visibilities are not well reproduced. This is especially true for the longest baseline, where the relatively large contribution from the small star pushes the geometrical model visibilities to higher values. The discrepancy can be remedied by increasing the relative flux contribution of the ionized wind to 58%, which in turn implies that IRC +10 420 has an atmospheric absorption of 0.88, line-to-continuum ratio. Some values are thus slightly different from those found in D09, because of their oversimplified assumption of constant fractional continuum-flux contributions over the whole wavelength range.
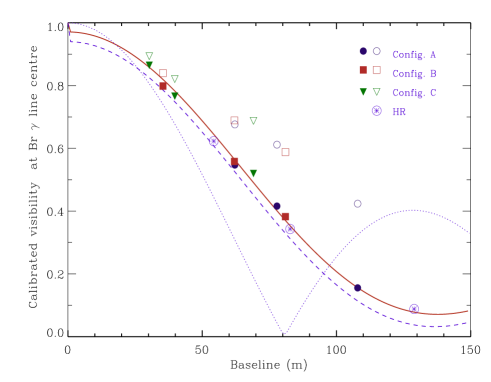
With the model values for the respective sizes in place, we can calculate the visibilities for any baseline-length and any spectral resolution. The resolved flux profile is approximated by a simple Gaussian profile. Spectrally unresolved visibilities are calculated by applying the flux ratios according to the convolved flux line profiles (stellar photosphere and ionized wind) adopting a Gaussian kernel with a FWHM equal to the spectral resolution under consideration. Using this approach, we can compute the multiplicative factor that corrects the observed MR visibilities for spectral smearing. In this way we can check for consistency between the two MR and HR data sets. The results are presented in Fig. 7 for the total visibility at line centre. The open symbols represent the observed MR observations, the filled symbols are the visibilities corrected for spectral resolution. Also plotted are the three observed HR visibility points. The corrected MR visibilities are consistent with the geometrical model derived from the HR data and we find a size of 4.18 mas for the diameter of a ring-shaped ionised wind. It may be clear how significant the effect of spectral resolution in this case is. Based on the MR data alone, one would derive a value for the diameter which is about a factor of 1.5 too small (de Wit et al. 2008). Figure 7 also shows that the emitting region is very close to centro-symmetric, at least at the line-centre of the Br transition, because the uv-coverage extends in P.A. a range of nearly 180°.
A third important conclusion that can be drawn from Fig. 7 is that the data for baselines longer than approximately 80m probes the higher order lobes of the 4.18 mas ring. This is illustrated in Fig. 7 by the dotted line, which represents the analytical visibility function for a simple ring. This effect, as we will detail in Sect. 4, is key to understanding the inversions of the differential phase in the HR data.
In conclusion, Fig. 7 shows that (1) the spectrally unresolved medium resolution visibilities are consistent with the spectrally resolved high resolution observations, that (2) the visbilities are consistent with an ionized wind that has a ring(-like) morphology, and that (3) higher order visibility lobes are probed for the ionized wind at baselines longer than 80m.
4 Discussion
We have achieved a large increase in uv-coverage of AMBER observations in the MR setting of the enigmatic star IRC +10420. Interferometric studies so far have concentrated on the ionized wind as traced by the Br emission. This emission remains spectrally unresolved in the MR AMBER setting. Observations in the high spectral resolution mode were presented for a single baseline in D09 resolving the Br spectral profile. We will discuss our new observational results in concert with the spectrally resolved findings.
4.1 Geometry of the Br line emission region, revisited
The spectrally resolved Br emission line of IRC has intriguing properties that the 2-D axisymmetric radiative transfer code CMFGEN (Busche & Hillier 2005) cannot reproduce (D09). Whereas the visibilities are reasonably approximated, the model fails to reproduce the Br flux profile, its amplitude, and the profile and amplitude of the phase signal. This led D09 to conclude that the line emitting region deviates from spherical symmetry which they accounted for by introducing an ad-hoc opacity screen. The main challenge with the (differential) phase signal is its profile: the photocentres of the blue- and red-shifted part of the wind are on the same side of the continuum. On the two longest VLTI baselines of the HR observations, the differential phase inverts giving the overall spectral phase profile an appearance similar to the letter “W”, with a stronger signal on the red-shifted part (see Fig. 9).
In order to understand this, we recall our analysis in the previous section which supports the idea that at baselines exceeding 80m the 2nd lobe of the Br emitting ring visibility function is probed. A change in the visibilities from one lobe to another is accompanied by a 180o phase flip. However, since not all emission at the Br wavelength is resolved, the observed change will be smaller. The visibility profile on the 128.9m baseline (see Fig. 9) displays a flat bottom and the phase discontinuities correspond closely to the visibility discontinuities. These properties constitute evidence for a transition into the 2nd lobe of the Br emitting ring.
4.1.1 A geometric model
Instead of using an advanced radiative transfer code, we attempt here to find a simple geometry that would provide insight into the physics of the ionized wind on milli-arcsecond size scales. Results from such an exercise will constitute a good starting point for intensive radiative transport modelling. An important observation is that the peak flux of the Br lines is blueshifted by 10 km s-1 from the systemic velocity. It has been suggested that this net blueshift is because part of the redshifted wind is actually obscured by the star (Oudmaijer et al. 1994). In this context, it is worth mentioning the multi-epoch HST observations by Tiffany et al. (2010) from which the authors find support for the idea that the IRC +10 420 system is viewed close to pole-on. The HR phase profiles (but also the flux profiles) preclude a Br ring in Keplerian rotation, as this would result in different phase shifts for the blue- and redshifted emission as for example illustrated in Kraus et al. (2012).
As a first approach we assume that the wind is polar, consisting of two spatially distinct yet similar components. For simplicity reasons and because the structure at line-centre is consistent with a ring shape (Sect. 3.4), we assume a blue-shifted and a red-shifted ring within the interferometer’s field of view. The Br emitting rings could make up the top and bottom part of an hour-glass shaped wind geometry. Such a geometry is inspired by the photogenic “Hourglass Nebula” (the planetary nebula MyCn 18) which shows evidence for multiple rings in H (see Dayal et al. 2000). Finally, only a certain part of the receding ring can be seen, because the material is partly obscured by the stellar disk. This is possible, provided that the system is viewed close to pole-on.


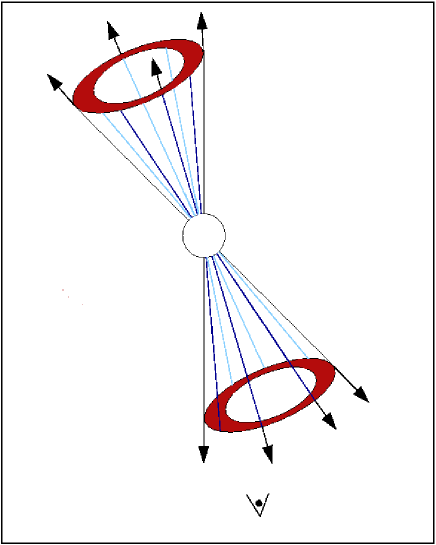
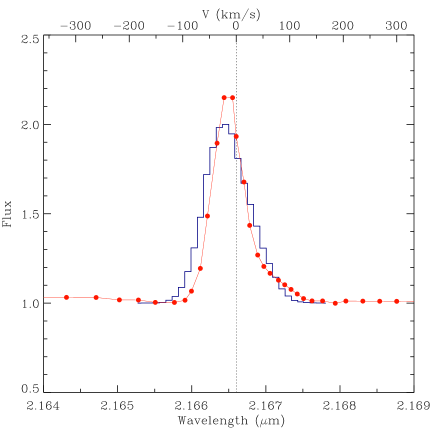
The model adopts a finite width ring with an inner and outer radius of 3.5 mas and 4.5 mas respectively The system needs to be inclined by 8° in order to have the star obscuring parts of the ionized wind. The hourglass wind configuration is chosen to have an opening angle of . The combination of the system inclination and the cone-opening angle is degenerate and neither are strongly constrained: a wider cone opening angle requires a larger inclination angle. Indeed, we should perhaps stress that the model we construct is only to be seen as a plausibility check and a start for further studies. The rings have an average outflow velocity of for the red and blue side respectively. The velocity vector is parallel to the cone surface. In order to obtain higher velocity material as observed in the flux profile, we apply a multiplicative factor drawn from a Gaussian distribution with a FWHM of 4. This results in velocity distributions with a FWHM of for each ring. If our model ring-elements at each velocity interval contribute equally to the flux we obtain a Br profile shown as a histogram in Fig. 8. Our procedure matches the observed flux profile by scaling the intensity of the uniformly emitting ring-elements and thus introducing that the ring-elements at some velocities are slightly brighter than others.
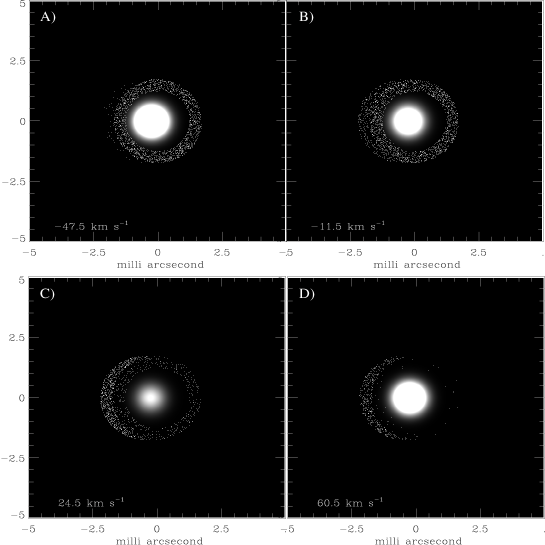
Using the fluxes thus obtained we calculate images at each velocity interval. Fig. 10 displays the image on the sky for 4 velocity intervals, and it shows that the redshifted Br ring is only partially observable. From these images, we calculate the spectrally resolved visibilities and phases which are presented in Figs. 9. The visibilities show a decent match, and the differential phases display a phase reversal because of the transition into the second lobe of the ring’s visibility function. By spectrally degrading the model visibilities and phases to a spectral resolution of 1500, we can compare the new nine AMBER observations in MR setting to this simple model. These comparisons are shown in Fig. 11, where it is clear that again the visibilities are nearly all well reproduced. Also the differential phases are in general quite well reproduced, with some exceptions. Departures from perfect ring structures in a dynamical environment can occur and could be responsible for the three MR phases that do not fit the model predictions.
We introduced a large macroturbulent velocity for the pragmatic reason that we need to obtain a smooth Br line profile in the model. However, this is not inconsistent with the qualitative discussion of the physical state of the wind of IRC +10420 by Humphreys et al. (2002). These authors invokes a picture of a dynamic environment in which clumps move radially outward and inward. Such an environment is prone to shocks and this could provide the energy dissipation that gives rise to the Br emission. It may well be that the Br emission is due to collisional excitation to level =2 followed by ionization and recombination in this dense material. It would explain why a relatively cool object such as IRC +10420 has such a prodigious hydrogen emission.
Our assumption of a ring-like structure is clearly an oversimplification. However, we note the similarity of the au-scale environment with the clumpy structures in the larger scale ejecta inferred from HST imaging (Tiffany et al. 2010). We conclude with summarizing the scenario in which a ring-like structure is the morphological result of a dynamical outflow along an hour-glass like cone nebula, giving rise to collisionally excited Br emission. The model provides encouraging fits to both the observed visibilities and differential phases obtained at many points in the uv-plane, and should provide a good basis for more complex modelling of the circumstellar environment of the object..


4.2 The origin of the Na i emission
The Na i 2.2 m doublet in emission is a comparatively rare phenomenon. It was first reported in the spectrum of IRC +10420 by Thompson & Boroson (1977), and has been found in the spectra of other massive evolved stars, such as the well-known Yellow Hypergiants HD 179821, HR 8752 and Cas (Lambert et al. 1981; Hrivnak, Kwok & Geballe 1994 Hanson et al. 1996), but also in Luminous Blue Variables (LBVs) and B[e] stars (e.g. Hamann & Simon 1986; McGregor et al. 1988; and Morris et al. 1996). Several hypotheses have been put forward to explain emission from a neutral atomic line towards hot and cool stars. Here we investigate whether our spatially resolved emission can constrain or rule out models. We recall that the spectro-interferometry indicates that all Na i emission comes from a region well within the dust condensation radius (70 mas). In addition, we find that this atomic line emission originates from a region smaller than the Br emission.
The upper level of the Na i doublet is at a much higher excitation energy than normal for optical/near-infrared neutral metallic lines. Thompson & Boroson (1977) proposed that the sodium lines come from fluorescent emission occurring after the atoms are excited to the upper state via pumping from the ground state by 3302 photons. To prevent the sodium from being ionized, shielding from direct star light is necessary. Concentrating on the similar Mg i 1.5 and 1.7 m emission lines in IRC +10420, Fix & Cobb (1987) take this further and suggest the neutral metallic lines are formed in a dense “chromosphere”, located just above the photosphere.
A different interpretation for the line forming mechanism can be found in Hamann & Simon (1986). These authors associate the Na i line emission of the - much hotter - B[e] object MWC 349A with a cool, dense extended disk material and locate the emission region 9-30 au from the B-type central star. Similar considerations led McGregor et al. (1988) to conclude that the Na i lines originate from the same region as the CO first overtone bandhead emission, which typically arises from warm, dense material. The density in this region would then be enhanced due to a swept-up wind, and was proposed to be a few hundred au away from the central stars. Scoville et al. (1983) observed the Becklin-Neugebauer object (2MASS05351411-0522227) in OMC-1, a young, hot star which also has Na i 2.2 m emission. They locate the Na i region outside the H ii region and propose that the Balmer bound-free continuum emission is more likely to excite the atoms.
Our observations clearly rule out any scales larger than several 100s of au, simply because of field-of-view considerations. However, scales larger than 10s of au can also be excluded. The Na i line forming region is smaller than the Br emission region for which we derive a size scale of 4 milli-arcseconds or 4 stellar radii. This finding lends support to the “chromosphere” scenario as originally proposed by Thompson & Boroson (1977) and Fix & Cobb (1987). The fact that the lines are blue-shifted with respect to the systemic velocity is consistent with this idea. It is inevitable that part of the red-shifted emission from a volume barely larger than the star will be blocked from view. The rather smooth and symmetric appearance of the lines probably indicates a large macro-turbulent velocity in this wind.
The question that remains of course is whether we deal with a proper “chromosphere”, as neither IRC +10420, nor the other Yellow Hypergiants HD 179821, Cas and HR 8752, who also have Na i emission, show a temperature inversion indicative of a chromosphere. These objects are the spectroscopic twins of IRC +10420, while HD 179821 is, next to IRC +10420, the only other object to be proposed in the post-Red Supergiant phase (see the review by Oudmaijer et al. 2009). As these authors point out, these two objects could very well undergo strong mass loss, where the wind itself is optically thick and forms a pseudo-photosphere hiding the star itself from view (see also Smith, Vink & de Koter 2004). The optically thick wind shields the sodium from ionization by direct starlight, and produces the conditions to get Na i emission, as observed. This is consistent with the fact that the line forming region is smaller than Br. Indeed, the presence of an optically thick pseudo-photosphere could also explain why the star is observed to be larger in the K band continuum than would be expected for its spectral type (0.98 vs 0.70 mas - see Sec.2).
Is the inferred presence of a pseudo-photosphere consistent with the properties expected for massive evolved stars? Yellow Hypergiants are hypothesised to evolve from the red to the blue, crossing the so-called Yellow Void, a hitherto fairly empty region in the HR diagram (de Jager & Nieuwenhuijzen 1997). Some of them have been observed to undergo strong mass-loss events, creating a pseudo-photosphere making them appear to cross this Yellow Void again, but now back to the red (e.g. Humphreys et al. 2006; Lobel et al. 2003). Such events have been referred to as “bouncing” (e.g. Stothers and Chin 2001) against the Yellow Void, although it would be more correct if referred to as bouncing against a “Yellow Wall” or rather a “White Wall” given the temperatures involved (8000-10,000 K). It may also be useful to note that the Na i emission was present in the spectrum of IRC +10420 at a time when there was no Br emission. This was discovered only much later by Oudmaijer et al. (1994). Therefore the star may have been surrounded by a pseudo-photosphere much longer, while the increase in temperature of the underlying star eventually gave rise to the observed hydrogen recombination line emission. IRC +10420 has been photometrically stable for about a decade now (see e.g. Patel et al.2008), suggesting it has not changed its temperature and it therefore seems to be leaning against this White Wall. The presence of a pseudo-photosphere and associated mass loss, may indicate that we could witness a strong eruption soon.
A question that arises now is whether the pseudo-photosphere scenario is also applicable to the LBVs and B[e] objects. LBVs are known to undergo strong mass loss episodes and, when at their coolest, hypothesised to be surrounded by pseudo-photospheres (see the discussion by Vink 2009). Na i emission is absolutely consistent with this and may even be used to infer the presence pseudo-photosphere in the absence of other diagnostics. Moving to higher temperatures, an intriguing, recent, AMBER result is that Na i 2.2 m emission from the B[e] object CPD -57o2874 is unresolved. This is accompanied by a spatially resolved Br emission line region which is elongated with a size of 713 au (Domiciano de Souza et al. 2007). As also observed for IRC +10420, the Na i emission originates much closer to the 20 000 K star than the hydrogen recombination line emission. It would be tempting to assume that the star exhibits a pseudo-photosphere too, however the spectral energy distribution indicates a hot photosphere. As the Na definitely needs shielding from the stellar radiation, it is plausible that in this case the line originates from a dense disk instead, consistent with the elongation observed in Br. It will be interesting to see how a larger baseline coverage will be able to distinguish between such possibilities.
5 Conclusions
In this paper we have presented new spectro-interferometric AMBER and spectroscopic X-Shooter observations of the post-Red Supergiant IRC +10420. The medium spectral resolution AMBER observations provide about 180 degree coverage of the object in uv-space. The data spatially resolve the Br emission line and, for the first time the Na i 2.2 m doublet emission.
Our main conclusions are the following. We re-confirm that the ionized wind appears as a ring-like structure on the sky. It has a diameter of approximately 4 milli-arcsecond or au. In order to explain the unusual differential phases, we consider a geometric model in which the ring structure traced by the interferometry are actually two rings on either side of the star as part of an hourglass nebula seen close to pole-on. The model reproduces the spectrally dispersed visibilities and phases very well.
The direct implication is that IRC +10 420 exhibits a polar wind. Whether the wind in the equatorial region has different properties (density, terminal velocity) requires further investigation. The observed velocities in Br can be understood in terms of small pockets or blobs with velocities of , being ejected along the hourglass cone surface.
In contrast, the Na i 2.2 m doublet, a comparatively rare emission line, is found to originate inside the Br emission region and just outside the continuum. It is very unusual to find emission from a neutral metallic line coming from a region that is closer to the star than the hydrogen recombination line emission. This leads us to speculate that the hydrogen is not ionized directly from the ground level, but instead from the collisionally excited level. This requires less energetic photons and could explain why we would see such prodigious emission from a comparatively cool star, while it is consistent with the idea of high densities in the circumstellar material.
It is very telling that despite its rarity all Yellow Hypergiants with published near-infrared spectra display this doublet in emission. If we are to assume that the size scales found for IRC +10420 are typical for the other ones, they all may exhibit an extended, expanding, pseudo-photosphere. The combination of the atomic properties requiring this line to be pumped by UV-blue photons and the observed, small, size scale of the line emitting region allows us to conclude that all Yellow Hypergiants have a ”pseudo-photosphere” yielding support to the notion of the bouncing against the Yellow Void/White Wall hypothesis.
Acknowledgements.
It is a pleasure to thank Antoine Mérand for his advices on data reduction, and Thomas Driebe for providing us with the high spectral resolution AMBER data. WdW would like to thank the hospitality of G. Weigelt and the Bonn IR interferometry group where this paper was finalized.References
- Blöcker et al. (1999) Blöcker, T., Balega, Y., Hofmann, K.-H., et al. 1999, A&A, 348, 805
- Busche & Hillier (2005) Busche, J. R. & Hillier, D. J. 2005, AJ, 129, 454
- Davies et al. (2007) Davies, B., Oudmaijer, R. D., & Sahu, K. C. 2007, ApJ, 671, 2059
- Dayal et al. (2000) Dayal, A., Sahai, R., Watson, A. M., et al. 2000, AJ, 119, 315
- de Jager (1998) de Jager, C. 1998, A&A Rev., 8, 145
- de Jager & Nieuwenhuijzen (1997) de Jager, C. & Nieuwenhuijzen, H. 1997, MNRAS, 290, L50
- de Wit et al. (2008) de Wit, W. J., Oudmaijer, R. D., Groenewegen, M. A. T., Hoare, M. G., & Malbet, F. 2008, A&A, 480, 149
- D’Odorico et al. (2006) D’Odorico, S., Dekker, H., Mazzoleni, R., et al. 2006, in Society of Photo-Optical Instrumentation Engineers (SPIE) Conference Series, Vol. 6269, 98
- Domiciano de Souza et al. (2007) Domiciano de Souza, A., Driebe, T., Chesneau, O., et al. 2007, A&A, 464, 81
- Driebe et al. (2009) Driebe, T., Groh, J. H., Hofmann, K.-H., et al. 2009, A&A, 507, 301 (D09)
- Fix & Cobb (1987) Fix, J. D. & Cobb, M. L. 1987, ApJ, 312, 290
- Gai et al. (2004) Gai, M., Menardi, S., Cesare, S., et al. 2004, in Society of Photo-Optical Instrumentation Engineers (SPIE) Conference Series, ed. W. A. Traub, Vol. 5491, 528
- Hamann & Simon (1986) Hamann, F. & Simon, M. 1986, ApJ, 311, 909
- Hanson et al. (1996) Hanson, M. M., Conti, P. S., & Rieke, M. J. 1996, ApJS, 107, 281
- Hinkle et al. (1995) Hinkle, K., Wallace, L., & Livingston, W. 1995, PASP, 107, 1042
- Hrivnak et al. (1994) Hrivnak, B. J., Kwok, S., & Geballe, T. R. 1994, ApJ, 420, 783
- Humphreys et al. (2002) Humphreys, R. M., Davidson, K., & Smith, N. 2002, AJ, 124, 1026
- Humphreys et al. (2006) Humphreys, R. M., Jones, T. J., Polomski, E., et al. 2006, AJ, 131, 2105
- Ivanov et al. (2004) Ivanov, V. D., Rieke, M. J., Engelbracht, C. W., et al. 2004, ApJS, 151, 387
- Jones et al. (1993) Jones, T. J., Humphreys, R. M., Gehrz, R. D., et al. 1993, ApJ, 411, 323
- Klochkova et al. (2002) Klochkova, V. G., Yushkin, M. V., Chentsov, E. L., & Panchuk, V. E. 2002, Astronomy Reports, 46, 139
- Kraus et al. (2012) Kraus, S., Monnier, J. D., Che, X., et al. 2012, ApJ, 744, 19
- Lafrasse et al. (2010) Lafrasse, S., Mella, G., Bonneau, D., et al. 2010, in Society of Photo-Optical Instrumentation Engineers (SPIE) Conference Series, Vol. 7734, 140
- Lagadec et al. (2011) Lagadec, E., Zijlstra, A. A., Oudmaijer, R. D., et al. 2011, A&A, 534, L10
- Lambert et al. (1981) Lambert, D. L., Hinkle, K. H., & Hall, D. N. B. 1981, ApJ, 248, 638
- Lobel et al. (2003) Lobel, A., Dupree, A. K., Stefanik, R. P., et al. 2003, ApJ, 583, 923
- McGregor et al. (1988) McGregor, P. J., Hyland, A. R., & Hillier, D. J. 1988, ApJ, 324, 1071
- Modigliani et al. (2010) Modigliani, A., Goldoni, P., Royer, F., et al. 2010, in Society of Photo-Optical Instrumentation Engineers (SPIE) Conference Series, Vol. 7737, 56
- Monnier et al. (2004) Monnier, J. D., Millan-Gabet, R., Tuthill, P. G., et al. 2004, ApJ, 605, 436
- Morris et al. (1996) Morris, P. W., Eenens, P. R. J., Hanson, M. M., Conti, P. S., & Blum, R. D. 1996, ApJ, 470, 597
- Oudmaijer (1998) Oudmaijer, R. D. 1998, A&AS, 129, 541
- Oudmaijer et al. (2009) Oudmaijer, R. D., Davies, B., de Wit, W.-J., & Patel, M. 2009, in Astronomical Society of the Pacific Conference Series, Vol. 412, The Biggest, Baddest, Coolest Stars, ed. D. G. Luttermoser, B. J. Smith, & R. E. Stencel, 17
- Oudmaijer et al. (1994) Oudmaijer, R. D., Geballe, T. R., Waters, L. B. F. M., & Sahu, K. C. 1994, A&A, 281, L33
- Oudmaijer et al. (1996) Oudmaijer, R. D., Groenewegen, M. A. T., Matthews, H. E., Blommaert, J. A. D. L., & Sahu, K. C. 1996, MNRAS, 280, 1062
- Patel et al. (2008) Patel, M., Oudmaijer, R. D., Vink, J. S., et al. 2008, MNRAS, 385, 967
- Petrov et al. (2007) Petrov, R. G., Malbet, F., Weigelt, G., et al. 2007, A&A, 464, 1
- Scoville et al. (1983) Scoville, N., Kleinmann, S. G., Hall, D. N. B., & Ridgway, S. T. 1983, ApJ, 275, 201
- Smith et al. (2004) Smith, N., Vink, J. S., & de Koter, A. 2004, ApJ, 615, 475
- Stothers & Chin (2001) Stothers, R. B. & Chin, C.-w. 2001, ApJ, 560, 934
- Tatulli et al. (2007a) Tatulli, E., Isella, A., Natta, A., et al. 2007a, A&A, 464, 55
- Tatulli et al. (2007b) Tatulli, E., Millour, F., Chelli, A., et al. 2007b, A&A, 464, 29
- Thompson & Boroson (1977) Thompson, R. I. & Boroson, T. A. 1977, ApJ, 216, L75
- Tiffany et al. (2010) Tiffany, C., Humphreys, R. M., Jones, T. J., & Davidson, K. 2010, AJ, 140, 339
- Vink (2009) Vink, J. S. 2009, ArXiv e-prints 0905.3338