University of Oxford
1 Keble Road, Oxford
OX1 3NP
United Kingdom
44email: p.sulc1@physics.ox.ac.uk
44email: t.ouldridge1@physics.ox.ac.uk
44email: ard.louis@physics.ox.ac.uk
55institutetext: F. Romano 66institutetext: J.P.K. Doye 77institutetext: Physical and Theoretical Chemistry Laboratory
Department of Chemistry
University of Oxford
South Parks Road
Oxford
OX1 3QZ
United Kingdom
77email: flavio.romano@chem.ox.ac.uk
77email: jonathan.doye@chem.ox.ac.uk
Simulating a burnt-bridges DNA motor with a coarse-grained DNA model
Abstract
We apply a recently-developed coarse-grained model of DNA, designed to capture the basic physics of nanotechnological DNA systems, to the study of a ‘burnt-bridges’ DNA motor consisting of a single-stranded cargo that steps processively along a track of single-stranded stators. We demonstrate that the model is able to simulate such a system, and investigate the sensitivity of the stepping process to the spatial separation of stators, finding that an increased distance can suppress successful steps due to the build up of unfavourable tension. The mechanism of suppression suggests that varying the distance between stators could be used as a method for improving signal-to-noise ratios for motors that are required to make a decision at a junction of stators.
1 Introduction
DNA has proved itself to be a versatile material for engineering on the nanoscale. A single DNA strand consists of nucleotides covalently connected by a sugar-phosphate backbone. Nucleotides also possess one of four types of base group, adenine (A), guanine (G), cytosine (C) or thymine (T). The planar bases interact with other bases by forming parallel face-to-face stacks and hydrogen bonds along their edges, resulting in the iconic double-stranded DNA helix (dsDNA) Watson1953 . Due to their chemical structure, hydrogen-bonded C-G and A-T base pairs are the most favourable, and helices made from complementary sequences of bases form the most stable duplexes.
The selectivity of DNA base-pairing can be used to engineer artificial structures and devices. As was originally proposed by Seeman, sequences of a set of single strands can be designed so that a certain configuration is the global free-energy minimum of the system Seeman1982 . An enormous range of nanostructures have been realised simply by cooling solutions of single-stranded DNA (ssDNA) based on this principle. Finite-size structures have been designed that assemble from a small number of short oligonucleotides Goodman2005 , a single long strand and many short staple strands Rothemund06 ; Douglas09 (a technique known as DNA ‘origami’) and a large number of short stands Wei2012 ; Ke2012 . Additionally, large one-dimensional ribbons Yan2003 , 2-dimensional arrays Winfree98 ; Malo2005 and 3-dimensional crystals Zheng2009 have been realised.
DNA nanotechnology is not confined to static structures – dynamic systems have also been realised. Duplex formation and toehold-mediated strand displacement Zhang2007 (a process in which a strand is removed from a duplex by a competing strand that can form more base pairs with the complement) allow a DNA system to respond to its environment. In particular, these processes can couple chemical change to mechanical operations and have the potential to process signals. DNA nanotweezers Yurke2000 , a switch that can be cycled through its closed and open states by the sequential addition of two types of strand, demonstrated the principle. “Clocked” addition of strands Goodman2008 ; Andersen09 ; Lo2010 ; Han2010 ; Sherman2004 ; Shin2004 or permutation of external conditions Liedl2005 ; Cheng2012 have since been used in the design of a number of active systems, including some in which the mechanical change has been harnessed to induce unidirectional motion along a track Sherman2004 ; Shin2004 ; Cheng2012 . Recently, autonomous devices and walkers that function without external forcing (by catalysing the equilibration of an out-of-equilibrium system) have also been created Yin2004 ; Chen2004 ; Bath05 ; Tian2005 ; Venkataraman2007 ; Green2008 ; Bath2009 ; Omabegho2009 ; Wickham11 ; Muscat2011 .
The high degree of parallelisation and the ability to interface directly with biological and molecular systems make DNA-based computation promising. In 1994, Adleman showed that DNA strands could be used to encode a Hamiltonian path problem, which was then solved upon mixing of the strands Adleman1994 . Since then, much work has gone into developing DNA-based logic circuits Seelig2006 , with a DNA neural network that can recognise simple patterns having recently been developed Qian2011 . DNA logic has also been combined with walking devices to produce systems that can select from distinct pathways at a junction depending on solution conditions, or properties of the walker itself Muscat2011 ; Wickham12 .
Although DNA nanotechnology shows great promise as a field, it is far from being fully mature. In particular, optimisation of nanostructure assembly and nanodevice operation will be vital if they are to prove generally useful. DNA nanostructures and nanodevices are typically designed using well-established thermodynamic models of DNA duplex stability, such as the unified nearest-neighbour model of SantaLucia SantaLucia2004 . However, nanodevices and nanostructures can involve non-trivial multi-stranded complexes with pseudoknots Dirks2007 or complex internal loops whose stabilities have not yet been incorporated into thermodynamic models. Moreover, non-equilibrium processes can be important in these systems. Furthermore, the three-dimensional structure of a DNA complex may result in tension or compression forces Liedl2010 that cannot be described without an explicit three-dimensional representation of the system.
Computer simulations provide controllable access to time and spatial resolutions that are not accessible in experiments. Simulations of DNA nanotechnological systems therefore have the potential to offer insight into aspects of their operation and design, provided the computational model accurately describes the relevant physics. At the greatest level of detail, DNA molecules can be studied using quantum-mechanical calculations. However, typical of what is achievable with the most advanced methods is for example the calculation of interactions for two base pairs in vacuum Svozil10 . Classical molecular dynamics simulation packages such as AMBER cornell95 retain an all-atom representation of the DNA molecule and use empirical force fields between atoms. However, they too are computationally very demanding, and simulating rare events, such as breaking of base pairs in a duplex, remains at the limits of what is currently possible Perez2012 .
Processes relevant to DNA nanotechnology typically involve reactions between multiple strands whose lengths vary from about ten to several thousands of bases. In order to address sizes and time scales at which the reactions relevant to DNA nanotechnology happen, one needs to turn to coarse-grained models of DNA Drukker2001 ; Sales-Pardo2005 ; Kenward2009 ; Ouldridge2009 ; Knotts2007 ; Sambriski2009 ; Linak11 ; Araque11 ; Florescu2011 ; Morriss-Andrews2010 ; Savin2011 ; Dans2010 ; Savelyev2009 ; Becker2007 ; Lankasbook ; Svaneborg12 . Such models replace multiple atoms by a reduced set of degrees of freedom and parametrised effective interactions. Each model necessarily makes a compromise between the level of detail of its representation, physical accuracy and its efficiency, which sets its specific domain of applicability.
In this paper we use the coarse-grained DNA model of Ouldridge et al. Ouldridge2011 ; Ouldridge_thesis ; oxDNA to study the operation of a ‘burnt-bridges’ DNA motor created by the Turberfield group Bath05 ; Wickham11 ; Wickham12 . The model, which provides a physically reasonable representation of ssDNA, dsDNA and the transition between the two, allows for simulations involving reactions of DNA systems of order tens to hundreds of bases in total on a single CPU and several thousands on a GPU. Further, it has been previously successfully applied to the study of DNA nanotechnological systems including DNA tweezers Ouldridge_tweezers_2010 , kissing hairpins Romano12a and a two-footed DNA walker Ouldridge_thesis .
We first give a brief overview of the design of the burnt-bridges motor and the DNA model. We then describe the simulation methods used and present results of simulations of one step of the DNA walker. The motor consists of a single DNA strand (cargo) which moves from one complementary strand (stator) to the next through toehold-mediated strand displacement. We study the process for different distances between stators, different strengths of the attachments of the stators to a surface and for different lengths of the toehold, particularly focusing on the consequences of inter-stator distance.
2 Burnt-bridges DNA motor
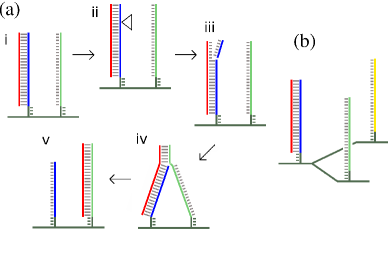
The burnt-bridges DNA motor studied in this work is a system that produces autonomous, unidirectional motion of a single-stranded cargo along a track of single-stranded stators. The motor was experimentally realised in Refs. Bath05 ; Wickham11 ; Wickham12 , and the stepping process of the motor is schematically illustrated in Figure 1. The stators can be attached to a DNA duplex Bath05 , or a DNA origami surface Wickham11 ; Wickham12 .
Initially, the cargo strand is attached to the first stator. A nicking enzyme (N.B bvC 1b) is present in the solution Heiter2005 . These enzymes can bind specifically to a certain sequence of double stranded DNA present in the stator/cargo duplex, and cut the backbone of the stator strand a short distance from the end of the stator (6 bases in Refs. Wickham11 ; Wickham12 , and 8 in Ref. Bath05 ). The binding of the shorter stator fragment is unstable at experiment conditions, and it tends to detach, revealing a short toehold on the cargo. The next available stator is positioned close to the first stator (around 7 nm in Ref. Bath05 and 6 nm in Refs. Wickham11 ; Wickham12 ) and the exposed toehold can bind to the next stator. Strand displacement can then occur, allowing the cargo to replace bonds to the first stator with bonds to the second stator.
Once the displacement process is complete, the cargo is totally detached from the first stator and fully bound to the second one. The stepping process can now be repeated, with the stator to which the cargo is attached being cut again by the enzyme and the cargo making a step to the next stator in line. The backward step is now highly improbable, as the preceding stator has been nicked and has fewer complementary bases with the cargo strand. Used stators therefore get disabled as the cargo travels along the track, leading to the description ‘burnt-bridges’. Directional motion is possible because the walker’s motion catalyses the hydrolysis of the stator’s backbone, a free-energetically favourable process.
In the original experiment Bath05 , three stators were attached to a double-stranded DNA track. Fluorescence was used to demonstrate that the cargo stepped along the track, visiting the stators in order. Stators were later attached to a DNA origami surface Wickham11 , and the cargo was observed to move along a 17-stator track by atomic force microscopy. Motion along an 8-site track was also observed via fluorescence, and was strongly suppressed by the removal of a stator. Recently, motors have been designed that can choose a pathway at a junction based on information either carried by the motor itself or provided externally Wickham12 .
The suggested future applications of DNA walkers such as the burnt-bridges motor include a programmable chemical synthesis and a molecular realization of a Turing machine Bath2007 .
3 Coarse-grained DNA model
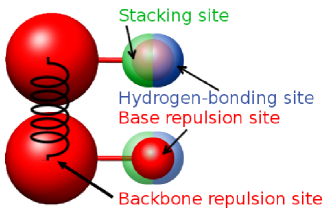
We use the coarse-grained DNA model introduced in Refs. Ouldridge2011 and Ouldridge_tweezers_2010 . It represents a DNA strand as a string of nucleotides, each of them a rigid body with several interaction sites. The structure of the nucleotides is illustrated in Figure 2. Inter-nucleotide interactions are expressed through the system’s potential
| (1) | |||||
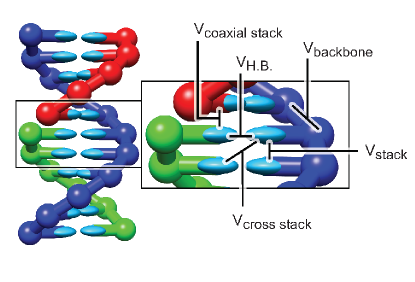
where the first sum is taken over all nucleotides that are adjacent along the backbone of a strand and the second sum is taken over all other pairs of nucleotides. The nucleotides that participate in these interactions within the duplex state are schematically shown in Figure 3. The detailed description of the interactions along with their functional form is available in Ref. Ouldridge_thesis . Below we provide a basic description of each term.
The backbone potential is an isotropic (finitely-extensible) spring potential that mimics the covalent bonds in the backbone by constraining the distance between the backbone sites of the neighbouring nucleotides within a strand. This constraint is represented through the cylindrical tubes connecting the nucleotides within a certain strand in our figures, such as Figure 3.
Nucleotides also interact through excluded volume potentials associated with the backbone and base of each nucleotide, and . The interaction radius of the excluded volume potentials is shown in Figure 2. Hydrogen bonding interactions occur between anti-aligned complementary bases, and stacking interactions drive the strand to form helical stacks of bases. Together, these two interactions are the primary driving force for duplex formation. Cross stacking is an additional secondary stabilising interaction within a duplex. Coaxial stacking captures the stacking interaction between nucleotides that are not adjacent along the backbone of a strand. , , and are all anisotropic and depend both on the mutual orientations of nucleotides and the distances between the interaction sites.
The model was fitted at salt concentration , where electrostatic properties are strongly screened. Hence, for simplicity, repulsive electrostatic interactions are simply incorporated into the backbone excluded volume. Most DNA nanotechnology is indeed carried out at high salt concentration to suppress repulsion between strands.
Although the model has sequence-specific binding (i.e., the hydrogen bonding interaction is negative only for Watson-Crick base pairs A-T and C-G), it does not otherwise distinguish between different base types in terms of interaction strengths. The model has recently been extended to include sequence-dependent interactions for base pairing and stacking in Ref. oxDNA . In this work, we use the “average-base” version of the model, since generic features of the system are easier to resolve without sequence-dependent complications.
The model captures the structural, mechanical and thermodynamical properties of ssDNA and dsDNA with average AT and GC content in the sequence Ouldridge2011 . The model was fitted to reproduce melting temperatures of short duplexes as predicted by SantaLucia’s nearest-neighbour model SantaLucia1998 ; SantaLucia2004 for an average sequence. The single strands in the model are relatively flexible, allowing the formation of single-stranded hairpins as well as double-stranded helices.
The model’s physical representation of DNA properties has allowed it to be successfully used for the study of a wide range of DNA systems. In terms of nanotechnology, DNA nanotweezers Ouldridge_tweezers_2010 , kissing hairpins Romano12a ; oxDNA and a two-footed DNA walker Ouldridge_thesis have been simulated. From a more biophysical perspective, the nematic ordering transition of dense solutions of short duplexes CDMnematicDNA , DNA overstretching Romano12b and the extrusion of cruciform structures under torsion Matek have also been modelled. The physically reasonable behaviour in all cases gives us confidence in applying the model to the burnt-bridges motor.
4 Simulating the burnt-bridges motor
4.1 System
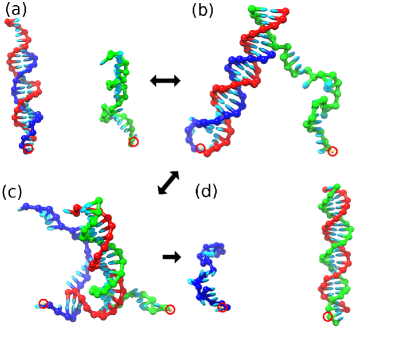
Our simulated system consists of three DNA strands: the first stator, the cargo strand and the second stator. The representation of these strands by the model is illustrated in Fig. 4. We simulate the process by which the motor steps to the next stator, stages (iii)–(v) in Fig. 1. The first stator has six bases fewer than the second stator, emulating the state shown in Fig. 1 (a)-(iii) after the small fragment of the stator has dissociated after nicking. We model the attachment of the stators to a surface via a spring potential, acting on the first base of the stators:
| (2) |
where and are the positions of the centre of mass of the first nucleotide of the first and second stator respectively and and are the positions to which they are attached by the springs. This potential energy is included in the total potential energy of the system. We define a set of coordinates such that the stator attachment points lie in the plane, and are separated by a distance in the direction. We will compare three different values of : nm, nm and nm. nm approximately corresponds to the distance used in Ref. Bath05 and we chose nm and nm to test shorter and longer distances respectively.
In most simulations, we use the spring constant , chosen so that the variance of the distance between the attached nucleotides of the first and second stators, , is approximately equal to the variance of the distance between two nucleotides that are 11 base pairs away on a strand in DNA duplex as simulated with our model at temperature . Choosing the spring constant in this manner means that its magnitude is physically sensible for a DNA-based system; we will, however, consider the consequences of varying it.
To further mimic the presence of the DNA origami substrate, we forbid the cargo and stator strands from crossing the plane. To achieve this we introduce an additional potential
| (3) |
which acts on the positions of centre of mass of all nucleotides in the simulation. We set to , which is sufficiently large to effectively prevent nucleotides from crossing the plane. The total potential energy of the simulated system is then . All our simulations are done at temperature , the temperature used in experiment.
We use the following sequences for the first stator, second stator and cargo, respectively:
5’-TCAGCCCAACTAACATTTTA-3’
5’-GGAACCTCAGCCCAACTAACATTTTA-3’
5’-CGATGTTAGTTGGGCTGAGGTTCC-3’
which correspond to the sequences used in Ref. Wickham11 . In the experiments, there is an additional 20-base segment at the 5′ end of the stator that was used to bind a blocking strand that was displaced before the beginning of the stepping measurements. We do not include this segment in our simulation. The last 4 bases at the 3′ end of the stators are not complementary to the cargo strand, acting as a flexible linker with the surface. Note that the two bases at the end of the cargo strand are not complementary to the stator strands: in the experiment Wickham11 this dangling end was used to attach a fluorophore to the system for tracking.
4.2 Simulation methods
Unbiased Monte Carlo methods sample different configurations of the system with a relative probability given by the physically appropriate Boltzmann distribution (, with being the temperature, the Boltzmann constant and the potential energy of the configuration). Properties of a system at a certain temperature can then be measured by averaging over the configurations obtained. We use the Virtual Move Monte Carlo (VMMC) algorithm Whitelam2007 ; Whitelam2009 (specifically, the variant in the appendix of Ref. Whitelam2009 ). VMMC is an approach in which new configurations are proposed by moving dynamically selected clusters of particles (nucleotides in our case), accelerating the equilibration of strongly-interacting systems relative to simple implementations in which only a single particle is moved at each step. The proposed moves used in our simulations are either rotation around a randomly chosen nucleotide’s backbone site or linear translation.
In our simulations we compute the equilibrium free energy of the system as a function of the number of base pairs between the cargo and the first stator () and the cargo and the second stator (). We define a base pair as being formed if the hydrogen-bonding energy ( in Eq. (1)) between the two bases is more negative than , about 15% of typical hydrogen-bonding energies in our model. The free energy of a state is related to the probability that the system is found in such a state during simulations by
| (4) |
where is an arbitrary normalisation. A relatively high free energy thus corresponds to a relatively unlikely state. Free-energy landscapes do not completely determine the kinetic properties of a system, but they are indicative of how the system responds to certain changes of parameters. For example, the rate at which a process occurs is often limited by the need to pass through a high free-energy (improbable) state. Raising (or lowering) this barrier by perturbing the system generally results in an exponential decrease (or increase) in the rate of the process.
Sampling all relevant states can be difficult even with an efficient algorithm such as VMMC, as (meta)stable states are often separated by high free-energy barriers that are difficult to cross. Simulations can therefore get stuck for large portions of the simulation time in a local free-energy minimum. To overcome this problem, we use the Umbrella Sampling method Torrie1977 . Instead of sampling from the Boltzmann distribution, we sample from configurations using the weight , where is an arbitrary biasing potential. can be chosen to raise the probability of visiting unlikely transition intermediates, thereby accelerating equilibration. To obtain an unbiased estimate of the free energy, one must correct for the applied bias:
| (5) |
where is the probability with which states appear in the biased simulation. In this work, we run several simulations to determine by hand to enhance sampling of the relevant states. Once a satisfactory are obtained, long simulations are run to collect the final data.
It is convenient in our case to split the Umbrella Sampling protocol into two windows. In the first window we study attachment of the cargo’s toehold to the second stator, and in the second we consider the displacement process. To do this, we restrict the system to and in the first case and , and in the second. The windows are then combined using the overlap between the two with the weighted histogram analysis method Kumar1992 .
We note that we do not sample all possible values of and using these two windows. To do so would have been computationally costly without being likely to provide much insight. In particular, we do not consider the breaking of many base pairs of the first stator/cargo duplex unless the cargo is attached to the second stator. The high free-energy cost of spontaneous breaking of base pairs at this temperature make substantial melting extremely unlikely. For the same reason, we do not consider displacement intermediates with fewer than 14 base pairs involving the cargo. Finally, we do not sample the transition to states with , when the cargo is detached from the first stator. To do so would be especially difficult as it would require simulating the reattachment of the cargo to the first stator in the absence of a toehold. Once detached from the first stator, however, the system is in a configuration very similar to the initial one, the only difference being the extra six base pairs available with the second stator. The free-energy change associated with adding a base pair to an isolated duplex in our model is known to be around at C (this can be seen from the slope of the free-energy profile in Fig. 5 (b) for the initial stages of toehold binding), and so we can roughly estimate the free energies of the states from those of the states. Most importantly, however, only states with both and are expected to be sensitive to the separation of the stators, as only in these states is the cargo stretched between both.
The Umbrella Sampling simulations reported in this work involve at least attempted VMMC moves. Half of the moves are rotations (about a random axis with an angle drawn from a normal distribution with mean zero and standard deviation 0.2 radians), and half are translations (through a random vector with a length drawn from a normal distribution with mean zero and standard deviation 0.85 Å).
5 Simulation results
We first present the free-energy landscape, and a profile along a one-dimensional pathway, for two stators apart attached by springs with stiffness , to illustrate the basic features of the attachment of the cargo to the second stator and of the branch-migration process. We then compare the free-energy profiles for different attachment spring constants, different distances between the stators, and different lengths of the toehold on the first stator.
5.1 Stators separated by 7.1 nm
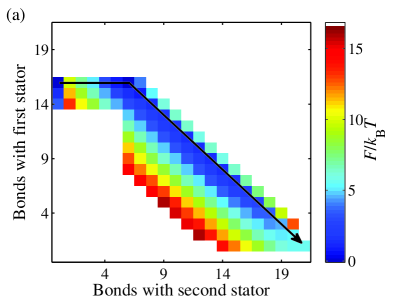
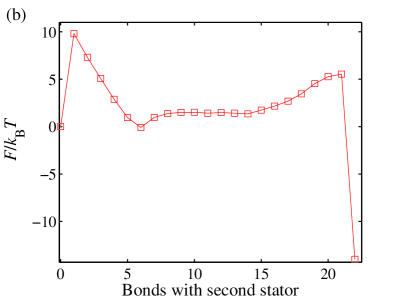
The free-energy landscape as a function of and is shown in Fig. 5 (a), with major features highlighted by inspecting the one-dimensional pathway shown in Fig. 5 (b). The free energy is normalised to be equal to for the case when the cargo has no bonds with the second stator. The basic features of the landscape are the following.
-
•
There is a rise in free energy associated with the formation of the initial base pair with the second stator, due to the loss of configurational entropy when the first contact is formed.
-
•
The free energy decreases as successive base pairs are formed in the toehold, due to the cooperative nature of duplex formation (once the first contact is formed, successive base pairs are much more likely).
-
•
As displacement begins (once the seventh base pair is formed with the second stator), there is an initial rise in free energy, followed by a plateau. This initial rise is a generic feature of displacement resulting from steric interference at the displacement interface, and is the subject of a forthcoming paper Srinivas2012 .
-
•
Later stages of displacement, after around 15 base pairs have formed between the cargo and the second stator, involve an increase in free energy of around .
An unusual feature of the free-energy profile shown in Fig. 5 (b) is the increase in free energy towards the end of displacement. We attribute this to an increase in tension within the system. When the first bond between the cargo and the second stator is formed, the contact point is far away from the nucleotides that are attached to the surface (the end of the stators). It is therefore not difficult for the strands to reach each other at the contact point. By contrast, when more bonds have formed between the cargo and the second stator, the contact point is closer to the end of the stators. Eventually, the length of DNA between the contact point and the surface attachments gets so short that maintaing the structure causes considerable tension, which is free-energetically unfavourable and results in the observed rise in the profile.
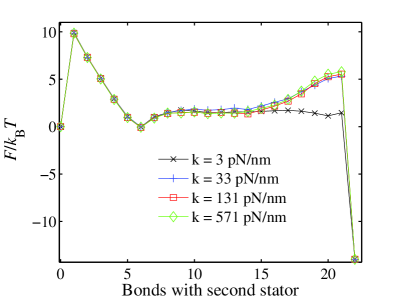
The role of the attachment of stators to a surface can be tested by changing the spring constant of the attachment to the surface. The results of otherwise identical simulations with different spring constants are shown in Fig. 6. Increasing or decreasing the spring constant from by a factor of about 4 has a very small effect on the free-energy profile. The reason is that in this range the attachment spring is fairly stiff, and the less costly way for the system to come close together is to stretch the single-stranded sections. By decreasing the spring constant by nearly two orders of magnitude, down to , we are able to access a regime where the attachment springs are sufficiently weak that the strands can relax the tension effectively by moving the bases at the end of the stators closer together rather than stretching the single-stranded sections. We stress that the physically relevant regime for stators attached to a DNA duplex or to a DNA origami is the high- one.
5.2 Varying the distance between stators
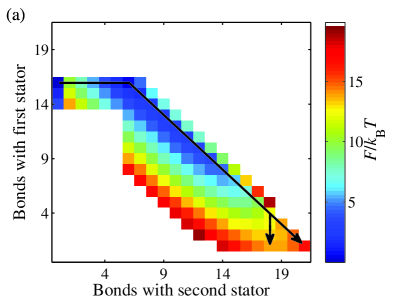
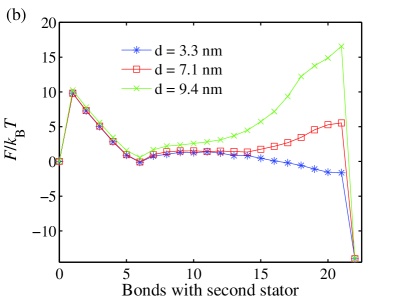
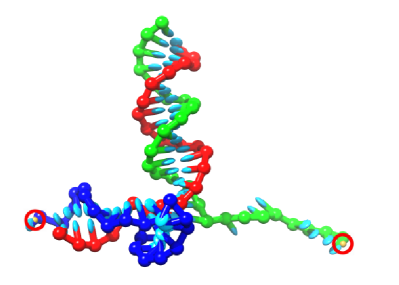
We now compare the stepping of the motor for three different distances between the stators: nm, nm, and nm. The free-energy profile along the one-dimensional pathway indicated in Fig. 5 (a) is shown in Fig. 7 (b) for all three distances. Fig. 7 (a) shows the full two-dimensional free-energy landscape for the case of nm. All the profiles were produced with the same spring constant, namely . The free energies have been normalised to zero when there are no bonds between the cargo and the second stator. One of the typical configurations sampled by our simulations for distance between stators is illustrated in Fig. 8.
The initial part of the free-energy profile, from 0 bonds to 6 bonds with the second stator, is nearly identical for all three distances considered. As the second stator makes more bonds with the cargo strand, we see that the increase in free energy is bigger for larger distances between the stators. This effect is consistent with our understanding that the rise in free energy is associated with increasing tension within the complex due to the need to stretch DNA between the surface attachment points and the junction. The snapshot in Fig. 8 clearly illustrates the tension in the system at later stages of displacement for nm.
In fact, inspection of Fig. 7 (a) shows that the tension for the nm case is so great that when the cargo has only one bond with the first stator, it is thermodynamically more favourable for the cargo to be bound by only 18 or 19 base pairs to the second stator, rather than by 21 base pairs as for the other values of . It is therefore highly probable that a typical displacement pathway would involve the first stator detaching when the second stator has significantly fewer than 21 base pairs with the cargo, along an alternative pathway such as that shown in Fig. 7 (a). As such, the profile along the pathway shown in Fig. 7 (b) tends to overstate the difficulty in stepping between the two stators for nm, although it is still a much more difficult process than for the shorter values of .
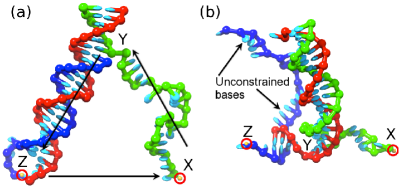
Interestingly, for the smallest separation of nm there is actually a decrease in free energy with increased binding of the cargo to the second stator. We attribute this to the fact that the number of bases under constraint actually decreases as displacement proceeds. As can be seen from Fig. 9 (a), when the second stator is bound only to the toehold of the cargo, most of the bases in the system are effectively held within a closed loop ( in the diagram – this loop includes the vector between attachment sites) that reduces their conformational freedom. As displacement proceeds, a single-stranded section of the first stator that is not constrained by looping is generated, and the number of bases in the loop is reduced, as depicted in Fig. 9 (b). All else being equal, transferring bases from within the constrained loop to an unconstrained section should be a favourable process because of the increase in a configurational entropy. However, the extra tension felt by the short loop overwhelms this effect for large stator separations.
5.3 Different toehold lengths
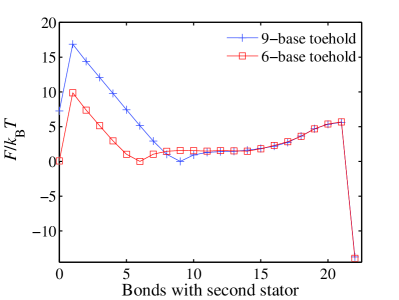
Finally, we compare the free-energy profile obtained at nm and with that for an identical system, except with a longer toehold (9 bases rather than 6) exposed by the nicking of the first stator. The free-energy profiles (taken along the same pathway as indicated in Fig. 5 (a) for the 6-base toehold and along an analogous path for the 9-base case) are shown in Figure 10. These profiles have been normalised to 0 when the cargo strand is bonded fully by its toehold to the second stator, i.e. by 6 and 9 bases respectively. As expected, in the case of the 9-base toehold, we observe a larger barrier for detachment of the cargo strand from the second stator once it is bound by the toehold due to the extra base pairs. By contrast, once displacement is well underway the free-energy profiles do not differ by more than , which is comparable with the estimated errors. Thus, once displacement has been initiated, the free-energy changes are only dependent on the distance between the strands and not the toehold length.
5.4 Consequences of free-energy profiles for motor operation and track design
Our data suggest that the tension generated within the motor as displacement proceeds has a potentially significant effect on motor operation. In particular, the resultant rise in free energy will suppress the speed with which the second stator can fully displace the first after binding to the toehold of the cargo. If this suppression is strong enough, the probability that the second stator detaches from the toehold rather than completing the displacement increases. The slope of the free-energy profile changes rapidly with , being fairly gentle at nm and very significant at nm. We would therefore expect its effects on stepping success to become noticeable for or nm for a 6-base toehold. By contrast, we note that the initial toehold contacts have almost equal free energies for the three distances studied. So, even though the distances vary, this result suggest that initial binding rates are relatively similar in all cases.
If stepping to the next stator after the current one has been cut is the limiting stage in motor operation, then the reduction of this rate would be manifested in the overall stepping speed of the motor. However, the binding, action and unbinding of the nicking enzyme all contribute to the time required to take a step, so (at least at low enzyme concentrations and moderate values of ) this change may have a negligible effect on the overall stepping speed. At sufficiently large , however, increasing further should have a noticeable effect on overall motor speed. This limit was clearly reached in Ref. Wickham11 , when removal of a single stator (estimated gap nm) dramatically reduced the overall rate at which the cargo reached the end of the track. Our results suggest this reduction was primarily due to the increased difficulty in completing displacement, rather than a reduced rate in making contact between the second stator and the toehold of the cargo.
Interestingly, the potential reduction in the success probability of displacement may be advantageous at decision-making junctions such as those illustrated in Fig. 1 (b). We might encourage the cargo to choose stator by relatively destabilising the toehold of in some manner, such as blocking it with another strand Wickham12 or by having a different sequence. Leak currents will always exist, however, and even blunt-ended strand displacement (with no toehold) can occur Zhang2009 .
The selection ratio of stator to stator , , can be modelled by assuming that the toehold of the cargo can initially bind to stator with a rate , whereupon the cargo successfully completes the step to stator with probability and detaches with probability . In this case,
| (6) |
Assuming and are equidistant from the original stator, there is limited room to adjust . The fact that is important. It means that it will be essentially impossible to chose between two stators if both have sufficiently stable toeholds so that and (even if there is a large difference in absolute stability between the two). Furthermore, it means cannot be increased arbitrarily by increasing the stability of toehold , limiting the maximum signal-to-noise ratio.
Increasing the failure rate of displacement by adjusting (for both stators and equally) will tend to reduce , and hence the larger toehold stability will be required to achieve . The junction will then be able to distinguish between toeholds that are more stable than previously, and will have a higher maximum signal-to-noise ratio. We note that if the primary consequence of increasing was to reduce the binding rate of the toehold to the next stator (rather than the success probability once bound), it would be impossible to improve the efficiency of the junction in this way.
6 Discussion
We have briefly introduced a coarse-grained model of DNA, and demonstrated that it can be used to investigate an active DNA nanotechnological device: a unidirectional molecular motor Bath05 ; Wickham11 ; Wickham12 . In particular, we have studied the physics of the stepping process from one stator to the next, once the first has been cut by a nicking enzyme, with emphasis on the dependence of this process on the separation of stators.
We observed that the free-energy profiles of initial binding of the cargo’s toehold to the second stator are fairly insensitive to stator separation. However, as displacement proceeds, there is a rise in the free energy when stators are separated by larger distances, associated with the need for ever shorter sections of DNA to extend across the gap between attachment points. Such a rise will tend to reduce the speed at which the cargo completes its step to the next stator once it is bound by its toehold. For a large enough rise, there will be a reduction in the probability of successful completion of a motor’s step following initial attachment. These results suggest that the experimentally observed reduction in stepping rate when the distance between stators is doubled Wickham11 is predominantly due to the increased difficulty of completing displacement, rather than a reduced probability for forming an initial contact between the next stator and the toehold of the cargo. We argue that such a reduction in successful stepping could be used to provide higher sensitivity at junctions where motors must chose between two adjacent stators.
We find that the rigidity with which stators are held in place can be important. At low stiffnesses, stators can move towards each other and relax some of the tension generated by displacement. At high stiffnesses, the stators’ movement is limited and the DNA must stretch across the full gap between attachment points instead, resulting in the aforementioned rise in free energy. These results suggest that the flexibility of the surface to which the stators are attached, and the nature of the attachment, could be significant in determining the properties of motor stepping. We estimate, however, that anchoring stators such as those studied here to a single duplex is enough to qualify as a stiff attachment.
Our results have been obtained with a coarse-grained model, and the free-energy landscapes and profiles we have measured do not completely determine kinetics, which also depends on non-equilibrium effects. Nonetheless, the increase in tension within the motor as displacement proceeds is based on very general mechanical and structural properties of DNA that are known to be well reproduced by the model. So it is reasonable to assume that large stator separation does indeed lead to a rise in free energy with displacement progress. Furthermore, such a rise makes later displacement intermediates harder to reach and will eventually reduce the probability of successful step completion once the second stator is bound to the cargo’s toehold. For the system considered in this work, a separation of around or nm should be sufficient to demonstrate the effects of stator separation. The most important assumption that we have made is that the small fragment of the first stator and the nicking enzyme tend to dissociate before attachment to the next stator can occur. Even if this is not the case, however, their influence will be strongest during toehold attachment and displacement initiation, and should not prevent the rise in free energy associated with increased tension at the later stages of displacement.
Future work could include explicit simulations of the dynamics of motor stepping, although such simulations will probably be computationally demanding even for a model as simple as this one. It would also be worthwhile to study the consequences of different sequences using the sequence-dependent model, and motifs such as internal mismatches, on the operation of the motor.
The software tools implementing our coarse-grained DNA model that were used for producing data for this work are freely available at http://dna.physics.ox.ac.uk.
7 Acknowledgments
We would like to thank Shelley Wickham, Jonathan Bath, Alex Lucas and Andrew Turberfield for helpful discussions. The authors also acknowledge financial support from the Engineering and Physical Sciences Research Council, University College (Oxford), and from the Oxford Supercomputing Centre for computer time. P. Š. is grateful for the award of a Scatcherd European Scholarship.
References
- (1) J.D. Watson, F.H.C. Crick, Nature 171, 737 (1953)
- (2) N.C. Seeman, J. Theor. Biol. 99, 237 (1982)
- (3) R.P. Goodman, I.A.T. Sharp, C.F. Tardin, C.M. Erben, R.M. Berry, C.F. Schmidt, A.J. Turberfield, Science 310, 1661 (2005)
- (4) P.W.K. Rothemund, Nature 440, 297 (2006)
- (5) S.M. Douglas, H. Dietz, T. Liedl, B. Högberg, F. Graf, W.M. Shih, Nature 459, 414 (2009)
- (6) B. Wei, M. Dai, P. Yin, Nature 485, 623 (2012)
- (7) Y. Ke, L.L. Ong, W.M. Shih, P. Yin, Science 338, 1177 (2012)
- (8) H. Yan, S.H. Park, G. Finkelstein, J.H. Reif, T.H. LaBean, Science 301, 1882 (2003)
- (9) E. Winfree, F.R. Liu, L.A. Wenzler, N.C. Seeman, Nature 394, 539 (1998)
- (10) J. Malo, J.C. Mitchell, C. Venien-Bryan, J.R. Harris, H. Wille, D.J. Sherrat, A.J. Turberfield, Angew. Chem. Int. Ed. 44, 3057 (2005)
- (11) J. Zheng, J.J. Birktoft, Y. Chen, T. Wang, R. Sha, P.E. Constantinou, S.L. Ginell, C. Mao, N.C. Seeman, Nature 461, 74 (2009)
- (12) D.Y. Zhang, A. Turberfield, B. Yurke, E. Winfree, Science 318, 1121 (2007)
- (13) B. Yurke, A.J. Turberfield, A.P. Mills, F.C. Simmel, J. Neumann, Nature 406, 605 (2000)
- (14) R.P. Goodman, M. Heilemann, S. Doose, C.M. Erben, A.N. Kapanidis, A.J. Turberfield, Nat. Nanotechnol. 3, 93 (2008)
- (15) E.S. Andersen, M. Dong, M.M. Nielsen, K. Jahn, R. Subramani, W. Mamdouh, M.M. Golas, B. Sander, H. Stark, C.L.P. Oliveira, J.S. Pedersen, V. Birkedal, F. Besenbacher, K.V. Gothelf, J. Kjems, Nature 459, 73 (2009)
- (16) P.K. Lo, P. Karam, F. Aldaye, C.K. McLaughlin, G. Hamblin, G. Cosa, H.F. Sleiman, Nature Chem. 2, 319 (2010)
- (17) D. Han, S. Pal, Y. Liu, H. Yan, Nat. Nanotechnol. 5, 712 (2010)
- (18) W.B. Sherman, N.C. Seeman, Nano Lett. 4, 1203 (2004)
- (19) J.S. Shin, N.A. Pierce, J. Am. Chem. Soc. 126, 10834 (2004)
- (20) T. Liedl, F.C. Simmel, Nano Lett. 5, 1894 (2005)
- (21) J. Cheng, S. Sreelatha, R. Hou, A. Efremov, R. Liu, J.R.C. van der Maarel, Z. Wang, Phys. Rev. Lett. 109 (2012)
- (22) P. Yin, H. Yan, X.G. Daniell, A.J. Turberfield, J.H. Reif, Angew. Chem. Int. Ed. 43, 4906 (2004)
- (23) Y. Chen, M. Wang, C. Mao, Angew. Chem. Int. Ed. 43, 3554 (2004)
- (24) J. Bath, S.J. Green, A.J. Turberfield, Angew. Chem. 117, 4432 (2005)
- (25) Y. Tian, Y. He, Y. Chen, P. Yin, C. Mao, Angew. Chem. Int. Ed. 44, 4355 (2005)
- (26) S. Venkataraman, R.M. Dirks, P.W.K. Rothemund, E. Winfree, N.A. Pierce, Nat. Nanotechnol. 2, 490 (2007)
- (27) S.J. Green, J. Bath, A.J. Turberfield, Phys. Rev. Lett. 101, 238101 (2008)
- (28) J. Bath, S.J. Green, K.E. Allan, A.J. Turberfield, Small 5, 1513 (2009)
- (29) T. Omabegho, R. Sha, N.C. Seeman, Science 324, 67 (2009)
- (30) S.F.J. Wickham, M. Endo, Y. Katsuda, K. Hidaka, J. Bath, H. Sugiyama, A.J. Turberfield, Nat. Nanotechnol. 6, 166 (2011)
- (31) R.A. Muscat, J. Bath, A.J. Turberfield, Nano Lett. 11, 982 (2011)
- (32) L.M. Adleman, Science 266, 1021 (1994)
- (33) G. Seelig, D. Soloveichik, D.Y. Zhang, E. Winfree, Science 314, 1585 (2006)
- (34) L. Qian, E. Winfree, J. Bruck, Nature 475, 368 (2011)
- (35) S.F.J. Wickham, J. Bath, Y. Katsuda, M. Endo, K. Hidaka, H. Sugiyama, A.J. Turberfield, Nat. Nanotechnol. 7, 169 (2012)
- (36) J. SantaLucia, Jr., D. Hicks, Annu. Rev. Biophys. Biomol. Struct. 33, 415 (2004)
- (37) R.M. Dirks, J.S. Bois, J.M. Schaeffer, E. Winfree, N.A. Pierce, SIAM Rev. 29, 65 (2007)
- (38) T. Liedl, B. Högberg, J. Tytell, D.E. Ingbe, W.M. Shih, Nat. Nanotechnol. 5, 520 (2010)
- (39) D. Svozil, P. Hobza, J. Šponer, J. Phys. Chem. B 114, 1191 (2010)
- (40) W.D. Cornell, P. Cieplak, C.I. Bayly, I.R. Gould, K.M. Merz, D.M. Ferguson, D.C. Spellmeyer, T. Fox, J.W. Caldwell, P.A. Kollman, J. Am. Chem. Soc. 117, 5179 (1995)
- (41) A. Pérez, F.J. Luque, M. Orozco, Acc. Chem. Res. 45, 196 (2012)
- (42) K. Drukker, G. Wu, G.C. Schatz, J. Chem. Phys. 114, 579 (2001)
- (43) M. Sales-Pardo, R. Guimera, A.A. Moreira, J. Widom, L. Amaral, Phys. Rev. E 71, 051902 (2005)
- (44) M. Kenward, K.D. Dorfman, J. Chem. Phys. 130, 095101 (2009)
- (45) T.E. Ouldridge, I.G. Johnston, A.A. Louis, J.P.K. Doye, J. Chem. Phys. 130, 065101 (2009)
- (46) T.A. Knotts, IV, N. Rathore, D. Schwartz, J.J. de Pablo, J. Chem. Phys. 126 (2007)
- (47) E.J. Sambriski, D.C. Schwartz, J.J. de Pablo, Biophys. J. 96, 1675 (2009)
- (48) M.C. Linak, R. Tourdot, K.D. Dorfman, J. Chem. Phys. 135, 205102 (2011)
- (49) J.C. Araque, A.Z. Panagiotopoulos, M.A. Robert, J. Chem. Phys. 134, 165103 (2011)
- (50) A.M. Florescu, M. Joyeux, J. Chem. Phys. 135, 085105 (2011)
- (51) A. Morriss-Andrews, J. Rottler, S.S. Plotkin, J. Chem. Phys. 132, 035105 (2010)
- (52) A.V. Savin, M.A. Mazo, I.P. Kikot, L.I. Manevitch, A.V. Onufriev, Phys. Rev. B 83, 245406 (2011)
- (53) P.D. Dans, A. Zeida, M.R. Machado, S. Pantano, J. Chem. Theory Comput. 6, 1711 (2010)
- (54) A. Savelyev, G.A. Papoian, Biophys. J. 96, 4044 (2009)
- (55) N.B. Becker, R. Everaers, Phys. Rev. E 76, 021923 (2007)
- (56) F. Lankaš, Innovations in Biomolecular Modeling and Simulations, RSC Biomolecular Sciences, vol. 2 (The Royal Society of Chemistry, 2012)
- (57) C. Svaneborg, Comput. Phys. Commun. 183, 1793 (2012)
- (58) T.E. Ouldridge, A.A. Louis, J.P.K. Doye, J. Chem. Phys. 134, 085101 (2011)
- (59) T.E. Ouldridge, Coarse-grained modelling of DNA and DNA nanotechnology. Ph.D. thesis, Oxford University (2011), available at http://tinyurl.com/7ycbx7c
- (60) P. Šulc, F. Romano, T.E. Ouldridge, L. Rovigatti, J. Doye, A. Louis, J. Chem. Phys. 137, 135101 (2012)
- (61) T.E. Ouldridge, A.A. Louis, J.P.K. Doye, Phys. Rev. Lett. 104, 178101 (2010)
- (62) F. Romano, A. Hudson, J.P.K. Doye, T.E. Ouldridge, A.A. Louis, J. Chem. Phys. 136, 215102 (2012)
- (63) D.F. Heiter, K.D. Lunnen, G.G. Wilson, J. Mol. Biol. 348, 631 (2005)
- (64) J. Bath, A.J. Turberfield, Nat. Nanotechnol. 2, 275 (2007)
- (65) J. SantaLucia, Jr., Proc. Natl. Acad. Sci. U.S.A 17, 1460 (1998)
- (66) C. De Michele, L. Rovigatti, T. Bellini, F. Sciortino, Soft Matter 8, 8388 (2012)
- (67) F. Romano, D. Chakraborty, J.P.K. Doye, T.E. Ouldridge, A.A. Louis, arXiv:1209.5892 (2012)
- (68) C. Matek, T.E. Ouldridge, A. Levy, J.P.K. Doye, A.A. Louis, J. Phys. Chem. B 116, 11616 (2012)
- (69) S. Whitelam, P.L. Geissler, J. Chem. Phys. 127, 154101 (2007)
- (70) S. Whitelam, E.H. Feng, M.F. Hagan, P.L. Geissler, Soft Matter 5, 1521 (2009)
- (71) G. Torrie, J.P. Valleau, J. Comp. Phys. 23, 187 (1977)
- (72) S. Kumar, J.M. Rosenberg, D. Bouzida, R.H. Swendsen, P.A. Kollman, J. Comput. Chem. 13, 1011 (1992)
- (73) N. Srinivas, T.E. Ouldridge, P. Šulc, J. Schaeffer, B. Yurke, A.A. Louis, J.P.K. Doye, E. Winfree, to be submitted
- (74) D.Y. Zhang, E. Winfree, J. Am. Chem. Soc. 131, 17303 (2009)