Six millisecond pulsars detected by the Fermi Large Area Telescope and the radio/gamma-ray connection of millisecond pulsars
Abstract
We report on the discovery of gamma-ray pulsations from five millisecond pulsars (MSPs) using the Fermi Large Area Telescope (LAT) and timing ephemerides provided by various radio observatories. We also present confirmation of the gamma-ray pulsations from a sixth source, PSR J20510827. Five of these six MSPs are in binary systems: PSRs J17130747, J17411351, J16003053 and the two black widow binary pulsars PSRs J06102100 and J20510827. The only isolated MSP is the nearby PSR J10240719, which is also known to emit X-rays. We present X-ray observations in the direction of PSRs J16003053 and J20510827. While the latter is firmly detected, we can only give upper limits for the X-ray flux of the former. There are no dedicated X-ray observations available for the other 3 objects.
The MSPs mentioned above, together with most of the MSPs detected by Fermi, are used to put together a sample of 30 gamma-ray MSPs which is used to study the morphology and phase connection of radio and gamma-ray pulse profiles. We show that MSPs with pulsed gamma-ray emission which is phase aligned with the radio emission present the steepest radio spectra and the largest magnetic fields at the light cylinder among all MSPs. As well, we also observe a trend towards very low, or undetectable, radio linear polarisation levels. These properties could be attributed to caustic radio emission produced at a range of different altitudes in the magnetosphere. We note that most of these characteristics are also observed in the Crab pulsar, the only other radio pulsar known to exhibit phase-aligned radio and gamma-ray emission.
keywords:
pulsars: general — gamma-rays: general — X-rays: general1 Introduction
Pulsed gamma-ray emission from more than one hundred pulsars has been detected by the Large Area Telescope (LAT) aboard the Fermi Gamma-ray Space Telescope111https://confluence.slac.stanford.edu/display/GLAMCOG/ Public+List+of+LAT-Detected+Gamma-Ray+Pulsars (Abdo et al., 2010b, 2013). About a third of them are millisecond pulsars (MSPs), fast rotators that spin down very slowly and steadily. MSPs are thought to have been spun-up through accretion of material from an evolved companion star (Alpar et al., 1982; Radhakrishnan & Srinivasan, 1982). During accretion, the system appears as a low-mass X-ray binary (LMXB) and no pulsed radio emission is observed. Although other possibilities have been considered (e.g. Ruderman, 1991), it is commonly believed that accretion is responsible for the low surface magnetic fields observed amongst MSPs. In this model, the original field has been buried by the in-falling material, decreasing its surface strength and decreasing the magnetic torque acting on the neutron star (Romani, 1990; Bhattacharya & van den Heuvel, 1991).
Most MSPs are found in binary systems. Among those in binaries, there is a growing number in very tight binary systems with low mass companions, the so called Black Widows (e.g. Roberts, 2011). It is believed that most solitary MSPs came through the black widow evolutionary path, in which the companion is ablated by the pulsar wind, either during the X-ray phase or once the pulsar turns on in the radio (Eichler & Levinson, 1988; Ruderman et al., 1989).
The gamma-ray emission mechanism for MSPs and normal pulsars is believed to be the same (Abdo et al., 2009). MSPs exhibit the lowest gamma-ray luminosities among gamma-ray pulsars, a consequence of their low spin-down energy rates (), compared to young pulsars (Abdo et al., 2010b). Most observed gamma-ray pulse profiles consist of two dominant, sharp peaks, which suggest the emission is caustic in nature (Abdo et al., 2010b). Among the different models for radio and gamma-ray emission of pulsars, these properties tend to favour models in which gamma rays are generated in the outer magnetosphere (e.g. Romani & Yadigaroglu, 1995; Dyks & Rudak, 2003) and radio emission is produced at lower altitudes (e.g. Rankin, 1993). This is supported by the fact that most gamma-ray detected radio pulsars exhibit gamma-ray pulses arriving out of phase with the radio pulsations (Abdo et al., 2010b). However, this scheme has been challenged by the increasing number of MSPs found to exhibit phase-aligned radio and gamma-ray pulse profiles, suggesting that, at least in these cases, they are both produced at a similar location in the magnetosphere (Abdo et al., 2010a; Freire et al., 2011a; Guillemot et al., 2012b). It has been noted that some of the MSPs showing phase-aligned radio and gamma-ray emission exhibit very low levels of radio linear polarisation (Guillemot et al., 2012b), which is predicted to some extent by caustic emission models (Venter et al., 2012).
Before these discoveries, the Crab pulsar was the only pulsar known to exhibit phase-aligned radio and gamma-ray emission (Kuiper et al., 2003). MSPs present radio polarisation properties similar to normal radio pulsars (Xilouris et al., 1998; Yan et al., 2011; Keith et al., 2012) but often much wider pulse profiles. Interpulses and bridge emission between different peaks are more common among MSPs (Yan et al., 2011). MSPs present radio spectra with a slope similar to normal radio pulsars, although arguably slightly steeper (Toscano et al., 1998; Kramer et al., 1998; Maron et al., 2000).
As well as detecting many new radio MSPs in gamma rays (Abdo et al., 2009), Fermi has also pointed the way to many MSP discoveries via their gamma-ray emission properties (e.g. Ransom et al., 2011; Cognard et al., 2011; Keith et al., 2011; Guillemot et al., 2012a; Kerr et al., 2012). Here we report on another six MSPs detected in gamma rays by the Fermi LAT, all of which were previously known radio pulsars (PSRs J06102100, J10240719, J16003053, J17130747, J17411351 and J20510827). This is the first time that pulsed gamma-rays are detected from these sources, except for PSR J20510827, for which a 4 detection was reported by Wu et al. (2012).
By combining these six MSPs with 24 previously reported gamma-ray MSPs we are able to start evaluating trends in the emission properties of the gamma-ray MSP sample. In particular, we use this sample to study the pulse profile properties and other connections between the radio and gamma-ray characteristics of these objects.
In section 2 we describe the methods used to detect and analyse the gamma-ray pulsations from the six new gamma-ray MSPs and in section 3 we comment on their multi-wavelength properties. In section 4 we present a search for orbital modulation in the gamma-ray emission of the five MSPs in binary systems. The study of the radio and gamma-ray properties of most known gamma-ray MSPs is presented in section 5 and the discussion of the study is in section 6. A summary of our work is in section 7.
2 Methodology: detecting gamma-ray pulsations
The detection of pulsed gamma-ray emission from known MSPs is possible through the use of precise rotational ephemerides obtained through frequent radio observations, which are used to assign a rotational phase to each gamma-ray photon (Smith et al., 2008). Photons are then binned in pulse phase to create a histogram which represents the light curve of the pulsar.
2.1 Radio analysis
We use pulse times of arrival (TOAs) obtained from radio observations with the Arecibo Observatory (AO, Freire et al., 2011b), the Nançay Radio Telescope (NRT, Theureau et al., 2005), the Jodrell Bank Observatory (JBO, Hobbs et al., 2004), the Parkes Observatory (PKS, Weltevrede et al., 2010) and the Westerbork Synthesis Radio Telescope (WSRT, Karuppusamy et al., 2008; Voûte et al., 2002). See section 2.1.1 for more details on the use of the different datasets.
| Pulsar | Observatories | RMS | MJD range | DM | ||
|---|---|---|---|---|---|---|
| s | pc cm-3 | |||||
| J06102100 | JBO, NRT, PKS | 111 | 2.84 | 54509 – 55850 | 60.67(1)† | 6 |
| J10240719 | JBO, NRT, WSRT | 145 | 1.82 | 54590 – 55837 | 6.488(1) | 0.4 |
| J16003053 | NRT | 193 | 1.20 | 54564 – 55797 | 52.3218(4) | 0.2 |
| J1713+0747 | JBO, NRT, WSRT | 257 | 0.74 | 54501 – 55804 | 15.9929(1) | 0.1 |
| J1741+1351 | AO | 8192 | 0.77 | 52840 – 55889 | 24.2014(1) | 0.04 |
| J20510827 | JBO, WSRT | 1590 | 14.52 | 54338 – 55880 | 20.73673(2) | 0.01 |
Note.— Columns contain the observatories involved in the observations, the total number of TOAs used (), the root mean square variation (RMS) of the timing residuals and the time range of validity for the timing solution. The last two columns show the DM values and the uncertainty of the phases assigned to the gamma-ray photons caused by the uncertainties on the DM, . DM uncertainties on the last quoted digits are in parentheses. These uncertainties correspond to the formal errors given by tempo2 and may under-represent the real uncertainties. The photon phase errors () caused by the uncertainty on the DM were calculated using these values. †Value taken from Burgay et al. (2006).
To study the phase alignment between gamma and radio pulses it is necessary to account for the delay suffered by the radio waves in their passage through the interstellar medium. In order to do this precisely, accurate estimates of the dispersion measure (DM) are essential, especially for rapidly rotating pulsars (Smith et al., 2008). With the aim of having accurate and updated DM values, we measured the DM using multi-frequency radio data taken during the time of the Fermi mission for five of the six gamma-ray MSPs (Table 1).
The best available radio TOAs were used to produce radio ephemerides valid from at least 3 months before the start of the Fermi mission until October 2011. Ephemerides were produced by analysing the TOAs with the timing software Tempo2 (Hobbs et al., 2006). Because of the use of different pulse-profile templates to match the observations, hence different points of reference, and the existence of small clock divergences between observatories, the different datasets sometimes require phase-alignment. Thus, in addition to the spin frequency and its first derivative, binary parameters, position, proper motion and DM, we also fitted for phase delays between the datasets from different observatories. More information on the timing solutions built for each pulsar can be found in Table 1 and section 2.1.1.
While pulsar timing can provide most of the known parameters describing pulsars, distances can be obtained by different techniques. If no better distance estimate was available (e.g. via parallax), the DM was used to calculate a distance based on the Galactic Free Electron Model (NE2001, Cordes & Lazio, 2002). The best distance estimates () for the 6 MSPs are listed in Table 2. We note that the error bars of the DM-based distances could potentially be largely underestimated, affecting the error bars quoted for gamma-ray luminosities and efficiencies (section 2.2.1).
Because MSPs present low rotational period derivatives (), the Shklovskii effect (Shklovskii, 1970) can be significant for those objects with a large proper motion (like PSR J10240719, see below). We have corrected all values for this effect and the corrected values can be found in Table 2. Other radio properties like position, rotational and orbital periods and proper motion are also found in Table 2.
2.1.1 Building timing solutions, dispersion measures and distances
For PSR J06102100 most observations during the last 4 years have been carried out at GHz, hence it is not possible to perform a sensitive analysis of the DM during the time of the Fermi mission. Nonetheless, using a few GHz TOAs and the small spread of observing frequencies around GHz of the other available TOAs, we are confident that the DM has not changed by more than 0.02% with respect to the value quoted in the radio discovery paper (Burgay et al., 2006). This ensures an accuracy better than rotations on the phases assigned to the gamma-ray photons.
For PSR J10240719, we measure a DM of pc cm-1, which indicates a distance of pc, based on the NE2001 model. However, the Lutz -Kelker-bias-corrected distance is pc (Hotan et al., 2006; Verbiest et al., 2012). As is discussed below, considerations of the transverse movement and the Shklovskii effect are important before adopting any of these values. There are slightly different published proper motion values for this pulsar (see Bailes et al., 1997; Hotan et al., 2006). Using 5 years of NRT data at GHz we fitted for position and proper motion and obtained values entirely consistent with those in Hotan et al. (2006). The large total proper motion measured ( mas yr-1) implies a significant contribution to the observed value by the Shklovskii effect. In fact, it seems that most of the observed spin-down comes from this effect. The parallax distance indicates a negative intrinsic and the maximum possible distance, in order to obtain a positive , is 410 pc. Using the lowest possible distance given by the parallax uncertainties (i.e. 400 pc), we calculate the upper limit . We will use this upper limit and adopt the Lutz -Kelker-bias-corrected distance calculated by Verbiest et al. (2012).
For PSR J16003053, the timing solution was obtained using data at two main frequencies ( and GHz), that allowed us to calculate an accurate and up-to-date DM. We also included the first time derivative for the DM in the fit (i.e. it was allowed to vary linearly with time), measuring a value consistent with that in You et al. (2007).
For PSR J17130747, a distance of kpc is obtained from the NE2001 model using our DM estimate (Table 2). However, using 12 years of radio timing, Splaver et al. (2005) measured this pulsar’s yearly parallax and calculated a distance of kpc, which is the value we adopt here.
For PSR J17411351, the timing solution was obtained with observations carried out at the AO using the L-wide receiver, recording data between and GHz, which offers enough bandwidth to monitor DM variations. Based on the NE2001 model and the DM obtained from these observations the distance to this pulsar would be kpc. The same dataset contains the clear effects of a yearly parallax, suggesting a similar distance of kpc (this is a preliminary value, Freire et al., 2013), which is the value we use.
For PSR J20510827, the orbital parameters are changing rapidly: Stappers et al. (1998) reported the measurement of the first time derivative of the orbital period, Doroshenko et al. (2001) detected up to 3 time derivatives of the orbital period and Lazaridis et al. (2011) detected variations of the orbital period and the projected semi-major axis. Almost 4 years of WSRT data at GHz was used to fit for position, proper motion and binary parameters, using the ELL1 binary model (Lange et al., 2001) implemented in Tempo2, and including one derivative of the orbital period. A second WSRT dataset taken at GHz and JBO TOAs at GHz were then used together with the GHz data to fit for the DM and its first derivative, keeping all orbital and astrometric parameters fixed.
These timing solutions will be made available through the Fermi Science Support Center222 http://fermi.gsfc.nasa.gov/ssc/data/access/lat/ephems/.
| Pulsar | Refs. | |||||||||
|---|---|---|---|---|---|---|---|---|---|---|
| (deg) | (deg) | (ms) | days | mas yr-1 | kpc | erg s-1 | ||||
| J06102100 | 227.8 | -18.2 | 3.86 | 1.24 | 0.3 | 18.2(2) | 4(1)† | 0.1(3) | 1(2) | 1, 2 |
| J10240719∗ | 251.7 | 40.5 | 5.16 | 1.85 | – | 59.9(2) | 0.5(1) | 1, 3 | ||
| J16003053 | 344.1 | 16.5 | 3.60 | 0.95 | 14.4 | 7.2(3) | 2(1) | 0.84(4) | 7.1(4) | 4, 3 |
| J17130747 | 28.75 | 25.2 | 4.57 | 0.85 | 67.8 | 6.30(1) | 1.1(1) | 0.805(4) | 3.33(2) | 5 |
| J17411351 | 37.89 | 21.6 | 3.75 | 3.02 | 16.3 | 11.71(1) | 1.08(5) | 2.89(1) | 21.68(4) | 6 |
| J20510827 | 39.19 | -30.4 | 4.51 | 1.27 | 0.1 | 7.3(4) | 1.0(2) | 1.21(1) | 5.21(5) | 7, 2 |
Note.— The first 8 columns contain pulsar names, positions in galactic coordinates, periods, period derivatives, orbital periods, proper motions and distances. The 9th and 10th columns give the values for the period derivative and spindown energy rate, both corrected for the Shklovskii effect ( and ). Uncertainties in the last quoted digits are in parentheses. References in the last column are for proper motion and distance: (1) This work; (2) NE2001 model (Cordes & Lazio, 2002); (3) Verbiest et al. (2012) (4) Verbiest et al. (2009); (5) Splaver et al. (2005); (6) Freire et al. (preliminary, 2013) (7) Lazaridis et al. (2011). †See a discussion about this value at the end of section 2.2.1. ∗See a discussion about the distance to this MSP and the Shklovskii corrections in sections 2.1.1 and 2.2.1.
2.2 Gamma-ray analysis
To study the gamma-ray emission from these six MSPs we selected Fermi LAT data taken between 2008 August 4 and 2011 August 4 using the Fermi Science Tools (STs)333http://fermi.gsfc.nasa.gov/ssc/data/analysis/scitools/overview.html. We restricted the dataset to events with energies between 0.1 and 100 GeV, reconstructed directions within 15∘ of the pulsar locations, zenith angles smaller than 100∘, and belonging to the “source” class of the P7_V6 instrument response functions (IRFs). We rejected the data collected when the LAT rocking angle exceeded 52∘, when the instrument was not operating in the science observation (or configuration) mode or when the data quality flag was not set as good.
2.2.1 Spectral properties
The gamma-ray spectral properties of the pulsars were determined using a binned maximum likelihood method, as implemented in the pyLikelihood Python module of the Fermi STs. This method fits a model representing the point sources in the selected Region Of Interest (ROI) and the diffuse emission to the data, and finds the best-fit parameters optimising the likelihood function describing the data. Our models included all sources from the 2FGL catalog (Nolan et al., 2012) found within 20∘ of the pulsar positions. Parameters of sources within 8∘ of the pulsars were left free in the fit, while parameters of sources more than 8∘ away were fixed at the values listed in the 2FGL catalog. The diffuse Galactic emission was modelled using the gal_2yearp7v6_v0 map cube. The residual instrument background and the diffuse extragalactic emission were modelled using the iso_p7v6source template444These diffuse models are available for download from the Fermi Science Support Center, see http://fermi.gsfc.nasa.gov/ssc/data/access/lat/BackgroundModels.html. The normalisation of the diffuse components were left free in the fits. The first step of the spectral analysis involved modelling the pulsar spectra with exponentially cutoff power-law (ECPL) shapes of the form:
| (1) |
where is a normalisation factor, is the photon index and is the cutoff energy of the spectrum. The spectral parameters for PSRs J06102100 and J1713+0747 found with this model are listed in Table 3, along with the derived integrated photon fluxes and energy fluxes above 0.1 GeV. These pulsar spectra were also fitted with a simple power-law model to test the validity of the ECPL model by comparing the goodness of the fit for the two models. For both pulsars the power-law model was rejected with more than 3 significance. For the other four pulsars, fitting the spectra with all three parameters of the ECPL spectral shape left free was unsuccessful and yielded unsatisfactory results indicative of bad convergence issues. To estimate the cutoff energy and the integrated energy flux for these pulsars, a second spectral fit was performed using a ECPL model with two free parameters only, fixing to a value of 1.3, which is the average seen for the 32 strongest MSPs in the second catalog of LAT pulsars (Abdo et al., 2013, in preparation). The results of these fits are also listed in Table 3. In this table, the first quoted uncertainties are statistical, and the second are systematic. For PSRs J06102100 and J1713+0747, the latter uncertainties were estimated by running the fitting procedure using bracketing IRFs where the effective area was perturbed by the estimated uncertainties 10% at 0.1 GeV, 5% near 0.5 GeV, and 10% at 10 GeV, using linear extrapolations (in log space) in between (Ackermann et al., 2012a). For the other four MSPs, the systematic errors caused by fixing the photon index to a nominal value of probably dominate the errors due to uncertainties in the IRFs. To estimate the systematic uncertainties resulting from this choice, we fitted the data using photon indices of and , these values representing the extrema observed for 32 strong gamma-ray MSPs (Abdo et al., 2013). The best-fit parameters for and provide the limits on the actual values listed in Table 3. We note that the fits obtained with were inconsistent with the data in all cases, which resulted in very large values of for PSRs J16003053 and J1741+1351 and, therefore, large systematic errors for these objects. Finally, the gamma-ray luminosities and the efficiencies for the conversion of spin-down luminosity into gamma-ray radiation were calculated assuming a beaming factor of (see Watters et al., 2009, for more details) which is common for outer magnetospheric emission models (e.g. Venter et al., 2009). These quantities are given in Table 3.
Two objects present anomalous efficiencies. We obtain for PSR J10240719, determined by the maximum allowed by the value adopted in section 2.1.1, which is very low. However, if this MSP was at 350 pc, would be larger and thus the efficiency would be smaller and closer to values commonly observed (see the discussion on this MSP’s distance in section 2.1.1). We note that this problem could also be alleviated if was smaller than . By modelling the gamma-ray emission of a few MSPs, Venter et al. (2009) calculated for different geometric configurations (magnetic inclination and line of sight). Although for known gamma-ray MSPs they find values close to 1, under some specific geometric configurations their calculations show that also could be very small.
The other case is the large efficiency obtained for PSR J06102100 (, Table 3). An efficiency above 1 is unphysical and to have requires kpc2. As noted above, it is possible that the flux correction factor is not exactly , but smaller. We also consider the possibility that the large DM-based distance (Table 2) is due to material along the line of sight, not modelled in NE2001. Infrared images acquired by WISE (4.6, 12, 22 microns) and by IRAS (25, 60, 100 microns) show pronounced nebulosity around PSR J06102100. A distance of 1 kpc in this direction corresponds to 15 pc cm-3 in NE2001. Typical cloud sizes and over-densities can accommodate this DM discrepancy. For a distance of 1 kpc (taking ), the gamma-ray luminosity would be as low as erg s-1, the Shklovskii-corrected spin-down power would be erg s-1 and the efficiency would be . A smaller distance also improves the transverse velocity estimate. The measured proper motion (Table 2) and a distance of 4 kpc imply a transverse velocity km s-1, a rather large value, given that the mean value for MSPs has been estimated to be km s-1, with a dispersion of 20 km s-1 (Lyne et al., 1998). With a distance of 1 kpc the transverse velocity of PSR J06102100 would be km s-1, very similar to the mean value for MSPs. However, we note that if the distance (thus the transverse velocity) could be larger. For example, if we impose the maximum value of allowed from the dispersion (i.e. km s-1, Lyne et al., 1998) then kpc and .
2.2.2 Search for pulsations
It has been shown that pulsation searches can be made more sensitive by weighting each event by the probability that it originates from the considered gamma-ray point source (Kerr, 2011; Guillemot et al., 2012b). These event probabilities depend on the spectra of the sources of interest and of the other sources in the region. The best-fit spectral models and the Fermi ST gtsrcprob were thus used to compute the event probabilities. The event arrival times were finally phase-folded with the Fermi plug-in distributed in the Tempo2 pulsar timing package (Hobbs et al., 2006; Ray et al., 2011). The weighted -test statistics (Kerr, 2011) obtained by reducing the regions of interest to 5∘ around the pulsars are listed in Table 3. These test statistics values all correspond to pulsation significances larger than 5 . We therefore have detected pulsed gamma-ray emission from PSRs J06102100, J10240719, J16003053, J1713+0747 and J1741+1351 for the first time, and confirmed the marginal detection of PSR J20510827 presented by Wu et al. (2012).
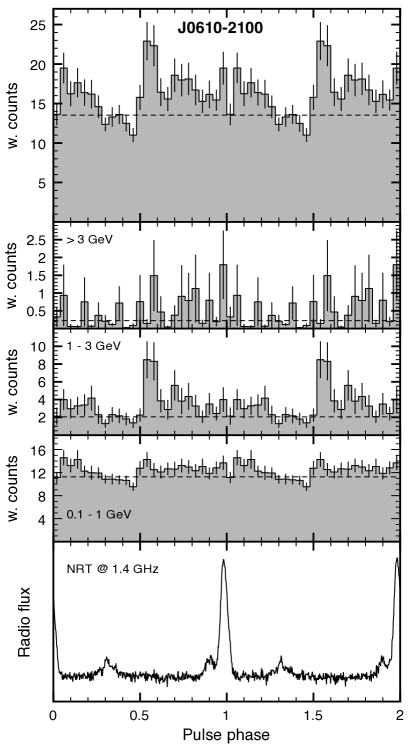
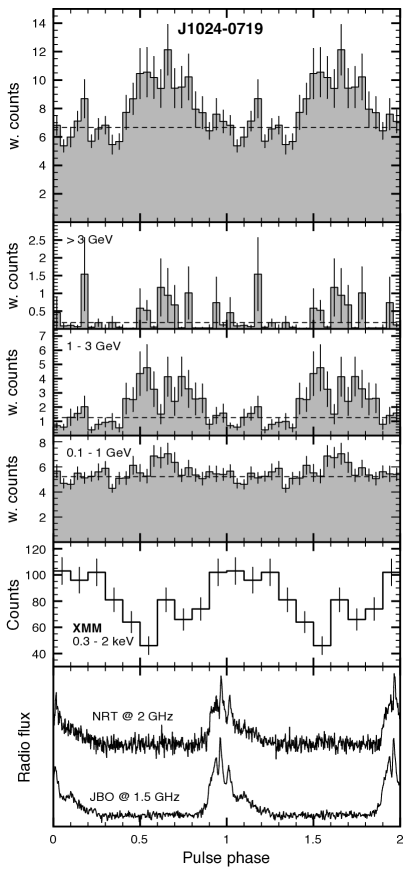
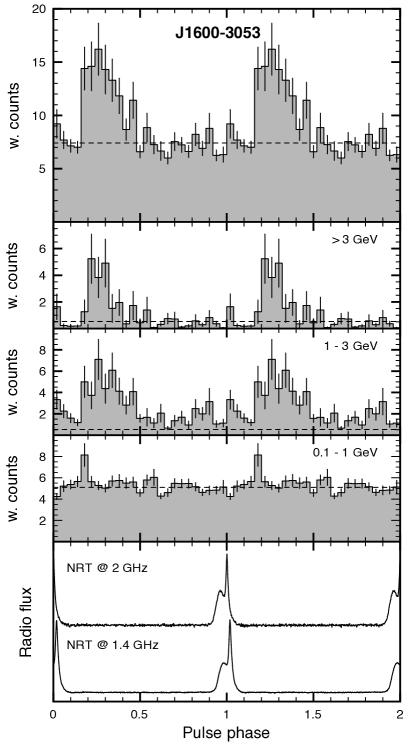
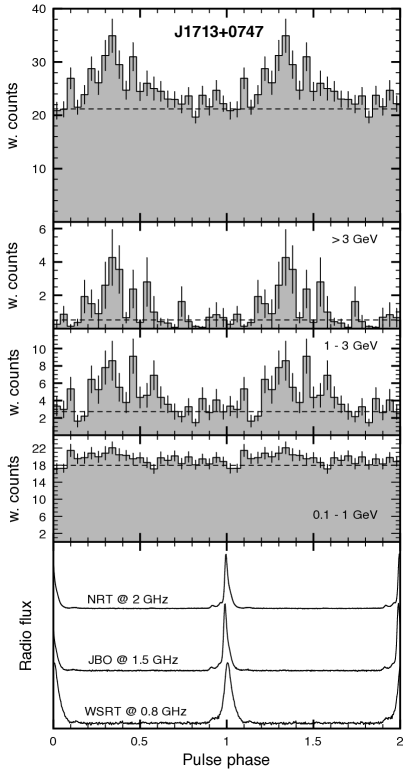
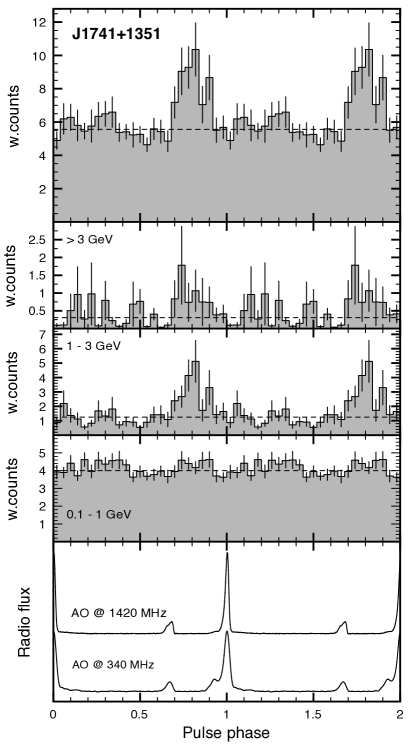
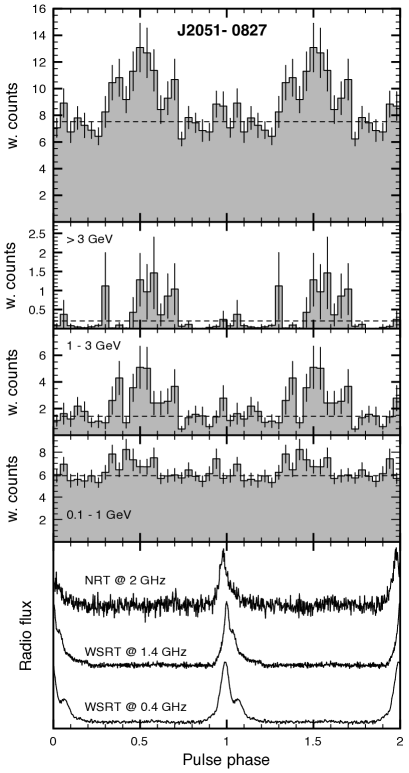
Probability-weighted gamma-ray light curves for the six MSPs are shown in Figures 1 to 6, along with radio and X-ray profiles when available. The gamma-ray background levels in these figures were obtained by summing the probabilities that the events are not due to the pulsar, as described in Guillemot et al. (2012b). Statistical error bars were calculated as , where is the event probability and runs over events in a given phase bin (Pletsch et al., 2012). In Table 3 we list the radio-to-gamma-ray lags and gamma-ray peak separations for pulsars with multiple gamma-ray peaks, where the positions of the gamma-ray peaks were determined by fitting the integrated light curves above 0.1 GeV with Lorentzian functions, and the positions of the radio peaks were defined as the maxima of the radio light curves.
| Parameter | J06102100d | J10240719 | J16003053 |
|---|---|---|---|
| Weighted -test statistics | 50.872 | 45.405 | 103.794 |
| Pulsation significance () | 6.05 | 5.69 | 8.84 |
| Gamma-ray peak multiplicity | 1 | 1 | 1 |
| Radio-to-gamma-ray lag, | 0.57 0.01 | 0.6 0.2 | 0.17 0.02 |
| Gamma-ray peak separation, | — | — | — |
| Photon index, | 1.2 0.4 | 1.3 | 1.3 |
| Cutoff energy, (GeV) | 1.6 0.8 | 2.2 0.7 | 5.0 1.8 |
| Photon flux, ( 0.1 GeV, ph cm-2 s-1) | 7.8 2.5 | 4.0 1.1 | 3.5 0.9 |
| Energy flux, ( 0.1 GeV, erg cm-2 s-1) | 6.6 1.1 | 3.8 0.7 | 5.2 1.0 |
| Luminosity, ( 0.1 GeV, erg s-1) | 10 6 | 0.11 0.05 | 4 3 |
| Efficiency, ( 0.1 GeV) | 11 27 | 0.8 0.3 | 0.5 0.4 |
| Parameter | J1713+0747 | J1741+1351 | J20510827 |
| Weighted -test statistics | 53.675 | 51.662 | 51.718 |
| Pulsation significance () | 6.23 | 6.10 | 6.10 |
| Gamma-ray peak multiplicity | 1 | 1 | 1 |
| Radio-to-gamma-ray lag, | 0.32 0.05 | 0.74 0.01 | 0.54 0.04 |
| Gamma-ray peak separation, | — | — | — |
| Photon index, | 1.6 0.3 | 1.3 | 1.3 |
| Cutoff energy, (GeV) | 2.7 1.2 | 3.1 1.6 | 2.0 0.5 |
| Photon flux, ( 0.1 GeV, ph cm-2 s-1) | 13.3 3.7 | 2.8 1.1 | 4.3 1.0 |
| Energy flux, ( 0.1 GeV, erg cm-2 s-1) | 10.2 1.5 | 3.1 0.8 | 3.8 0.7 |
| Luminosity, ( 0.1 GeV, erg s-1) | 1.5 0.3 | 0.43 0.12 | 0.5 0.2 |
| Efficiency, ( 0.1 GeV) | 0.44 0.10 | 0.020 0.005 | 0.10 0.03 |
Note.— The first quoted uncertainties are statistical, while the second are systematic. Values marked with the symbol were fixed in the spectral analysis and in these cases the systematic errors were calculated in a different manner. Details on the measurement of these parameters are given in section 2.2. For PSR J10240719, the reported gamma-ray efficiency is a lower limit, since only an upper limit on the Shklovskii-corrected period derivative, , is known (sections 2.1.1 and 2.2.1). dPlease see the discussion about this pulsar’s efficiency in section 2.2.1.
3 Multi-wavelength properties of the six MSPs
Below we present some basic information on these MSPs and detailed descriptions of their pulse profiles, in gamma rays and radio. If X-ray observations were available, descriptions of their main X-ray properties are also given.
3.1 PSR J06102100
PSR J06102100 is a ms pulsar in a -hour orbit with a M⊙ white dwarf (Burgay et al., 2006). Given the low mass of the companion and the short orbital period, PSR J06102100 is one of the Black Widow binary systems. However, in this case there are no radio eclipses nor DM variations caused by ablation of the companion star (Burgay et al., 2006), that are usually associated with these systems (e.g. PSR B195720, Fruchter et al., 1988). Pulsed gamma-ray emission seems to come mostly from the – GeV band (Fig. 1).
In X-rays, the position of PSR J06102100 has been imaged with the Swift XRT instrument in six observations performed in March 2010, April and May 2011. The effective exposures of those observations were very short, between and ks, and with the pulsar position offset from the XRT aim point by angles between and . PSR J06102100 was not detected with Swift. We used the level 2 data taken in Photon Counting mode from these six data sets ( ks of the total effective exposure) and applied the approach developed by Weisskopf et al. (2007) for statistical estimates on source detections to put a 3 limit on the XRT source count rate of cnt ks-1 (in a ′′-radius aperture centred at the pulsar radio position). Assuming, for simplicity, a power-law X-ray spectrum with a photon index and absorbing hydrogen column density cm-2 (equal to the total Galactic HI column in the pulsar direction555http://heasarc.gsfc.nasa.gov/cgi-bin/Tools/w3nh/w3nh.pl), this count rate translates into an 3 upper limit of erg s-1 for the X-ray luminosity of the pulsar in the band – keV. This limit would be more stringent if the distance is over-estimated (see the end of section 2.2.1).
PSR J06102100 has a -GHz pulse profile which consists of 3 components: a main pulse and precursor separated by 0.1 rotations and another component which lags the main pulse by about 0.3 rotations (see Fig. 1).
3.2 PSR J10240719
This is a ms isolated pulsar located less than pc from the Sun (Bailes et al., 1997). An X-ray counterpart was proposed by Becker & Trümper (1999) based on ROSAT observations and later, using XMM-Newton data, Zavlin (2006) detected pulsed emission. A candidate optical counterpart was reported by Sutaria et al. (2003) but the association could be due to positional coincidence and further observations are necessary.
The gamma-ray pulse profile of PSR J10240719 exhibits one broad gamma-ray peak, roughly half a rotation wide, with its centre preceding the radio peak by about rotation. Pulsed emission seems to be present mostly in the 1–3 GeV band.
We include the X-ray pulse profile of PSR J10240719 in Fig. 2 obtained from data collected with the EPIC-pn instrument, operated in Timing mode, in a XMM-Newton observation conducted in December 2003 for a 66-ks effective exposure (Zavlin, 2006). We processed the data as in Zavlin (2006) but using the latest XMM-Newton data reduction software (SAS v. 11.0.0). The light curve was obtained from events extracted from columns – in the one-dimensional EPIC-pn CCD image and in the – keV energy range to maximise the signal-to-noise ratio. We used the photons plugin666 http://www.physics.mcgill.ca/aarchiba/photons_plug.html for tempo2 to assign a phase to each selected photon, together with a timing ephemeris obtained from JBO observations between November 2002 and October 2004.
The H-test reports a detection of the pulsed emission, confirming the result of Zavlin (2006). The estimated intrinsic pulsed fraction, corrected for the background contribution, is %. The X-ray pulse peaks at phase –, as determined by fitting a series of harmonics to the pulse profile, and its shape indicates a predominantly thermal origin of the pulsar X-ray emission (see Zavlin, 2006, for more details).
At GHz, this pulsar presents a complex average radio pulse profile consisting of about 9 components spanning rotations, which emerge from a wider base almost half of a rotation wide. The profile at GHz looks very similar (Fig. 2). The emission at GHz is almost completely linearly polarised in the leading part of the pulse, involving the three main peaks, but it is not polarised on the trailing part (Yan et al., 2011). There is little position angle (PA) variation detected across the profile.
3.3 PSR J16003053
This is a 3.6 ms pulsar in a 14.4 day orbit with its binary companion (Jacoby et al., 2007). Its gamma-ray peak is rotations wide and exhibits a sharp leading edge and a slowly decaying trailing edge. Most pulsed emission comes from the two higher energy bands, although some pulsed emission at earlier phases may also come from the – GeV band.
PSR J16003053 was observed with XMM-Newton in February 2008 with the EPIC-MOS and EPIC-pn instruments, operated in Full Window and Timing mode (respectively), for -ks effective exposures. Data were reduced with the SAS, version 11.0.0. Examining the EPIC-MOS images around the radio position yielded no detection of the pulsar. The emission detected in the one-dimensional EPIC-pn image was heavily contaminated by enhanced background and by another bright source in the field of view. Therefore, despite the much higher sensitivity of the EPIC-pn instrument, no timing analysis of these data turned out to be meaningful (see the example of PSR J00340534 in Zavlin, 2006). Using the approach described in section 3.1, we put a 3 upper limit of cnt ks-1 on the pulsar EPIC-MOS count rates, in the – keV band (as measured from a ′′-radius aperture centred at the pulsar radio position). For the power-law X-ray model of and absorbing hydrogen column density cm-2, these count rates translate into a rather deep 3 upper limit of erg s-1 for the X-ray luminosity, in the – keV band.
The average pulse profile at GHz is dominated by a sharp pulse which is preceded by a broader additional component, less than 0.1 rotations earlier, with roughly half its amplitude. There are no major differences with the pulse profile at 2 GHz (Fig. 3). The emission at GHz is 30% linearly polarised and exhibits two orthogonal PA jumps, the second one coincident with a sense reversal of the circular polarisation (Yan et al., 2011).
3.4 PSR J1713+0747
This is a ms pulsar in a day orbit with a white dwarf (Foster et al., 1993). The gamma-ray pulse profile of PSR J17130747 is wide and roughly triangular but not exactly symmetric, with a shallower trailing edge (Fig. 4).
In the X-ray band, the position of PSR J17130747 has only been observed in four short exposures by Swift/XRT in Photon Counting mode ( ks of the total effective exposure). Using these XRT level 2 data and the same approach as in section 3.1 yielded a 3 limit of erg s-1 on the X-ray luminosity of this MSP in – keV (adopting cm-2).
The average pulse profile of PSR J17130747 at GHz consists of one sharp pulse with a weak trailing component and two small components on its base, preceding the main pulse by 0.04 and 0.08 rotations (Yan et al., 2011). Beside some broadening at lower frequencies, there are no major differences between the pulse profile at and GHz. There is a third, very shallow component visible in the three radio bands trailing the main peak by a little more than 0.1 rotations (see Fig. 4). The emission at GHz is almost 100% linearly polarised at the leading and trailing edges of the profile. There are two orthogonal PA jumps at each side of the main peak and a third one just before the shallow trailing component. The second jump (and possibly also the first) is coincident with a sense reversal of the circular polarisation (Yan et al., 2011).
3.5 PSR J1741+1351
This is a 3.8 ms pulsar in a 16 day period binary system (Jacoby et al., 2007). The gamma-ray peak of PSR J17411351 spans rotation and exhibits relatively sharp edges. Most of the emission is in the two upper energy bands and leads the radio peak, an unusual situation among gamma-ray pulsars. Other cases like this are the MSPs PSRs J17441134 and J21243358 (e.g. Abdo et al., 2013).
PSR J1741+1351 was in the field of view of the Swift XRT instrument in January 2012 for ks. However, as it was projected very close to the edge of the XRT image (with a offset angle), no meaningful limit for the pulsar X-ray flux could be derived.
The pulse profile of PSR J17411351 at GHz exhibits one sharp main pulse and a smaller 0.1 rotation wide additional component, leading the main pulse by rotations (see Fig. 5). There is also a small component on the base of the main pulse, which appears more prominent in the GHz profile. This component precedes the main pulse by rotations.
3.6 PSR J20510827
This 4.5 ms pulsar is one of the so-called Black Widow systems. It is in a 2.4 hour orbit and exhibits radio eclipses for about 10% of the orbital period, observable at low frequencies ( GHz, Stappers et al., 1996).
The gamma-ray profile of PSR J20510827 exhibits one steep, rotation wide, peak preceding the radio peak by half a period. The pulsed emission is similar in the three energy bands (Fig. 6). This profile is compatible with the light curve presented by Wu et al. (2012).
XMM-Newton observed PSR J20510827 in April 2009 with the EPIC-MOS and EPIC-pn detectors, all operated in Full Window mode, for 44 and 37-ks effective exposures, respectively. Unfortunately, these observations suffered from numerous strong particle flares that increased the background level by a factor of up to 10-12 (compared to the normal one) during about 80% of the observations. This made the XMM-Newton data practically useless for a purposeful analysis.
Five observations of this object were conducted with the Chandra ACIS-S instrument in Very Faint mode in March and July 2009 for -ks effective exposures (see also Wu et al., 2012). The aim of these observations was to search for orbital variability of the pulsar X-ray flux and did not provide a time resolution suitable to perform a timing analysis at the pulsar spin period. We reduced the data using the CIAO software, version 4.3. Despite the small number of source counts collected in each observation (– counts in a ′′-radius aperture centred at the pulsar radio position), the object was clearly detected. The combined dataset totalled 44 source counts in the – keV range, with a negligible (less than 1%) background contamination. The spatial distribution of these counts was found to be consistent with the ACIS-S point-like source image. Of the extracted source counts, 90% were detected at photon energies below 2 keV, indicating that the spectrum of PSR J20510827 is soft and likely of a thermal origin rather than of a non-thermal (magnetospheric) one. Indeed, fitting a power-law model to the extracted spectrum resulted in a large best-fitting photon index and a hydrogen column density cm-2 significantly greater than the value of cm-2 expected from the pulsar dispersion measure. Fixing cm-2 results in a power-law model with and unabsorbed flux erg cm-2 s-1 in the – keV range, in agreement with the result reported by Wu et al. (2012). The thermal blackbody model provided more reasonable parameters; cm-2, a (redshifted) temperature K and radius of the emitting area (hot polar caps on the pulsar’s surface) km. The corresponding bolometric X-ray luminosity is erg s-1. Using a non-magnetic hydrogen atmosphere model for thermal emission of MSPs (Zavlin et al., 1996; Zavlin, 2006, 2009), we obtained K, km and erg s-1. These are all unredshifted values, i.e. as measured at the neutron star surface.
Using the photons plugin for tempo2, we searched for orbital variability of the X-ray photons detected in the Chandra observations. With the scant count statistics available, we found that the significance of a possible modulation does not exceed . X-ray data of much better quality are required to elucidate the origin of the emission (whether it is thermal polar cap radiation or non-thermal flux from the pulsar magnetosphere and/or interaction of the pulsar wind with the companion).
The pulse profile of this MSP at GHz exhibits one main pulse and one overlapping trailing component about 0.05 rotations apart. Additionally, there are at least 3 smaller trailing components extending up to 0.2 rotations away, forming a shoulder. The pulse profile at GHz keeps the same principal structure but the two main peaks appear broader and slightly more separated. There are no major differences with the profile at 2 GHz (see Fig. 6). The emission at GHz is mildly linearly polarised (12%) throughout the whole profile (Xilouris et al., 1998).
4 Search for orbital modulation of the gamma-ray emission
PSRs J06102100 and J20510827 are in close binary orbits, where interactions between the wind of the pulsar and the atmosphere of the companion star are likely to occur. Accordingly, we have searched for gamma-ray flux modulations as these systems follow their orbital cycles. For completeness, we also searched for such modulations in the other three binary systems, PSRs J16003053, J17130747 and J17411351.
The Fermi-LAT sensitivity to a source varies on multiple timescales, most notably the spacecraft’s orbital period (95 minutes) and period of precession (53 days). Beats between the binary orbital frequency and harmonics of these timescales induce an apparent modulation of photon rate as a function of orbital phase. Searches for intrinsic modulation must therefore carefully correct for the time-dependent sensitivity (e.g. Corbet & Kerr, 2010; Guillemot et al., 2012b).
Because of the relatively low count rates, we decided to adapt an unbinned pulsation statistic, the H-test (de Jager et al., 1989), for use with uneven exposure. To do this, we computed the exposure to the source with s resolution over broad energy bands (2 per decade). We used Tempo2 and the timing solutions of §2.1.1 to compute the orbital phase for each s interval and took the resulting distribution of phases, , to represent the null hypothesis of no intrinsic modulation. By definition, the quantity , with the observed orbital phases, is a uniformly distributed random variable in the absence of intrinsic modulation, and thus suitable for use in the H-test.
Using this modified H-test, along with the photon weights (see §2.2), we searched for a signal in individual energy bands (100–300, 300–1000, 1000–3000, 3000–10000, and 10000–30000 MeV) as well as cumulatively (100, 300, 300 MeV, etc.). We detected no significant orbital modulation of the gamma-ray signal from any of the sources.
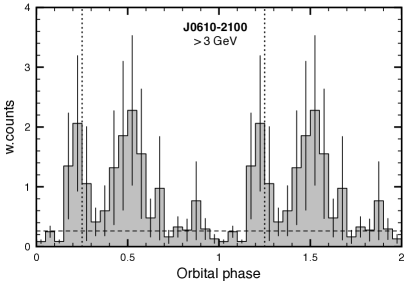
This null result is physically expected for the binary systems with long orbits, where no direct interaction between the two bodies is feasible. In the case of PSR J20510827, this result is also unsurprising as no evidence for interaction of the pulsar wind with the companion star is seen in the X-ray spectrum (see section 3.6). Interestingly, the weighted orbital light curve at energies above 3 GeV for PSR J06102100 presents two peaks, suggesting the presence of orbital modulation of the emission at these energies (Fig. 7). However, there are very few events above 3 GeV and the peaks observed could be the effect of low statistics; indeed, the H-test for this set of events indicates only a 2 significance. Furthermore, the light curve of the background photons (obtained by assigning a weight to every event in the same 5 deg ROI, see section 2.2.2.) for this source seems to follow the same shape in Fig. 7. Although fairly flat, the exposure folded curve for PSR J06102100 also presents local peaks at similar orbital phases ( and ).
Finally, we performed a Monte Carlo study to determine the sensitivity to a few particular types of modulation. For each pulsar, we use the observed weights and an assumed morphology for the orbital modulation to generate 100 random realisations of the orbital phases. We then vary the strength of the modulation until 95 of the 100 simulations exceed the statistical threshold, taken to be , or a 2 detection.
We find in general that only strong modulations are detectable. Sinusoidal modulation is detectable for PSRs J06102100 and J17130747 if 70% of the total flux is modulated, while not even 100% sinusoidal modulation is reliably detectable for the remaining sources. On the other hand, such high levels of modulation, which imply additional, non-magnetospheric sources of gamma-ray emission from the system, are incompatible with the estimated background levels of the rotational phase light curves (Figs. 1 to 6).
For the case of a notch in otherwise-steady emission (an eclipse), we find that the sensitivity depends strongly on the notch width. Any gamma-ray eclipse is expected to be narrow, and unfortunately the LAT is largely insensitive to such small features. Eclipses become detectable for PSRs J06102100 and J17130747 when they span 20% of the orbit, while even greater values (30–50%) are required for the remaining sources. Thus, while we can rule out extreme cases of modulation (fully-modulated sinusoids, broad eclipses), our sensitivity study shows the null results discussed above are not highly constraining.
5 Radio and gamma-ray properties of the gamma-ray MSP population
Our sample of 30 MSPs is constituted by all MSPs known to emit in gamma rays at the time of writing (published or publicly announced). We have compiled published radio pulse profiles and measurements of the radio spectral index (), radio flux densities, average degree of radio linear polarisation through the main radio pulse, phase lag of the closest gamma-ray peak to the main radio peak (), gamma-ray photon index () and flux for each of the 30 MSPs in the sample. Table 4 gives some of these quantities and also lists references where gamma-ray and radio pulse profile plots can be found.
| Pulsar | Type | References | |||||
|---|---|---|---|---|---|---|---|
| ms | G | % | rotations | ||||
| J00300451 | 4.87 | 1.8 | ? | (2) | 0.160(1) | N | 1; 1; 21; 25 |
| J00340534 | 1.88 | 13.6 | 0(10) | (1) | 0.97(1) | A | 2; 14; 22; 22 |
| J01016422 | 2.57 | 6.1 | 18(3) | – | 0.15(1) | N | 3; –; 21; 3 |
| J02184232 | 2.32 | 31.4 | 22(10) | (2) | 0.71(2) | W | 2; 15; 21; 25 |
| J03404130 | 3.30 | 4.1 | – | (7) | 0.3(1) | N | –; 16; 30; 16 |
| J04374715 | 5.76 | 1.4 | 24(1) | (5) | 0.44(1) | N | 4, 5; 14; 21; 25 |
| J06102100 | 3.86 | 1.2 | – | – | 0.1(1) | N | –; –; 21; 30 |
| J06130200 | 3.06 | 5.4 | 17(3) | (5) | 0.26 | N | 5, 6, 7; 14; 21; 25 |
| J06143329 | 3.15 | 7.0 | – | (6) | 0.126(2) | N | –; 17; 21; 26 |
| J07511807 | 3.48 | 3.6 | 29(2) | (3) | 0.40(1) | N | 8; 18; 21; 25 |
| J10240719 | 5.16 | 52(4) | (2) | 0.47 | N | 5, 8, 6; 18; 21; 30 | |
| J11255825 | 3.10 | 13.4 | – | – | 0.6 | N | –; –; 23; 9 |
| J12311411 | 3.68 | 5.4 | – | – | 0.24 | N | –; –; 21; 26 |
| J14464701 | 2.19 | 13.1 | 20(5) | – | 0.5 | N | 9; –; 23; 9 |
| J16003053 | 3.60 | 3.5 | 30(4) | (6) | 0.16(2) | N | 5, 6; 19; 21; 30 |
| J16142230 | 3.15 | 5.2 | – | – | 0.19 | N | –; –; 21; 25 |
| J17130747 | 4.57 | 1.9 | 26(4) | (1) | 0.32(5) | N | 5, 8, 6; 18; 21; 30 |
| J17411351 | 3.75 | 5.8 | – | – | 0.76(2) | N | –; –; 21; 30 |
| J17441134 | 4.08 | 2.3 | 90(4) | (7) | 0.82(1) | N | 5, 6; 14; 21; 25 |
| B182030A | 5.44 | 24.8 | 0(10) | (9) | 0.99(1) | A | 2; 14; 21; 27 |
| J19025105 | 1.74 | 22.1 | 0(10) | – | 1.0 | A | 10; –; 21; 10 |
| B193721 | 1.56 | 99.5 | 27(2) | (2) | 0.990(4) | A | 2, 5, 8, 11; 18; 24; 24 |
| B195720 | 1.61 | 25.2 | 0(3) | (5) | 0.99(2) | A | 11, 12; 18; 24; 24 |
| J20170603 | 2.90 | 5.9 | – | – | 0.21(1) | W | –; –; 21; 28 |
| J20431711 | 2.38 | 8.0 | – | – | 0.131(4) | N | –; –; 21; 29 |
| J20510827 | 4.51 | 2.4 | 12(1) | (9) | 0.51(4) | N | 8, 6; 14; 21; 30 |
| J21243358 | 4.93 | 1.9 | 24(8) | (8) | 0.87(1) | W | 5; 14; 21; 25 |
| J22143000 | 3.12 | 6.4 | 25(5) | (5) | 0.27(1) | N | 13; 13; 21; 26 |
| J22415236 | 2.19 | 10.7 | – | (1.4) | 0.14(1) | N | –; 20; 21; 23 |
| J23024442 | 5.20 | 1.7 | – | – | 0.45(1) | W | –; –; 21; 28 |
Note.— Columns contain: pulsar name, magnetic field at the light cylinder (), mean degree of linear polarisation , radio spectral index , radio lag () and type of MSP, according to the classification in section 5. Uncertainties on the last quoted digit are indicated between parentheses. For the average linear polarisation, the errors quoted correspond to a rough and conservative estimate of the standard deviation from several measurements made by different authors, preferably around GHz. Type labels marked with the symbol are for those MSPs with radio and gamma-ray pulses overlapping in phase but not considered as aligned (section 5.1.1). The 4 references in the last column are for , , and for a gamma-ray/radio pulse profile plot: (1) Lommen et al. (2000); (2) Stairs et al. (1999); (3) Kerr et al. (2012); (4) Navarro et al. (1997); (5) Yan et al. (2011); (6) Ord et al. (2004); (7) Manchester & Han (2004); (8) Xilouris et al. (1998); (9) Keith et al. (2012); (10) Camilo et al. (2012); (11) Thorsett & Stinebring (1990); (12) Fruchter et al. (1990); (13) P. Demorest, S. Ramson (priv. communication) (14) Toscano et al. (1998); (15) Navarro et al. (1995); (16) Bangale et al. (in preparation) (17) S. Ransom (priv. communication) (18) Kramer et al. (1998); (19) Demorest et al. (2012); (20) M. Keith (priv. communication) (21) Abdo et al. (2013); (22) Abdo et al. (2010a); (23) Keith et al. (2011); (24) Guillemot et al. (2012b); (25) Abdo et al. (2010b) (26) Ransom et al. (2011) (27) Freire et al. (2011a) (28) Cognard et al. (2011) (29) Guillemot et al. (2012a) (30) This work;
5.1 Radio and gamma-ray pulse profile properties
Considering properties like phase-alignment between radio and gamma-ray peaks (above 0.1 GeV), radio duty cycle and number of pulse components, we define three main groups and label them A, N and W (Table 4). Although this analysis is based mainly on the inspection of average pulse profiles at GHz, we also inspected pulse profiles at lower and higher radio frequencies. None of the MSPs studied exhibits appearance or disappearance of pulse components (though, see comments on PSR B1957+20 below and on PSR J0218+4232 in section 5.1.2). We note that pulse-profile evolution with frequency is observed in some other MSPs.
5.1.1 Type A(ligned)
These are the MSPs which have their main gamma-ray peak aligned with the main radio pulse. There are five objects in this group (Table 4).
All of the A-type MSPs exhibit two main radio peaks, with each of them composed of one or more components. In two cases (PSRs B1937+21 and B1957+20) the second peak appears as an interpulse, i.e. half a rotation away from the main pulse. However, in the case of PSR B1937+21, low level emission detected between the peaks suggested that both peaks may not be due to emission produced at opposite magnetic poles but somewhere in the outer magnetosphere (Yan et al., 2011). Only five MSPs in the whole sample present secondary peaks about half a rotation away from the main pulse.
For the five A-type MSPs, all radio peaks have a gamma-ray counterpart. The only exception might be PSR B1957+20, for which the second radio peak visible at GHz, leading the main peak by rotation, appears not to have an obvious gamma-ray counterpart. We note that this peak is not visible at lower radio frequencies (e.g. GHz).
Four MSPs in this group exhibit very low or undetectable levels of linear polarisation in their radio emission (Table 4). This seems to be a property exclusive to A-type MSPs: all other gamma-ray MSPs in the sample for which polarisation data were available exhibit normal levels of linear polarisation. The only A-type MSP showing some degree of linear polarisation is PSR B1937+21.
5.1.2 Type N(on-aligned)
These are MSPs having their main gamma-ray peak out of phase with the main radio peak and their radio emission dominated by a single peak. Two MSPs in this group present gamma-ray pulses almost phase-coincident with their main radio pulses (PSRs J17441134 and J22143000). However, they are not exactly aligned and their peaks lead the radio peak, which is unusual among gamma-ray pulsars; though it is also seen in the light curves of the MSPs PSR J1741+1351 and PSR J21243358. These objects may belong to a different class of MSPs, in terms of morphology (cf. Venter et al., 2009; Johnson, 2011).
There seems to be some gamma-ray emission, besides the main peak of emission, at the radio pulse phase in at least 3 objects (PSRs J0340+4130, J06102100 and J10240719). There are 21 N-type MSPs in total, two of them exhibiting an interpulse (PSRs J0030+0451 and J01016422).
5.1.3 Type W(ide)
This is a group of four MSPs that have their main gamma-ray peak out of phase with the main radio peak and whose radio emission consist of multiple peaks of comparable amplitude, covering most of the rotational period. PSR J0218+4232 presents a secondary radio pulse component coincident with the gamma-ray peak of emission. This radio component is stronger at lower radio frequencies ( GHz), becoming comparable in strength to the main radio peak (Kuiper et al., 2002). There also seems to be alignment between some secondary radio components and the main gamma-ray peak for PSRs J21243358 and J23024442. Nevertheless, they are not proper A-type pulsars because not all of their radio peaks are aligned with gamma-ray peaks. In addition, it must be noted that given the large number of radio components and their long duty cycles, these could be mere coincidences. Besides these practical reasons, there is a physical reason to keep the W and N groups separated. The W-type pulsars are possibly aligned rotators, i.e. pulsars with their magnetic axes almost coincident with their rotation axes, a situation that could affect their observed properties.
5.2 Magnetic field at the light cylinder
The dipole magnetic field strength of a pulsar is normally calculated by assuming that all rotational energy losses are due to dipole radiation. Its value at the light cylinder can be estimated by (e.g. Lorimer & Kramer, 2005)
| (2) |
At the light cylinder, the co-rotational velocity is equal to the speed of light, , and its radius is therefore given by , where is the rotation period. This implies that gamma-ray MSPs have the smallest light cylinder radii, followed by rapidly spinning young pulsars like the Crab pulsar. Because of the weak dependance of on and the different ranges exhibited by MSPs and young pulsars, both populations share similar values, the largest among the whole pulsar population ( G).
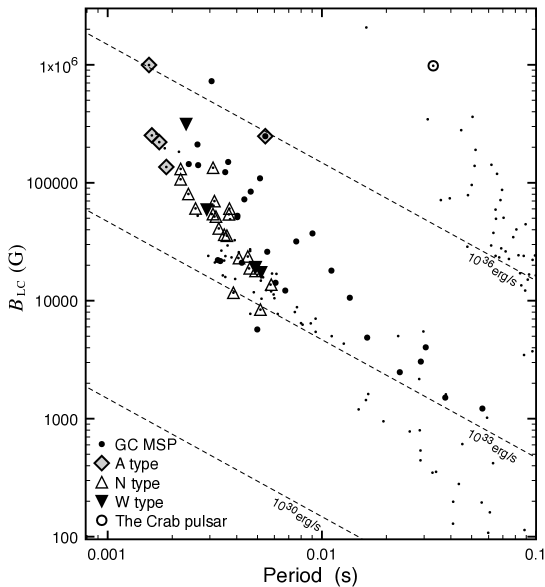
A-type MSPs tend to have higher values than the rest of the population. Fig. 8 shows as a function of for all known pulsars having s. If proper motion measurements were available through the ATNF Pulsar Catalogue, the values were corrected for the Shklovskii effect (Table 4). Lines of constant spin-down energy rate (where is the moment of inertia of the star, assumed to be g cm2) are plotted with dashed lines. Most MSPs populate the lower branch crossing the centre of the plot and the 30 gamma-ray MSPs in our sample populate its higher end, towards the shortest periods, and larger and values. The MSPs from the three types described in the last section are plotted using different symbols. A-type MSPs are near the top left corner, with the shorter periods and the higher and values (Johnson, 2011).
PSR B182330A is one of the A-type MSPs in the plot and, considering its period, shows a relatively large . This MSP is in a globular cluster (GC) and has a very large , hence its large . Freire et al. (2011a) studied the gamma-ray emission of this MSP and concluded that the observed is intrinsic to the pulsar and not due to acceleration in the cluster. MSPs in GCs are marked in Fig. 8 and, due to possible contamination of their values produced by movement in the gravitational potential of a GC, their values are uncertain.
A 2-dimensional Kolmogorov-Smirnov (KS) test (Fasano & Franceschini, 1987; Press et al., 1992) between A-type MSPs and N and W types combined indicates that the probability that they belong to the same – distribution is less than 1%. However, the significance of the 2-dimensional KS test remains valid while (Press et al., 1992) and, in this case, . To check these results further, we also tried the standard 1-dimensional KS test, that can be applied for lower number of objects (valid for , Press et al., 1992). Comparing the BLC-values of the five A-type MSPs with the 25 N and W types gives 0.02% probability that they belong to the same distribution. To quantify how likely it is to obtain such a value by selecting a small group at random, we randomly picked five MSPs from the sample and calculated the KS test against the remaining 25 objects. After repeating this 30,000 times we obtained that for more than 99% of the cases the KS test null hypothesis probability is greater than 0.02%, with 67% of the cases having a probability greater than 40%. Therefore, we conclude that the distribution of -values of the A-type MSPs is significantly different to that of the rest of the gamma-ray MSPs.
We acknowledge, nonetheless, that the above results might be driven by the very short periods that most of the A-type MSPs have, compared to those of the N and W types together. Indeed, while the KS test gives a probability of 41% for the values being from the same distribution, the same test gives only 0.4% probability that the periods belong to the same distribution. However, this is about 10 times larger than the probability obtained for . If values are considered instead, the probability is 1%, which is again 50 times larger than what is obtained for values. Moreover, as will be discussed in section 6, the comparison with the Crab pulsar plus other considerations hint towards being the relevant parameter, rather than or .
5.3 Radio spectral indices
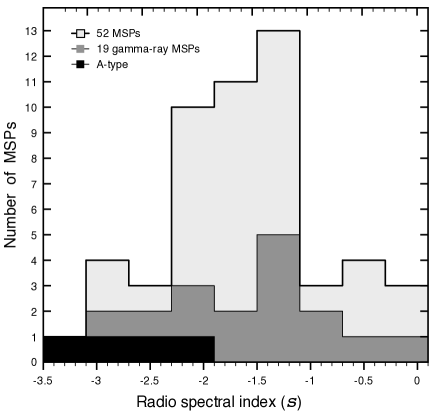
The radio spectral index corresponds to the slope of the spectrum in a logarithmic scale, in which the flux density is described by . Out of the 30 MSPs in the sample, we have spectral information for 19 of them (Table 4). These data show that A-type MSPs tend to have lower spectral indices than the rest of our sample. Below we assess the significance of this observation.
The distribution of spectral indices for all the gamma-ray MSPs together with 33 additional MSPs for which spectral information was available is shown in Fig. 9, indicating the contribution made by the A-type MSPs. Data were collected from the ATNF Pulsar Catalogue, from the compilations in Lorimer et al. (1995), Kramer et al. (1998) and Toscano et al. (1998), and from flux densities at different frequencies obtained via private communication with M. Keith and S. Ransom. Note that the error bars of the -values sometimes may not reflect the intrinsic difficulties associated with flux density measurements, which directly affect the spectral index estimate. While the distribution of gamma-ray MSPs seems to follow the general distribution, with a mean spectral index above (consistent with Kramer et al., 1998; Toscano et al., 1998), the mean value for the A-type gamma-ray MSPs clearly falls below (see Fig. 9).
To test how significant the difference between the distributions of the different sets is, we again use the KS test. A KS test over the values of four A-type MSPs against the remaining 15 gamma-ray MSPs (Table 4) indicates a probability of 0.6% that both sets belong to the same distribution. If the test is applied for the A-type MSPs against all other MSPs in Fig. 9 the probability falls to 0.2%. Therefore, it appears that the A-type MSPs have distinctively low -values. We note, however, that for the first KS test mentioned above, (see section 5.2). On the other hand, the test indicates a probability of 56.7% that the values of all gamma-ray MSPs belong to the overall distribution, indicating that in general there is no evidence for different radio spectral behaviour between gamma-ray MSPs and the rest of the MSP population.
We also checked how likely it is to obtain an distribution such as the one exhibited by the A-type MSPs by pure chance. To do so, we randomly picked four values from the -distribution of all gamma-ray MSPs and calculated the probability of them being from the same distribution as the remaining 15. After repeating this process many times, we find that more than 99% of the trials give a probability greater than 0.6%, with more than 66% of the trials giving a probability greater than 40%. Thus, the particular -distribution of A-type MSPs appears to be truly different.
We find no correlation between and the gamma-ray spectral index or photon index, , for the MSPs in the sample. Nonetheless, we note that values of are tightly clustered, with a scatter smaller than unity (Abdo et al., 2010b). As well, no obvious correlation was found between and any other investigated parameter.
5.4 Fluxes
There are radio flux densities at GHz available for 23 of the 30 MSPs in our sample and gamma-ray fluxes for all of them. These last values are preliminary results of the ongoing effort to produce the second Fermi LAT Catalog of gamma-ray pulsars by the Fermi collaboration (Abdo et al., 2013). For many MSPs in the sample, flux values can also be found in the references given for the gamma-ray light curves in Table 4. We find no obvious correlation between radio flux densities and gamma-ray fluxes (Ackermann et al., 2012b).
Fluxes are expected to be at least slightly correlated because of their mutual dependance on distance. The fact that this correlation is not observed in the sample suggests that radio and/or gamma-ray fluxes are highly dependent upon geometrical factors and probably other intrinsic properties dependant on and . No correlation between these fluxes, or their ratio, and any other quantity was found.
5.5 Linear polarisation
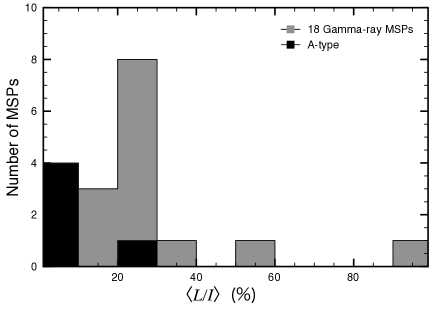
We found published average radio linear polarisation data for 17 MSPs in our sample. No correlation is found between this parameter and any other studied quantity. However, we note that the four MSPs with very low (or zero) are all A-type (PSRs J00340534, B182030A, J19025105 and B1957+20, see Fig. 10).
6 Discussion
6.1 Gamma-ray MSPs at a glance
By studying the radio and gamma-ray pulse profiles of 30 MSPs we have classified gamma-ray MSPs into 3 types, labelled A, N and W. The first group is composed by MSPs exhibiting pulsed gamma-ray emission phase-aligned with their radio emission. The N and W type MSPs exhibit misaligned emission, with the N-types presenting radio emission dominated by a single pulse and the W-type presenting multiple and wide radio pulses of comparable amplitude. While the N and W types appear to constitute the norm among gamma-ray MSPs, A-type MSPs appear less frequently and present various notable differences from the rest of the population. We note that these properties are not shared by PSRs J17441134 and J2214+3000, the two MSPs which could have possibly been regarded as A-type (see sections 5.1.1 and 5.1.2).
W-type MSPs are more likely to be aligned rotators, with their rotation axes almost coincident with their magnetic axes. This situation, however, does not appear to drive obvious trends either in their gamma-ray profiles or any of the other studied parameters.
The difference in rotational phase between radio and gamma-ray pulses has commonly been interpreted as a difference in the location, within the pulsar’s magnetosphere, where the emission is generated. Standard models normally place the source of radio emission at lower altitudes compared to the source of gamma rays, in accordance with the radio/gamma-ray misalignment observed for most gamma-ray pulsars and MSPs. However, in light of the newly detected MSPs exhibiting phase-aligned emission, other possibilities ought to be considered. In the two most likely scenarios, both radio and gamma-ray emission are generated either relatively near the surface of the neutron star (low-altitude Slot Gap (laSG) models) or over an extended region at higher altitudes (altitude-limited Open Gap (alOG) and altitude limited Two Pole Caustic (alTPC) models (cf. Venter et al., 2012)). Although the alTPC model seems to offer better fits for some A-type MSPs, further studies are necessary to better understand the emission mechanisms operating in these pulsars.
Nonetheless, models involving a caustic origin for the radio emission (at high altitudes) predict low levels of linear polarisation and rapid swings of the polarisation position angle (Dyks et al., 2004). In such models, rapid position angle swings with phase and depolarisation of the total emission would be an effect of mixing signals from different altitudes (Venter et al., 2011). This is indeed observed in some, but not all, of the A-type MSPs (section 5.5; Table 4).
It has been noted that for high non-MSP pulsars the degree of linear polarisation may be correlated with (Weltevrede & Johnston, 2008). Moreover, based on their wide beams, it was argued that the radio emission of some of these pulsars is produced at a large range of heights. Their polarisation levels, however, appear high, contrary to what is argued above to explain the lack of polarised emission in some A-type MSPs. Also, A-type MSPs have the largest values among MSPs, defying the correlation found by Weltevrede & Johnston (2008). Nevertheless, normal pulsars have larger light cylinder radii than MSPs and it might be that depolarisation is less efficient in their larger magnetospheres.
In the smaller magnetospheres of MSPs the production of radio emission could naturally extend up to larger fractions of , producing the observed wide beams (Yan et al., 2011) and the phase-aligned profiles of A-type MSPs (Harding, 2005). In fact, A-type MSPs have shorter rotation periods than the other MSPs (Fig. 8). Based on a study of the beaming fractions of the radio and gamma-ray emission, Ravi et al. (2010) concluded that the radio emission of high- pulsars (including MSPs) must originate higher up in the magnetosphere, near where the gamma-ray emission is produced. This is consistent with the high- values of A-type MSPs. The Crab pulsar is the only non-MSP known to exhibit nearly phase-aligned radio and gamma-ray emission (Kuiper et al., 2003). We note that for the Crab pulsar is almost 3 orders of magnitude larger than the highest values among MSPs and that many young gamma-ray pulsars have values similar to those of the A-type MSPs, but show misaligned emission. Also, while the Crab pulsar has the second smallest value among normal pulsars, it is more than one order of magnitude larger than those of the A-type MSPs. If was the main factor determining the alignment between radio and gamma-ray emission, we would expect to see this alignment for most MSPs, which is not observed. On the other hand, if was the main factor, we would expect to see more young gamma-ray pulsars exhibiting aligned radio/gamma-ray emission, which is not the case. Considering the KS-tests described in section 5.2 and the position of the Crab pulsar in Fig. 8, appears to be a natural common property among A-type MSPs and the Crab pulsar. We note that the polarisation levels of the Crab pulsar’s radio emission appear to be well above zero (Gould & Lyne, 1998).
The Crab pulsar and A-type MSPs all have similar radio spectra. The radio spectral index of the Crab pulsar is (Lorimer et al., 1995), substantially steeper than the average of for MSPs and of for normal pulsars (Toscano et al., 1998; Maron et al., 2000). Although viewing angles and other geometric factors can bias our measurements, the steep radio spectra of the A-type MSPs and the Crab pulsar, together with their high values, are likely to be related to magnetospheric similitudes and common processes on the generation of their emission.
The emission of Giant radio Pulses (GPs) is another common feature among A-type MSPs and the Crab pulsar. GPs are sporadic, short and intense bursts of radio emission, following power-law energy statistics. They were originally detected in the emission of the Crab pulsar and later in PSR B1937+21 (Heiles et al., 1970; Cognard et al., 1996). Today there are 8 pulsars and 5 MSPs known to emit these type of pulses (Knight et al., 2005; Knight, 2006). The GP properties exhibited by the Crab pulsar differ from most other pulsars but are very similar to those exhibited by the 5 MSPs found to emit GPs (Knight, 2006). Three of these MSPs are A-type: PSRs B1937+21, B1957+20 (Knight et al., 2006) and B1820-30A (Knight et al., 2005) and the other two are PSRs J0218+4232 (Joshi et al., 2004), a W-type MSP, and B182124 (Romani & Johnston, 2001), for which no gamma-ray pulses have been detected with a confidence above 5 (Pellizzoni et al., 2009). It has been proposed that the relatively large values exhibited by these 5 MSPs and the Crab pulsar could be the main physical factor determining the generation and the main properties of their GPs (Cognard et al., 1996, but see discussion in Knight et al. (2006)). Future observations and careful analyses should discern whether the emission of GPs is somewhat connected to the alignment between radio and gamma-ray emission or is mere coincidence. No GPs were detected for the A-type PSR J00340534 (Knight et al., 2005).
The wide pulse profiles that MSPs generally have, compared to normal pulsars (Yan et al., 2011), could be understood as evidence for outer-magnetosphere caustic radio emission for all types of MSPs. One could argue that the outer magnetosphere offers enough room for different emission locations for radio and gamma rays. However, we have shown that A-type MSPs exhibit different emission properties. Could the availability of larger magnetic fields at the light cylinder generate conditions, in relatively smaller magnetospheres, that favour the generation of radio emission at higher altitudes (at least as a fraction of ) and co-located with the production of gamma rays? Would this somewhat different emission mechanism naturally produce a steeper spectra and favour the production of giant pulses? Any model describing phase-aligned radio and gamma-ray emission should take these properties into consideration.
7 Summary
We have presented the detection by the Fermi LAT of gamma-ray pulsations from six MSPs, five of them detected for the first time and a sixth one, PSR J20510827, confirmed at the 5 level. The six MSPs present properties which are common among the gamma-ray MSP population. All of these pulsars are significantly detected in the radio domain, but due to the low conversion of spin-down energy into X-rays, only two are detected significantly in X-rays.
By studying the morphology and phase relationship of radio and gamma-ray pulse profiles of a sample of 30 MSPs, we grouped gamma-ray MSPs into three types. The most distinctive type of gamma-ray MSPs are those exhibiting phase-aligned radio/gamma-ray emission. We find some clear trends in their emission properties, which differ significantly from the rest of the MSP population. We showed that the MSPs in this group have a radio spectra steeper than the rest of the MSP population and that they also have among the highest inferred magnetic field strengths at the light cylinder. Additionally, some MSPs in this group have distinctively low degrees of radio linear polarisation and some of these type are amongst the handful of MSPs known to emit giant radio pulses. Many of these properties are also observed from the Crab pulsar, the only normal radio pulsar known to emit gamma-ray emission phase-aligned with its radio emission.
The use of combined information obtained through the study of phase aligned gamma-ray, X-ray and radio emission, along with their intrinsic properties, offers a wide perspective that certainly helps to improve our understanding of the emission mechanism of pulsars.
Acknowledgments
The Fermi LAT Collaboration acknowledges generous ongoing support from a number of agencies and institutes that have supported both the development and the operation of the LAT as well as scientific data analysis. These include the National Aeronautics and Space Administration and the Department of Energy in the United States, the Commissariat à l’Energie Atomique and the Centre National de la Recherche Scientifique / Institut National de Physique Nucléaire et de Physique des Particules in France, the Agenzia Spaziale Italiana and the Istituto Nazionale di Fisica Nucleare in Italy, the Ministry of Education, Culture, Sports, Science and Technology (MEXT), High Energy Accelerator Research Organization (KEK) and Japan Aerospace Exploration Agency (JAXA) in Japan, and the K. A. Wallenberg Foundation, the Swedish Research Council and the Swedish National Space Board in Sweden. Additional support for science analysis during the operations phase is gratefully acknowledged from the Istituto Nazionale di Astrofisica in Italy and the Centre National d’Études Spatiales in France.
The Nançay Radio Observatory is operated by the Paris Observatory, associated with the French Centre National de la Recherche Scientifique (CNRS). The Lovell Telescope is owned and operated by the University of Manchester as part of the Jodrell Bank Centre for Astrophysics with support from the Science and Technology Facilities Council of the United Kingdom. The Westerbork Synthesis Radio Telescope is operated by Netherlands Foundation for Radio Astronomy, ASTRON. The Parkes radio telescope is part of the Australia Telescope which is funded by the Commonwealth Government for operation as a National Facility managed by CSIRO. We thank our colleagues for their assistance with the radio timing observations. The Arecibo Observatory is operated by SRI International under a cooperative agreement with the National Science Foundation (AST-1100968), and in alliance with Ana G. Méndez-Universidad Metropolitana, and the Universities Space Research Association.
References
- Abdo et al. (2010a) Abdo A. A. et al., 2010a, ApJ, 712, 957
- Abdo et al. (2009) Abdo A. A. et al., 2009, Science, 325, 848
- Abdo et al. (2010b) Abdo A. A. et al., 2010b, ApJS, 187, 460
- Abdo et al. (2013) Abdo A. A., et al., 2013, ApJ Suppl., in preparation
- Ackermann et al. (2012a) Ackermann M. et al., 2012a, ApJS, 203, 4
- Ackermann et al. (2012b) Ackermann M. et al., 2012b, ApJ, 753, 83
- Alpar et al. (1982) Alpar M. A., Cheng A. F., Ruderman M. A., Shaham J., 1982, Nature, 300, 728
- Bailes et al. (1997) Bailes M. et al., 1997, ApJ, 481, 386
- Becker & Trümper (1999) Becker W., Trümper J., 1999, A&A, 341, 803
- Bhattacharya & van den Heuvel (1991) Bhattacharya D., van den Heuvel E. P. J., 1991, Phys. Rep., 203, 1
- Burgay et al. (2006) Burgay M. et al., 2006, MNRAS, 368, 283
- Camilo et al. (2012) Camilo F., et al., 2012, ApJ, in preparation.
- Cognard et al. (2011) Cognard I. et al., 2011, ApJ, 732, 47
- Cognard et al. (1996) Cognard I., Shrauner J. A., Taylor J. H., Thorsett S. E., 1996, ApJ, 457, L81
- Corbet & Kerr (2010) Corbet R. H. D., Kerr M., 2010, arXiv:1001.4718v1
- Cordes & Lazio (2002) Cordes J. M., Lazio T. J. W., 2002, preprint (arXiv:astro-ph/0207156)
- de Jager et al. (1989) de Jager O. C., Raubenheimer B. C., Swanepoel J. W. H., 1989, A&A, 221, 180
- Demorest et al. (2012) Demorest P. B. et al., 2012, astro-ph (arXiv:1201.6641)
- Doroshenko et al. (2001) Doroshenko O., Löhmer O., Kramer M., Jessner A., Wielebinski R., Lyne A. G., Lange C., 2001, A&A, 379, 579
- Dyks et al. (2004) Dyks J., Harding A. K., Rudak B., 2004, ApJ, 606, 1125
- Dyks & Rudak (2003) Dyks J., Rudak B., 2003, ApJ, 598, 1201
- Eichler & Levinson (1988) Eichler D., Levinson A., 1988, ApJ, 335, L67
- Fasano & Franceschini (1987) Fasano G., Franceschini A., 1987, MNRAS, 225, 155
- Foster et al. (1993) Foster R. S., Wolszczan A., Camilo F., 1993, ApJ, 410, L91
- Freire et al. (2011a) Freire P. C. C. et al., 2011a, Science, 334, 1107
- Freire et al. (2011b) Freire P. C. C. et al., 2011b, MNRAS, 412, 2763
- Freire et al. (2013) Freire P. C. C., et al., 2013, in preparation.
- Fruchter et al. (1990) Fruchter A. S. et al., 1990, ApJ, 351, 642
- Fruchter et al. (1988) Fruchter A. S., Stinebring D. R., Taylor J. H., 1988, Nature, 333, 237
- Gould & Lyne (1998) Gould D. M., Lyne A. G., 1998, MNRAS, 301, 235
- Guillemot et al. (2012a) Guillemot L. et al., 2012a, MNRAS, 422, 1294
- Guillemot et al. (2012b) Guillemot L. et al., 2012b, ApJ, 744, 33
- Harding (2005) Harding A. K., 2005, astro-ph (arXiv:0503300)
- Heiles et al. (1970) Heiles C., Campbell D. B., Rankin J. M., 1970, Nature, 226, 529
- Hobbs et al. (2004) Hobbs G., Lyne A. G., Kramer M., Martin C. E., Jordan C., 2004, MNRAS, 353, 1311
- Hobbs et al. (2006) Hobbs G. B., Edwards R. T., Manchester R. N., 2006, MNRAS, 369, 655
- Hotan et al. (2006) Hotan A. W., Bailes M., Ord S. M., 2006, MNRAS, 369, 1502
- Jacoby et al. (2007) Jacoby B. A., Bailes M., Ord S. M., Knight H. S., Hotan A. W., 2007, ApJ, 656, 408
- Johnson (2011) Johnson T. J., 2011, PhD thesis, (arXiv:1209.4000), University of Maryland, College Park, MD, USA
- Joshi et al. (2004) Joshi B. C., Kramer M., Lyne A. G., McLaughlin M. A., Stairs I. H., 2004, in IAU Symposium, Camilo F., Gaensler B. M., eds., p. 319
- Karuppusamy et al. (2008) Karuppusamy R., Stappers B., van Straten W., 2008, PASP, 120, 191
- Keith et al. (2012) Keith M. J. et al., 2012, MNRAS, 419, 1752
- Keith et al. (2011) Keith M. J. et al., 2011, MNRAS, 414, 1292
- Kerr (2011) Kerr M., 2011, ApJ, 732, 38
- Kerr et al. (2012) Kerr M. et al., 2012, ApJ, 748, L2
- Knight (2006) Knight H. S., 2006, Chinese Journal of Astronomy and Astrophysics Supplement, 6, 41
- Knight et al. (2005) Knight H. S., Bailes M., Manchester R. N., Ord S. M., 2005, ApJ, 625, 951
- Knight et al. (2006) Knight H. S., Bailes M., Manchester R. N., Ord S. M., Jacoby B. A., 2006, ApJ, 640, 941
- Kramer et al. (1998) Kramer M., Xilouris K. M., Lorimer D. R., Doroshenko O., Jessner A., Wielebinski R., Wolszczan A., Camilo F., 1998, ApJ, 501, 270
- Kuiper et al. (2002) Kuiper L., Hermsen W., Verbunt F., Ord S. M., Stairs I. H., Lyne A. G., 2002, ApJ, 577, 917
- Kuiper et al. (2003) Kuiper L., Hermsen W., Walter R., Foschini L., 2003, A&A, 411, L31
- Lange et al. (2001) Lange C., Camilo F., Wex N., Kramer M., Backer D., Lyne A., Doroshenko O., 2001, MNRAS, 326, 274
- Lazaridis et al. (2011) Lazaridis K. et al., 2011, MNRAS, 414, 3134
- Lommen et al. (2000) Lommen A. N., Zepka A., Backer D. C., McLaughlin M., Cordes J. M., Arzoumanian Z., Xilouris K., 2000, ApJ, 545, 1007
- Lorimer & Kramer (2005) Lorimer D. R., Kramer M., 2005, Handbook of Pulsar Astronomy. Cambridge University Press
- Lorimer et al. (1995) Lorimer D. R., Yates J. A., Lyne A. G., Gould D. M., 1995, MNRAS, 273, 411
- Lyne et al. (1998) Lyne A. G. et al., 1998, MNRAS, 295, 743
- Manchester & Han (2004) Manchester R. N., Han J. L., 2004, ApJ, 609, 354
- Maron et al. (2000) Maron O., Kijak J., Kramer M., Wielebinski R., 2000, A&AS, 147, 195
- Navarro et al. (1995) Navarro J., de Bruyn G., Frail D., Kulkarni S. R., Lyne A. G., 1995, ApJ, 455, L55
- Navarro et al. (1997) Navarro J., Manchester R. N., Sandhu J. S., Kulkarni S. R., Bailes M., 1997, ApJ, 486, 1019
- Nolan et al. (2012) Nolan P. L. et al., 2012, ApJ Suppl., 199, 31
- Ord et al. (2004) Ord S. M., van Straten W., Hotan A. W., Bailes M., 2004, MNRAS, 352, 804
- Pellizzoni et al. (2009) Pellizzoni A. et al., 2009, ApJ, 695, L115
- Pletsch et al. (2012) Pletsch H. J. et al., 2012, ApJ, 744, 105
- Press et al. (1992) Press W. H., Teukolsky S. A., Vetterling W. T., Flannery B. P., 1992, Numerical Recipes: The Art of Scientific Computing, 2nd edition. Cambridge University Press, Cambridge
- Radhakrishnan & Srinivasan (1982) Radhakrishnan V., Srinivasan G., 1982, Curr. Sci., 51, 1096
- Rankin (1993) Rankin J. M., 1993, ApJ, 405, 285
- Ransom et al. (2011) Ransom S. M. et al., 2011, ApJ, 727, L16
- Ravi et al. (2010) Ravi V., Manchester R. N., Hobbs G., 2010, ApJ, 716, L85
- Ray et al. (2011) Ray P. S. et al., 2011, ApJ Suppl., 194, 17
- Roberts (2011) Roberts M. S. E., 2011, in American Institute of Physics Conference Series, Vol. 1357, American Institute of Physics Conference Series, Burgay M., D’Amico N., Esposito P., Pellizzoni A., Possenti A., eds., pp. 127–130
- Romani & Johnston (2001) Romani R., Johnston S., 2001, ApJ, 557, L93
- Romani (1990) Romani R. W., 1990, Nature, 347, 741
- Romani & Yadigaroglu (1995) Romani R. W., Yadigaroglu I.-A., 1995, ApJ, 438, 314
- Ruderman (1991) Ruderman M., 1991, ApJ, 366, 261
- Ruderman et al. (1989) Ruderman M., Shaham J., Tavani M., Eichler D., 1989, ApJ, 343, 292
- Shklovskii (1970) Shklovskii I. S., 1970, Sov. Astron., 13, 562
- Smith et al. (2008) Smith D. A. et al., 2008, A&A, 492, 923
- Splaver et al. (2005) Splaver E. M., Nice D. J., Stairs I. H., Lommen A. N., Backer D. C., 2005, ApJ, 620, 405
- Stairs et al. (1999) Stairs I. H., Thorsett S. E., Camilo F., 1999, ApJS, 123, 627
- Stappers et al. (1996) Stappers B. W. et al., 1996, ApJ, 465, L119
- Stappers et al. (1998) Stappers B. W., Bailes M., Manchester R. N., Sandhu J. S., Toscano M., 1998, ApJ, 499, L183
- Sutaria et al. (2003) Sutaria F. K., Ray A., Reisenegger A., Hertling G., Quintana H., Minniti D., 2003, A&A, 406, 245
- Theureau et al. (2005) Theureau G. et al., 2005, A&A, 430, 373
- Thorsett & Stinebring (1990) Thorsett S. E., Stinebring D. R., 1990, ApJ, 361, 644
- Toscano et al. (1998) Toscano M., Bailes M., Manchester R., Sandhu J., 1998, ApJ, 506, 863
- Venter et al. (2009) Venter C., Harding A. K., Guillemot L., 2009, ApJ, 707, 800
- Venter et al. (2011) Venter C., Johnson T. J., Harding A. K., 2011, arXiv:astro-ph/1112.3165
- Venter et al. (2012) Venter C., Johnson T. J., Harding A. K., 2012, ApJ, 744, 34
- Verbiest et al. (2009) Verbiest J. P. W. et al., 2009, MNRAS, 400, 951
- Verbiest et al. (2012) Verbiest J. P. W., Weisberg J. M., Chael A. A., Lee K. J., Lorimer D. R., 2012, ApJ, 755, 39
- Voûte et al. (2002) Voûte J. L. L., Kouwenhoven M. L. A., van Haren P. C., Langerak J. J., Stappers B. W., Driesens D., Ramachandran R., Beijaard T. D., 2002, A&A, 385, 733
- Watters et al. (2009) Watters K. P., Romani R. W., Weltevrede P., Johnston S., 2009, ApJ, 695, 1289
- Weisskopf et al. (2007) Weisskopf M. C., Wu K., Trimble V., O’Dell S. L., Elsner R. F., Zavlin V. E., Kouveliotou C., 2007, ApJ, 657, 1026
- Weltevrede & Johnston (2008) Weltevrede P., Johnston S., 2008, MNRAS, 387, 1755
- Weltevrede et al. (2010) Weltevrede P. et al., 2010, PASA, 27, 64
- Wu et al. (2012) Wu J. H. K., Kong A. K. H., Huang R. H. H., Takata J., Tam P. H. T., Wu E. M. H., Cheng K. S., 2012, ApJ, 748, 141
- Xilouris et al. (1998) Xilouris K. M., Kramer M., Jessner A., von Hoensbroech A., Lorimer D., Wielebinski R., Wolszczan A., Camilo F., 1998, ApJ, 501, 286
- Yan et al. (2011) Yan W. M. et al., 2011, MNRAS, 414, 2087
- You et al. (2007) You X. P. et al., 2007, MNRAS, 378, 493
- Zavlin (2006) Zavlin V. E., 2006, ApJ, 638, 951
- Zavlin (2009) Zavlin V. E., 2009, in Astrophysics and Space Science Library, Vol. 357, Astrophysics and Space Science Library, W. Becker, ed., p. 181
- Zavlin et al. (1996) Zavlin V. E., Pavlov G. G., Shibanov Y. A., 1996, A&A, 315, 141