Selection biases the prevalence and type of epistasis along adaptive trajectories
1 Abstract
The contribution to an organism’s phenotype from one genetic locus may depend upon the status of other loci. Such epistatic interactions among loci are now recognized as fundamental to shaping the process of adaptation in evolving populations. Although little is known about the structure of epistasis in most organisms, recent experiments with bacterial populations have concluded that antagonistic interactions abound and tend to de-accelerate the pace of adaptation over time. Here, we use a broad class of mathematical fitness landscapes to examine how natural selection biases the mutations that substitute during evolution based on their epistatic interactions. We find that, even when beneficial mutations are rare, these biases are strong and change substantially throughout the course of adaptation. In particular, epistasis is less prevalent than the neutral expectation early in adaptation and much more prevalent later, with a concomitant shift from predominantly antagonistic interactions early in adaptation to synergistic and sign epistasis later in adaptation. We observe the same patterns when re-analyzing data from a recent microbial evolution experiment. Since these biases depend on the population size and other parameters, they must be quantified before we can hope to use experimental data to infer an organism’s underlying fitness landscape or to understand the role of epistasis in shaping its adaptation. In particular, we show that when the order of substitutions is not known to an experimentalist, then standard methods of analysis may suggest that epistasis retards adaptation when in fact it accelerates it.
2 Author Summary
A major goal in evolutionary biology is to relate the adaptation of an organism s traits to changes in their genome. When researchers identify substitutions population-wide changes in DNA sequence they often find that the effects of those changes on fitness interact epistatically, or non-linearly. While epistasis is often assumed to be relevant only for very large and diverse populations, here we present computational results that demonstrate that epistasis shapes the pattern of adaptive change in all populations. Our results allow us to make predictions about what kind of epistasis is most likely to occur, with distinct predictions for patterns in the early or later phases of adaptation. We also apply these results to recent evolution experiment with microbes and show that epistasis may appear to slow adaptation, when in fact it may be facilitating evolution by natural selection. Our results will provide a new basis for comparison for all experimentalists who investigate the fitness effects of the molecular changes underlying adaptation.
3 Introduction
Two sites in a genome interact epistatically when the contribution to a trait at one site depends on the state of the other site. While epistasis has been a significant theme in topics such as the evolution of sex and robustness to mutation, its role in the dynamics of evolving populations has only begun to be explored. Recent experimental evolution studies of microbes [1, 2, 3, 4] and biomolecules [5, 6, 7, 8] have revealed that epistasis is widespread and consequential for adaptation. These studies, combined with experiments that reconstruct ancestral genotypes [9, 10, 11, 12, 13, 14, 15] or examine numerous combinations of adaptive mutations [16, 17, 18, 19], have amply demonstrated that molecular evolution cannot be explained or predicted without understanding how gene interactions shape adaptive possibilities.
Evolution experiments are increasingly used to address two questions that are conceptually distinct, but empirically entangled: of the mutations that could play a role in adaptation, how do their interactions shape evolution, and how do evolutionary processes determine what kinds of interactions occur among the sites that substitute? The first question focuses on the properties of the genotype-phenotype-fitness relationship, also called the adaptive landscape, while the second question asks how the mutations chosen by evolution reflect that underlying landscape. If selection and other evolutionary forces are blind to epistasis – that is, if interactions among sites do not influence the likelihood that they will substitute – then this second question is irrelevant, and the genetic changes we see in evolution experiments perfectly mirror the epistatic properties of the underlying adaptive landscapes. If, however, evolution biases the fixation of groups of mutations with specific patterns of interactions, then evolution experiments present a complex problem: if epistasis shapes evolution, and evolution distorts the appearance of epistasis, then how can we use evolution experiments to infer the underlying fitness landscape? This ambiguity complicates even qualitative inferences such as whether epistasis among genes can be said to have slowed or hastened adaptation. To resolve this ambiguity researchers must first understand how evolution biases the combinations of sites that substitute in an adapting population. Only then can researchers hope to correct for these biases, which will depend upon the size, mutation rate, and other characteristics of the population, in order to infer the underlying fitness landscape from experimental data.
Many theoretical studies of epistasis and patterns of asexual adaptation have focused on questions of the existence and accessibility of multiple fitness peaks [20, 21, 22, 23, 24, 25, 26, 27, 28]. While such work has clarified the broad-scale picture of how epistasis shapes adaptation, its usefulness in predicting microevolutionary dynamics is limited. In contrast, our interest here is how experiments on adapting populations can be used to infer the properties of an organism’s underlying fitness landscape and how epistasis shapes those experimental outcomes.
We use a computational model to clarify the evolutionary effects of two contradictory roles of epistasis: epistatic interactions can undermine the benefits of previously adaptive genetic substitutions, but they can also produce new paths to higher fitness [29, 30]. The first of these effects would tend to retard adaptation, and the latter effect would accelerate it. Our results show that natural selection biases the prevalence and type of epistatic interactions among the mutations that substitute, even when mutations are too rare to interact directly as coexisting polymorphisms. Here we work to quantify precisely how selection biases the epistasis among mutations that substitute in an adapting population and to understand why these biases arise.
4 Results
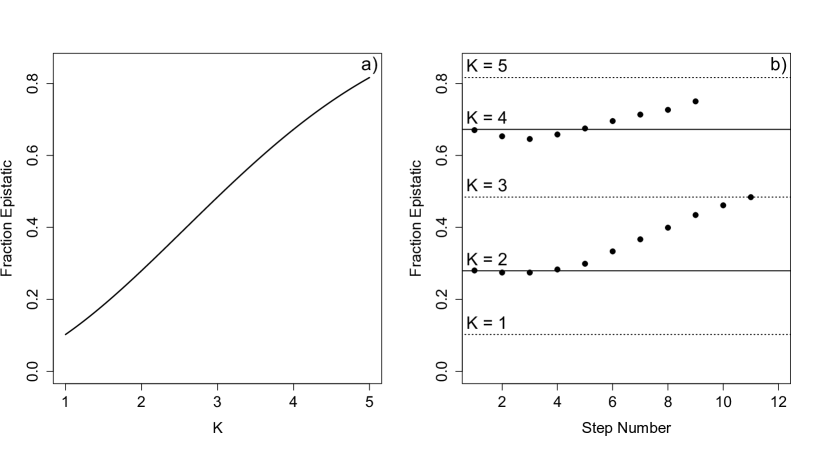
4.1 Prevalence of epistasis along an adaptive walk
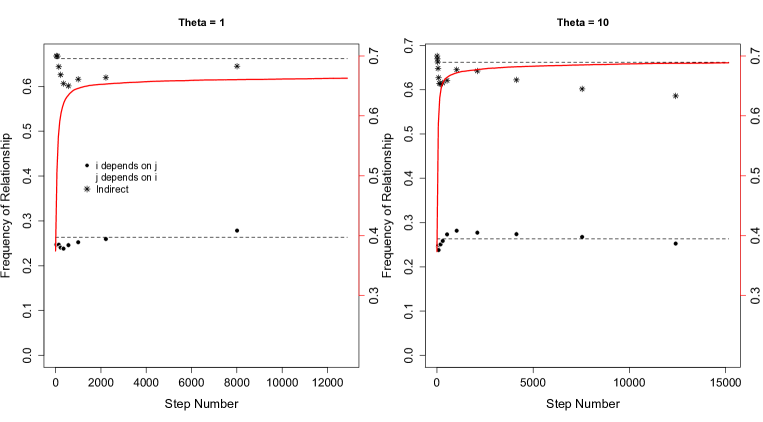
To understand how selection shapes epistasis among the mutations that substitute, we first simulated adaptive walks in which beneficial mutations substitute sequentially. Østman et al. suggest that epistatic interactions should not influence substitution patterns when rare beneficial mutations fix independently [28]. Our results initially appear to confirm this expectation: Figure 1(a) shows that sites that fix sequentially are almost as likely to interact epistatically as are pairs of randomly chosen sites. However, this concordance disappears when epistasis is examined along the sequence of steps comprising an adaptive walk: Fig. 1(b) shows that epistasis is in fact suppressed early in adaptation, and enriched among later steps, compared to a random (neutral) walk. Thus, selection biases the amount of epistasis among the mutations that fix along an adaptive walk, and it does so in a complex manner. These opposing effects produce an apparent agreement with the random expectation for the overall prevalence of epistasis when observations are coarsely averaged across entire walks, but in fact these results demonstrate that epistasis can shape patterns of substitutions even when mutations fix independently, one after another.
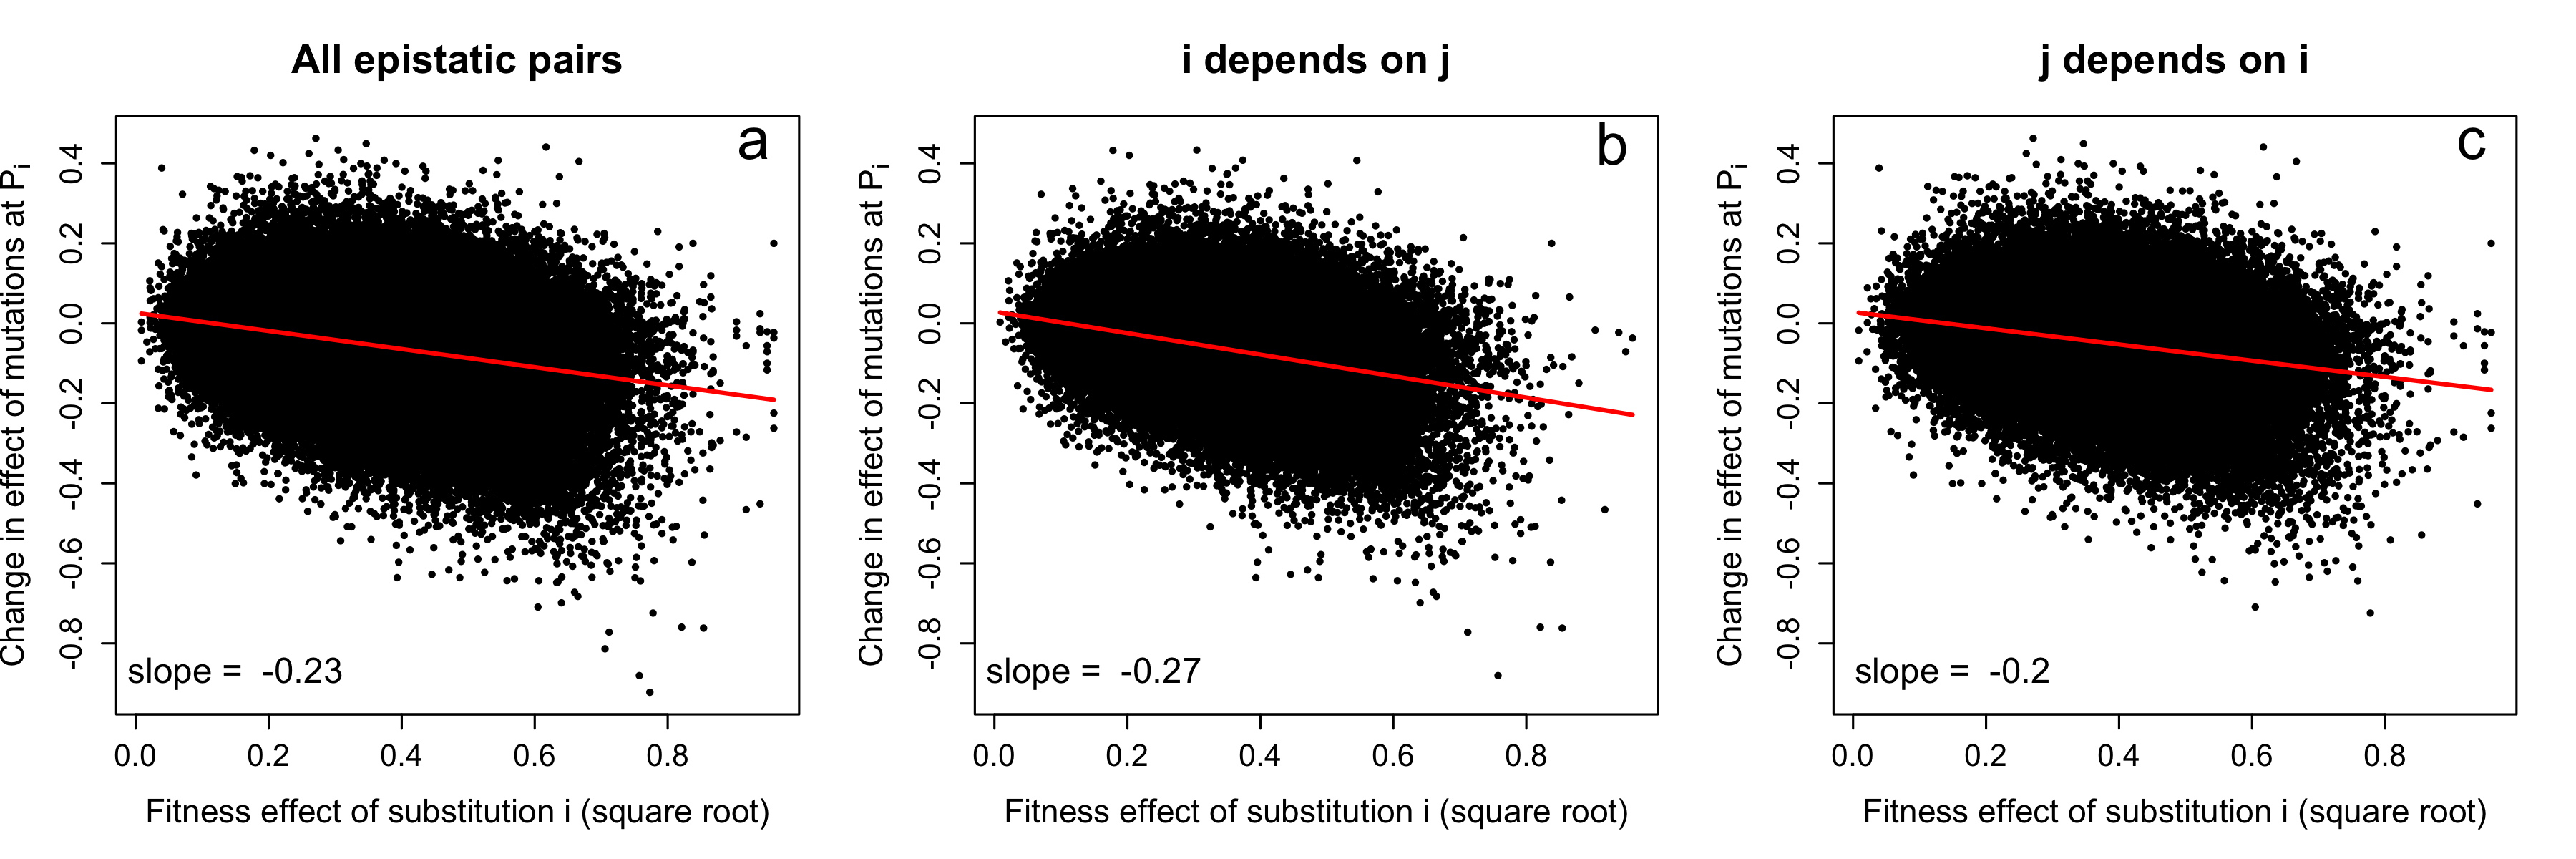
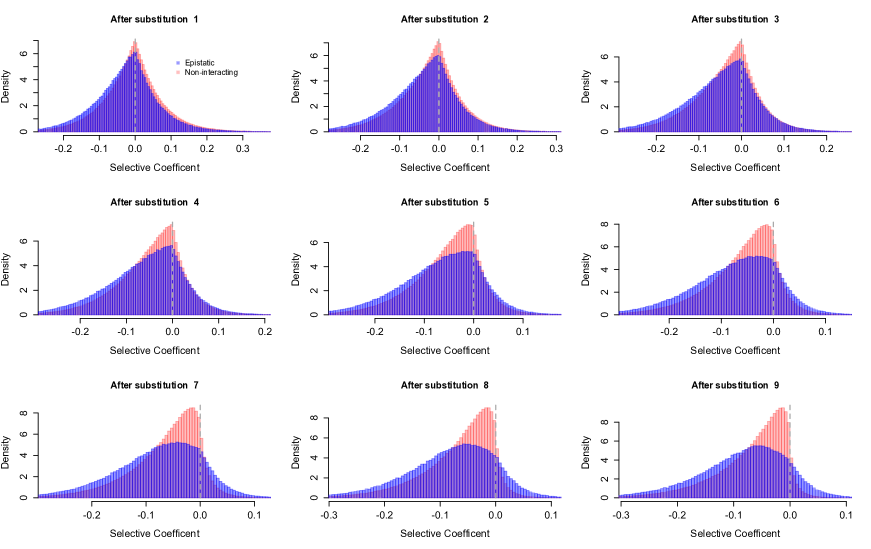
Why does selection suppress epistasis early in walks and promote it later? To address this, we studied how mutations at sites along an adaptive walk influence the fitness effects of the sites with which they interact (upstream or downstream). In particular, in the simple case of , Fig. 2 shows the distribution of fitness effects of mutations at those sites that do and do not interact with the site that has just substituted along a walk. For a site that changes early in the walk, mutations at its interacting sites are less likely to be beneficial. In other words, adaptive substitutions early in the walk partly undermine the benefits that would be conferred by mutations at their partner sites. Therefore, after an early substitution at one site, its epistatic partners are less likely to substitute than they would have otherwise – and so the early steps in an adaptive walks exhibit a deficit of epistasis compared to the neutral expectation.
This bias against epistasis early in a walk is caused by the dependency of selected substitutions on the backgrounds in which they were selectively favored. When a site forms part of the relevant genetic background for a beneficial substitution, it is statistically likely that changes at such a site would partially undermine the beneficial effect of this fixed adaptive substitution. Supplemental Figure 6(a) demonstrates this regression to the mean effect: selective coefficients of mutations at a site are suppressed when interacts with a site that has just fixed an adaptive mutation, and this suppression is greater when the beneficial effect of the substitution at is larger.
4.2 Form of epistasis along an adaptive walk
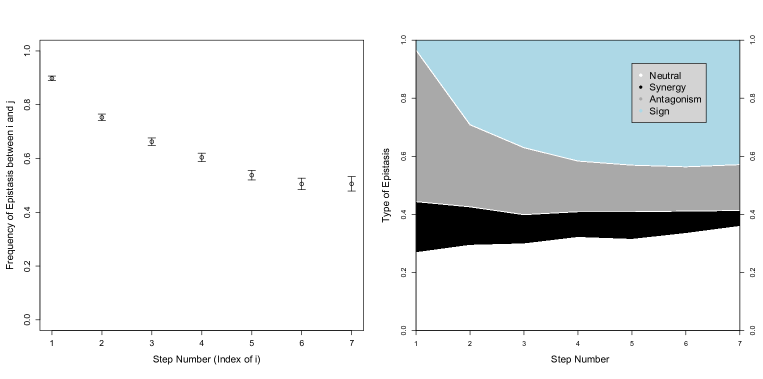
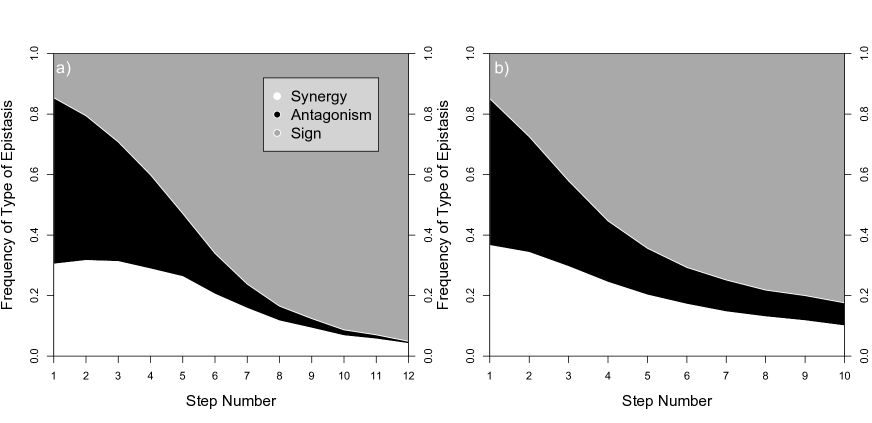
Aside from biasing the amount of epistasis along a walk, selection also biases the type of epistasis between successive substitutions. We find that the predominant sign of epistasis, as well as its prevalence, depends on the position of the substitutions along an adaptive walk. Fig. 3 shows that early substitutions tend to show antagonism with one another, while later substitutions typically exhibit sign epistasis, defined as pairs of mutations where at least one member has a beneficial fitness effect on one background and a deleterious effect on the other. Synergy between beneficial mutations is present but less common than antagonism at early steps and less common than sign epistasis at later steps. The shift from antagonistic towards synergistic/sign epistasis helps to explain why epistasis is suppressed early in an adaptive walk and augmented later in the walk.
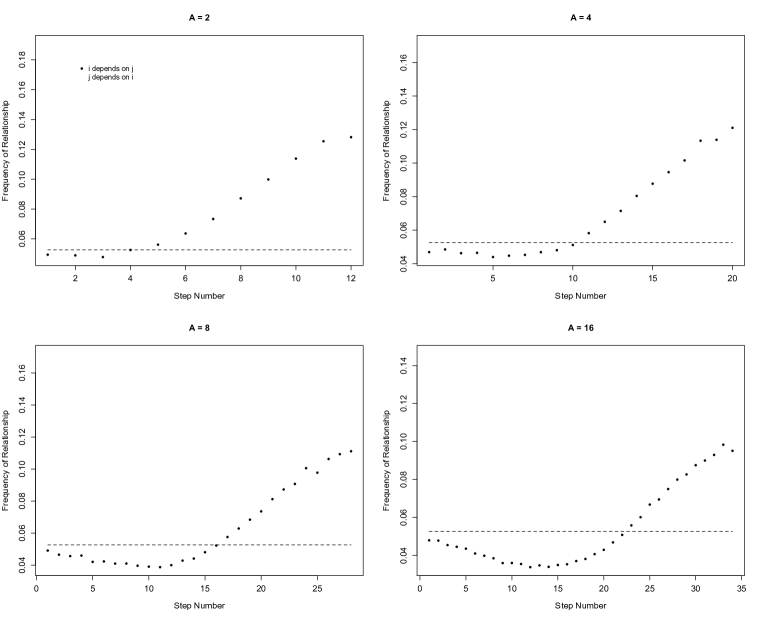
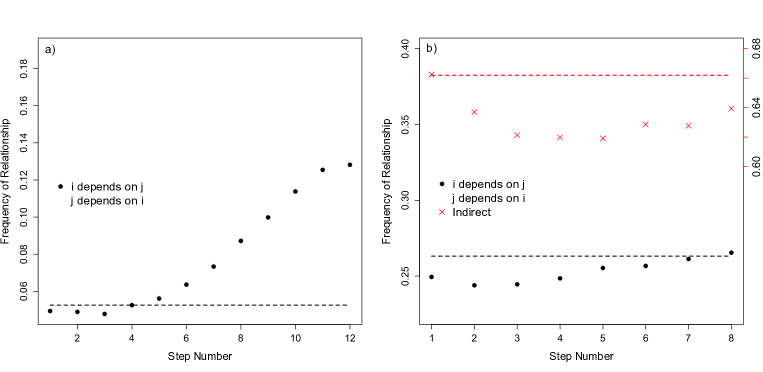
Selection also biases the directionality of interactions between successive substitutions along an adaptive walk (see Methods). Fig. 4a shows that interactions with upstream of are more frequent than the converse along the entire adaptive walk. This difference is explained by disparate effect on the evolvability of site : is more likely to become evolvable (able to substitute beneficially) if it is influenced by the preceding substitution at , than if it influences (see Supplemental Text). This result is confirmed by the regressions in Supplemental Figure 6(b & c), and it explains why such interactions are more prevalent than the converse (Figure 4a). When , another type of interaction is possible: and might not influence each other directly, but both might influence a third site. Epistasis of this type is expected to be very common when is a substantial fraction of , and results for show that the prevalence of this type of interaction also changes along adaptive walks (Fig. 4b). Thus, evolution biases the types and directions of interactions among substitutions along an adaptive walk.
Choosing the sites which influence each of the loci defines a network of directed interactions. While the number of sites that influence a locus (its in-degree) is fixed at , the number of sites that a locus influences (its out-degree) is variable and approximately Poisson distributed. Evolutionary preferences for certain types of epistasis, such as the bias in favor of substitutions at sites that depend on previous substitutions, might then lead to systematic variation in the out-degree of sites which substitute adaptively. Supplemental Figure 7 confirms this hypothesis: the out-degree of substituted sites is initially slightly higher than expected, then declines with substitution number. This evidence implies that those sites with more epistatic connections are less likely to change during adaptation, because mutations at such sites have a greater chance of undermining previously selected beneficial changes.
4.3 Robustness of results and comparison to data
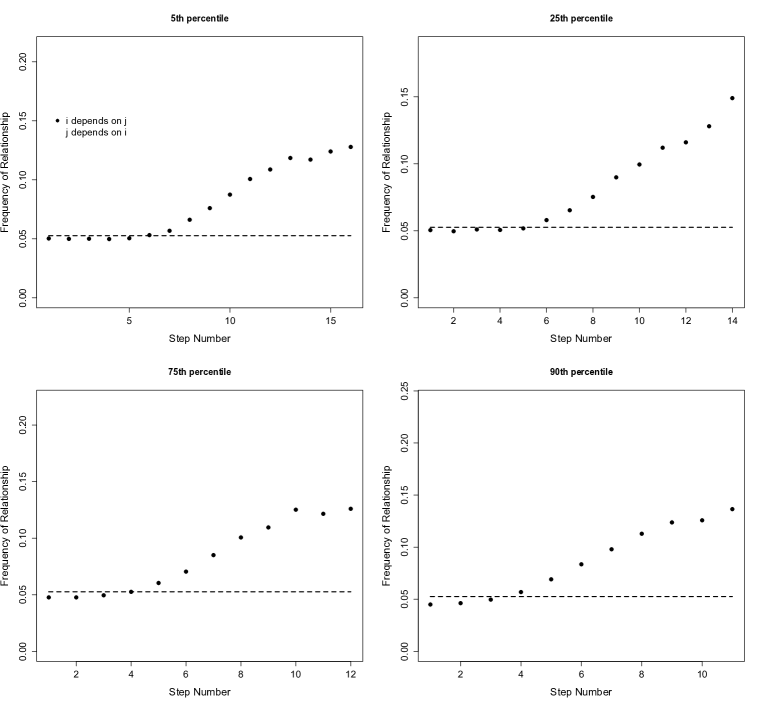
The NK model has several features that could amplify the biases in epistasis introduced by natural selection. In order to assess whether these model assumptions might lead to spurious results, we explored how the patterns shown in Figure 4 change as the number of alleles per site and the starting fitnesses were varied. Supplemental Figure 8 shows that deviations from the expected prevalence of epistasis are qualitatively similar, and quantitatively greater, when the number of alleles per site, , is increased. Supplemental Figure 9 confirms that the basic pattern of our results is also robust to changes in the fitness of the starting genotype.
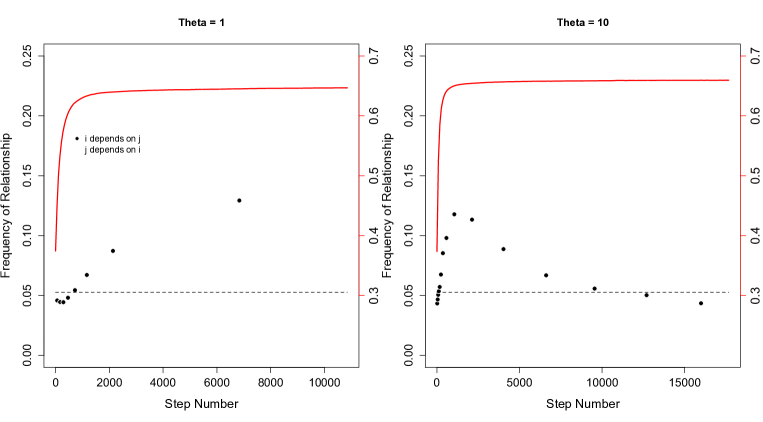
While we have focused on evolutionary dynamics in the simplified, strong-selection-weak-mutation regime, we can use individual-based simulations to explore epistasis in polymorphic populations with larger values of the population-scaled mutation rate, . Supplemental Figures 10 and 11 show very similar patterns for the prevalence of epistasis among adaptive substitutions, even when is much greater than 1. Some differences from Fig. 4 are apparent in the high- case during the period of stabilizing selection that follows adaptation. However, these simulations at high confirm that the major patterns found in adaptive walks at low : there is a deficit of epistasis early in evolution, and a surplus of epistasis later in adaptation, with a predominance of interactions in which the effect of each substitution depends on the preceding substitution along the line of descent.
We also considered a very different set of fitness landscapes – computationally predicted RNA folding – to assess the generality of our principal findings. RNA sequences do not have static epistatic interactions between sites; instead, interactions emerge from the folding topology and change with genotype. However, we can still measure the average frequency of epistasis between substitutions on an evolutionary line of descent; such data show that the prevalence of epistasis does vary systematically along a series of substitutions, although the trend is toward decreased epistasis (Fig. 7(a)). The type of epistasis can also be quantified, although the high frequency of conditionally neutral mutations in RNA necessitates a new category of neutral epistasis. Fig. 7(b) shows that, as in the NK model, early antagonism gives way to a high prevalence of sign (and neutral) epistasis later in adaptation. While these results differ in some features from those obtained in the NK model, they further illustrate that evolution at can indeed bias the epistatic properties of fixed mutations, and it does so differentially at different stages of adaptation.
Finally, we re-examined data from the microbial evolution experiment of Khan et al. [3], in which the actual order of substitutions that occurred is known. As shown in Supplemental Figure 15, we used their fitness measurements to calculate epistasis along the path of adaptive change. Two methods of calculating expected fitness, which differ in their choice of reference genotype, both yield the same qualitative result: epistasis is initially negative, then becomes positive during the later stages of adaptation. While this pattern represents only a single instance of an empirical evolutionary trajectory, its similarity to the patterns expected under our analysis of a broad class of mathematical fitness landscapes (Fig. 3) is striking. This re-analysis suggests that epistasis may in fact be accelerating late adaptation in these experimental populations, in contrast to the original interpretation of the data [3, 33].
4.4 Implications for inferences from experimental data
Two recent studies on experimental populations of bacteria have inferred that antagonistic epistasis among beneficial mutations is common and ultimately explains a trend of diminishing fitness gains over time [2, 3]. These studies relied in part on regression analyses of the fitness effects of observed substitutions in the presence and absence of the other beneficial substitutions observed in the experiment. Both studies found a trend towards smaller beneficial effects when substitutions were assayed in backgrounds of higher fitness and so concluded that antagonistic epistasis decelerates adaptation. However, we demonstrate below that in the NK model, such regressions are not a reliable indicator of the effect of epistasis on the speed or extent of adaptation. Our results suggest that a common statistical artifact – regression to the mean – confounds the interpretations of such regressions and that analyses of the role of epistasis in adaptation may be meaningful only when the actual ordered sequence of substitutions is known.
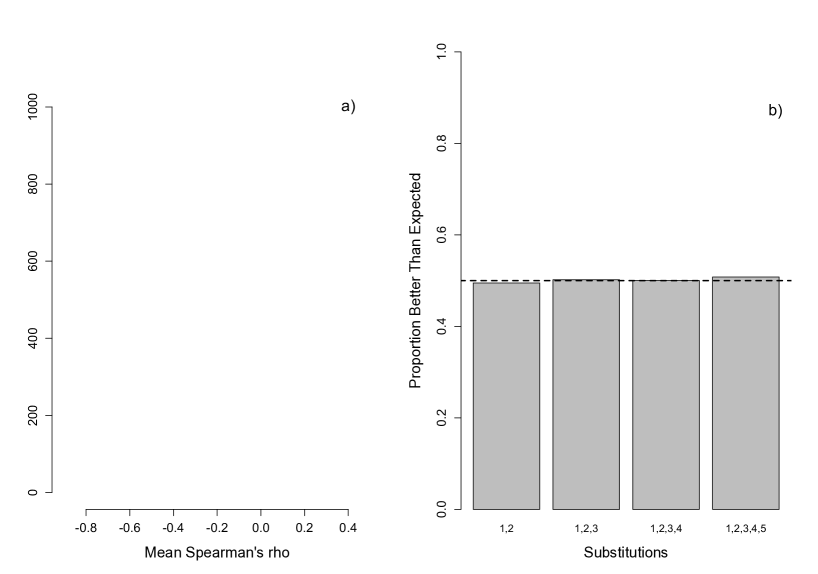
We performed the same kinds of regressions as Chou et al. and Khan et al. [2, 3] on adaptive walks simulated on NK landscapes. Specifically, we computed rank regression coefficients of background fitness versus fitness effect for the first five substitutions in such adaptive walks (see Methods). The distribution of average regression coefficients in Fig. 5(a) shows a bias toward negative values similar to those seen in bacterial experiments [2, 3], suggesting that epistasis becomes more negative with each substitution and decelerates the pace of adaptation. However, this interpretation is contradicted by our results above: Fig. 3 clearly shows that, on average, epistasis becomes more positive with each substitution. Figs. 1,2, and 4 also support this view: epistasis is initially disruptive to the large fitness gains of early adaptive changes, but then facilitates later adaptive steps. And, finally, Fig. 5(b) shows that a genotype along the line of descent is typically more fit than would be predicted from the fitness effects of its component mutations in the ancestor, and that this synergistic effect increases along adaptive walks.
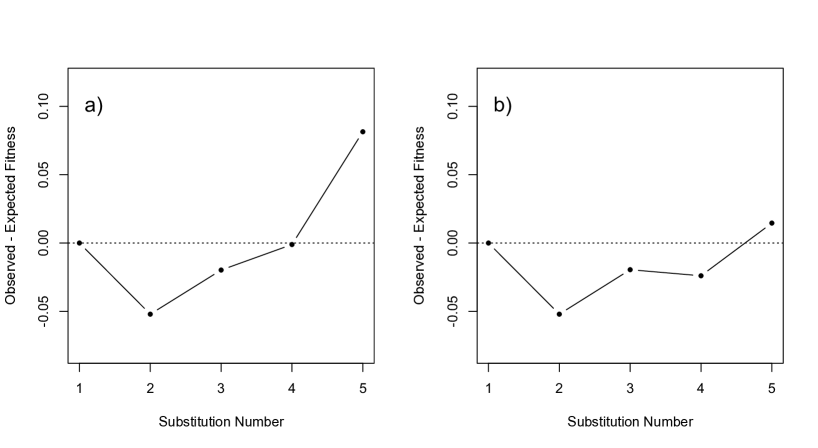
Our results imply that that regression analysis of fitness effects on different genetic backgrounds (e.g. those performed by Khan et al. [3] and Chou et al. [2]) may be misleading. To clarify this issue, we examined the mean regression coefficients for those adaptive walks that were unequivocally accelerated by epistasis – namely, those walks in which the effect of each subsequent mutation was greater than expected under multiplicativity. Even when restricted to these highly synergistic walks, the regression analyses of the type shown in Fig. 5a. are most often negative and so would erroneously suggest increasing antagonism (Supplemental Figure 13). Furthermore, we also performed random (neutral) walks, in which substitutions along the line of descent are equally likely to exceed or fall short of their expected multiplicative fitness, given the fitness effect in the ancestor; even in these walks, regression coefficients of the type studied by Khan et al. [3] and Chou et al. [2] tend be negative (Supplemental Figure 14). These data confirm that regressions of fitness effects against the fitnesses of genetic backgrounds cannot be reliably used to infer whether epistasis has slowed or accelerated epistasis, at least in the NK model.
The tendency of these regressions toward negative slopes may be caused by the well-known confound of ”regression to the mean.” In these regressions, the dependent variable, fitness effect of substitution on a genetic background, is mathematically interrelated with the independent variable, the fitness of that same background. If the fitness of the background genotype is very poor, then the epistatic effects of its alleles are statistically likely to be unusually poor. Any change that perturbs these epistatic effects is likely to improve their fitness contributions. Therefore, a substitution in a very unfit background is likely to show a large beneficial effect simply by perturbing the fitness effects of interacting sites. A similar argument can be made to explain why fitness effects are often small or even deleterious in highly fit backgrounds and, by extension, why negative correlations are a likely consequence of the interdependence between the variables in this regression.
The results in this section highlight the difficulty of interpreting experimental data when the order of substitutions in unknown. The ”regression to the mean” effect we observed may be magnified by the nature of the NK model. Nonetheless, this example shows that the epistatic properties of a selected sequence of substitutions may differ strongly and systematically from the broader pattern of epistasis in the underlying landscape.
5 Discussion
To solve the dual problem of epistasis in evolution experiments – that epistasis both shapes the evolutionary process and can be inferred by manipulating the sites that substitute adaptively – requires theory beyond current knowledge in population genetics. Because the term “epistasis” encompasses all scenarios in which fitness effects of alleles do not combine independently, no general model of epistasis has been proposed, let alone analyzed. Instead, exploration of a few “toy” models has led to appreciation of the subtle and significant ways that epistasis complicates our understanding of evolution.
Here we have used the NK model to contravene the intuitive notion [28] that sites substituting one after another will be selected without regard to their epistatic interactions. To summarize, we have shown that, even when mutations are rare, evolution selects among possible substitutions based upon the number and direction of connections to other loci, and that these selective biases change substantially along the course of adaptation. In the NK landscapes, epistasis is less prevalent then the random expectation early in adaptation and much more prevalent later, with a concomitant shift from predominantly antagonistic interactions early in adaptation to synergistic and sign epistasis later in adaptation. Additionally, sites with more epistatic influences on other loci are more likely to substitute early than late in adaptive evolution. These results suggest that even the most basic evolutionary process acting in the context of a simple fitness landscape can produce a complex expectation for epistasis. Experimentalists must account for this baseline action of natural selection on epistasis among substitutions if they hope to infer the properties of the fitness landscapes underlying experimental or natural evolutionary outcomes.
The basic intuition behind our results is simple. Early on, large-effect mutations tend to act antagonistically, which suppresses the frequency of epistasis among subsequent substitutions. Later on, the only way to achieve further fitness gains is by fortunate sign epistasis, and this effect tends to augment the appearance of epistasis as the population approaches a fitness peak.
We have focused on evolution by sequential fixation of beneficial substitutions in order to demonstrate that this seemingly simple case conceals several layers of complexity. However, our results suggest patterns, such as a decrease in observed epistasis among early substitutions and an increase in epistasis among later ones, that extend to polymorphic populations as well. By focusing on the differences between the distribution of epistasis among all sites, and the specific sequence of substitutions, our approach highlights the potential for misleading inferences from evolution experiments when the order of substitutions is unknown. Specifically, it may be difficult to reliably determine how the sign of epistasis varies with fitness using only the fitnesses of an ancestral, derived, and possible intermediate genotypes. Regression analyses that ignore substitution order might suggest that epistasis is decelerating adaptation ([2, 3], Fig. 5), whereas in fact epistasis has had an accelerating effect on the trajectory of fitnesses along the actual path of adaptation. Indeed, our reanalysis of data from [3] supports this possibility. Such discrepancies illustrate the importance of measuring the order in which substitutions occur, in future experimental studies, in order to understand how epistasis has shaped a population’s trajectory.
While the NK model has the advantages of a tunable level of epistasis and an extensive history of prior work, it certainly does not capture the full range of possibilities of interactions among genes. Our results with larger numbers of alleles in the NK model, with a computational model of RNA folding, and with data from evolving microbial populations, suggest that the patterns we have identified in simple cases may be even more pronounced in models that better approximate biological complexity. However, the most important conclusion from our study is that new methods of data-gathering, such as cheap whole-genome sequencing and high-throughput fitness assays, will not suffice to answer basic questions about the role of genotype-phenotype maps in evolution. Pioneering studies have provided compelling examples of the ubiquity of epistasis, but they also serve to exemplify the substantial gap that separates data from hypotheses in experimental evolution. To definitively link gene interactions to the rate or predictability of adaptation will require a significant expansion of the theory of population genetics, and a vital first step is serious engagement with ”toy” models of interacting loci.
6 Methods
6.1 Mathematical Fitness Landscapes
Invented by Stuart Kauffman to describe evolution on rugged fitness landscapes [31, 32, 20], the NK model produces complex but computationally tractable genotype-fitness maps using only the parameters , , and . The parameter defines the number of sites, each of which can assume any of alleles. The fitness of a genotype is calculated in two steps: first, the fitness contribution of each site is determined by reference to a table of pre-calculated values; second, these fitness contributions are multiplied together and the N-th root of this product is taken as fitness. When is zero, the fitness contribution of a site depends only on its own allele, and not on the state of other sites; the lookup table for each site therefore contains only possible fitness contributions. When , the fitness contribution of a site depends on its own allele as well as the alleles at other sites, yielding a lookup table with entries. By specifying that each of the entries in the lookup tables for all sites are drawn independently from a broad distribution (in our case the uniform distribution), the NK model ensures that the fitness effect of a substitution depends strongly and randomly on some fraction of the genetic background, determined by . is constant across sites and genotypes for a particular landscape, and the sites upon which each locus depend are drawn uniformly from the possibilities.
Gene interactions described by the NK model are directional: the fitness contribution of site may depend on the state of site without implying that the contribution of also depends on . We can therefore categorize relationships between sites: is downstream of if the fitness contribution of depends on , and is conversely upstream of in this example. While this direction of influence is significant for some of our results below, we note a subtle confusion between epistasis as defined in the NK model, and epistasis as defined by an experimentalist. This confusion stems from the fact that an experimentalist measures the fitness effect of a substitution, while the NK model considers fitness contributions of sites. Therefore, the fitness effect of a substitution at site will show epistasis with site not only if is downstream of , but also if it is upstream of . Similarly, the fitness effect of a substitution at will be epistatic with if both and are upstream of some mutual site , even if neither nor directly influence one another. To minimize this potential confusion, we follow the empirical definition and use the term ‘epistasis’ to refer to any case in which the fitness effect of a substitution at a site depends on the state of some other site. This usage makes the common assumption that independent fitness effects are multiplicative.
Aside from NK landscapes, we also explore epistasis and evolutionary dynamics using RNA folding landscapes, as well as experimental bacterial data, described below.
6.2 Evolutionary Simulations
To investigate epistasis among genetic substitutions, we employed two types of simulations: adaptive walks, which model simplified fixation dynamics in essentially monomorphic populations; and individual-based Monte Carlo simulations of potentially diverse populations. In an adaptive walk the population is represented by a single genotype, and a mutation to any of the alternative alleles at any site is a candidate substitution. For simplicity, we assume that the probability of fixation for a mutation is directly proportional to its selective coefficient, where is the fitness of the currently fixed genotype and the fitness of the mutant . Evolution is then a Markov process with transition probabilities defined by
| (1) |
where is the set of all adaptive, one-mutant neighbors of the current genotype [34, 35]. These walks therefore substitute one mutation at a time, strictly increasing in fitness until a local maximum is reached.
We used the Wright-Fisher to describe evolution in polymorphic populations: an asexual population of fixed size reproduces with discrete generations and selection on fertility. Mutations occur at Poisson frequencies according to the per-genome rate . Because our goal is to investigate evolutionary dynamics when is near or greater than 1, we required a method of detecting substitutions that does not depend on independent, well-demarcated fixation events. We therefore trace the line of descent from the final population back to the initial generation and record changes along this lineage. To minimize the false identification of polymorphisms as substitutions, we ran these simulations for generations past the desired ending time-point. We then selected the most fit individual and traced its lineage back to the start, discarding any genetic changes that arose during those last generations.
To compare our results with empirical data, we performed two types of regressions on the fitness effects of the first few substitutions in evolutionary simulations. Following recent experimental examples [2, 3], we examined the first five substitutions in a simulation and measured the fitness effect of each of these substitutions with all combinations of the allele states at the other four sites. The fitness of each of the sixteen genetic backgrounds is taken as the independent variable, and the fitness effect of the focal substitution as the dependent variable; a separate regression was performed for each of the five sites, though the resulting five correlation coefficients are not independent. These analyses were contrasted with a second type of regression, in which the ranks of epistatic deviations of each successive substitution were compared to their order of substitution. If we consider the first five substitutions, then there are four epistatic deviations:
| (2) | |||||
| (3) | |||||
| (4) | |||||
| (5) |
where , for example, represents the fitness of the genotype with the first two substitutions, divided by the fitness of the ancestor. Because these regressions are based on four points, we use this analysis only to classify epistasis along a walk; for example, we highlight the significance of walks in which as examples where epistasis consistently leads to greater than expected fitness.
In both cases, we ignore simulations with little epistasis among the first five substitutions in order to avoid spurious correlations; our filtering removed about 20% of simulations. Because we remove walks without regard to the direction of epistatic effects, this removal should not bias any results.
New landscapes were generated for each replicate simulation. In both types of populations, a simulation began from a randomly drawn genotype with fitness in a certain range, usually close to the 50th percentile (that is, within 0.002 of the desired starting fitness).
6.3 RNA Fitness Landscapes
We also performed Wright-Fisher simulations of evolving RNA populations using the Vienna RNA folding package, version 1.8.5, with default folding parameters. RNA sequences of 72 bases in length constituted the genotypes, and the predicted minimum-free-energy structures determined the phenotypes. Fitness of an RNA genotype was calculated as where denotes the tree edit distance between the RNA’s phenotype and a defined optimal phenotype. Here quantifies the strength of selection and is equivalent to the multiplicative selective coefficient associated with a mutation that changes by a single unit; in the results shown. The tree edit distance algorithm, included in the Vienna package, determines the minimum number of steps from a group of edit operations that are needed to transform one structure into another. The initial genotype was drawn randomly, and the optimum phenotype, used to impose directional selection, was also created by randomly drawing genotypes and discarding those whose minimum free energy structure is the trivial, unfolded state. This optimum was also required to be 40 units from the phenotype of the initial genotype so that the pressure to adapt was strong and uniform across replicates. Simulations were run for 50,000 generations.
Substitutions in RNA simulations were determined by tracing a line of descent, as described above for NK simulations. Because our goal was to study adaptation among beneficial mutations, we filtered the resulting records of substitutions by ignoring adjacent pairs on the line of descent when both members of the pair were neutral or deleterious on the background in which they originally fixed. In practice, less than 1% of pairs were excluded by this rule, so our results are not sensitive to this criterion.
References
- [1] Blount ZD, Borland CZ, Lenski RE (2008) Historical contingency and the evolution of a key innovation in an experimental population of Escherichia coli. Proceedings of the National Academy of Sciences of the United States of America 105:7899–7906.
- [2] Chou HH, Chiu HC, Delaney NF, Segre D, Marx CJ (2011) Diminishing returns epistasis among beneficial mutations decelerates adaptation. Science 332:1190–1192.
- [3] Khan AI, Dinh DM, Schneider D, Lenski RE, Cooper TF (2011) Negative epistasis between beneficial mutations in an evolving bacterial population. Science 332:1193–1196.
- [4] Woods RJ, et al. (2011) Second-order selection for evolvability in a large Escherichia coli population. Science 331:1433–1436.
- [5] Reetz MT, Sanchis J (2008) Constructing and analyzing the fitness landscape of an experimental evolutionary process. Chembiochem 9:2260–2267.
- [6] Bloom JD, Arnold FH (2009) In the light of directed evolution: Pathways of adaptive protein evolution. Proceedings of the National Academy of Sciences of the United States of America 106:9995–10000.
- [7] Hayden EJ, Ferrada E, Wagner A (2011) Cryptic genetic variation promotes rapid evolutionary adaptation in an RNA enzyme. Nature 474:92–U120.
- [8] Salverda MLM, et al. (2011) Initial mutations direct alternative pathways of protein evolution. Plos Genetics 7.
- [9] Weinreich D, Delaney N, DePristo M, Hartl D (2006) Darwinian evolution can follow only very few mutational paths to fitter proteins. Science 312:111–114.
- [10] Bridgham JT, Ortlund EA, Thornton JW (2009) An epistatic ratchet constrains the direction of glucocorticoid receptor evolution. Nature 461:515–U78.
- [11] Lozovsky ER, et al. (2009) Stepwise acquisition of pyrimethamine resistance in the malaria parasite. Proceedings of the National Academy of Sciences of the United States of America 106:12025–12030.
- [12] Bloom JD, Gong LI, Baltimore D (2010) Permissive secondary mutations enable the evolution of influenza oseltamivir resistance. Science 328:1272–1275.
- [13] Lunzer M, Golding GB, Dean AM (2010) Pervasive cryptic epistasis in molecular evolution. Plos Genetics 6.
- [14] Novais A, et al. (2010) Evolutionary trajectories of beta-lactamase ctx-m-1 cluster enzymes: Predicting antibiotic resistance. Plos Pathogens 6.
- [15] Martinez JP, et al. (2011) Fitness ranking of individual mutants drives patterns of epistatic interactions in HIV-1. Plos One 6.
- [16] Remold S, Lenski R (2004) Pervasive joint influence of epistasis and plasticity on mutational effects in Escherichia coli. Nature Genetics 36:423–426.
- [17] Trindade S, et al. (2009) Positive epistasis drives the acquisition of multidrug resistance. Plos Genetics 5.
- [18] Kvitek DJ, Sherlock G (2011) Reciprocal sign epistasis between frequently experimentally evolved adaptive mutations causes a rugged fitness landscape. Plos Genetics 7.
- [19] Rokyta DR, et al. (2011) Epistasis between beneficial mutations and the phenotype-to-fitness map for a ssDNA virus. Plos Genetics 7.
- [20] Kauffman SA (1993) The origins of order: self-organization and selection in evolution (Oxford University Press, New York).
- [21] Whitlock M, Phillips P, Moore F, Tonsor S (1995) Multiple fitness peaks and epistasis. Annual Review of Ecology and Systematics 26:601–629.
- [22] Weinreich DM, Chao L (2005) Rapid evolutionary escape by large populations from local fitness peaks is likely in nature. Evolution 59:1175–82.
- [23] Cowperthwaite MC, Bull JJ, Meyers LA (2006) From bad to good: Fitness reversals and the ascent of deleterious mutations. PLoS Comput Biol 2:e141.
- [24] Weissman DB, Desai MM, Fisher DS, Feldman MW (2009) The rate at which asexual populations cross fitness valleys. Theoretical Population Biology 75:286–300.
- [25] Carneiro M, Hartl DL (2010) Adaptive landscapes and protein evolution. Proceedings of the National Academy of Sciences of the United States of America 107:1747–1751.
- [26] Dawid A, Kiviet DJ, Kogenaru M, de Vos M, Tans SJ (2010) Multiple peaks and reciprocal sign epistasis in an empirically determined genotype-phenotype landscape. Chaos 20.
- [27] Franke J, Kloezer A, de Visser JAGM, Krug J (2011) Evolutionary accessibility of mutational pathways. Plos Computational Biology 7.
- [28] Ostman B, Hintze A, Adami C (2012) Impact of epistasis and pleiotropy on evolutionary adaptation. Proceedings of the Royal Society B-Biological Sciences 279:247–256.
- [29] Draghi JA, Parsons TL, Plotkin JB (2011) Epistasis increases the rate of conditionally neutral substitution in an adapting population. Genetics 187:1139–U255.
- [30] Wagner A (2011) The origins of evolutionary innovations: a theory of transformative change in living systems (Oxford University Press, Oxford).
- [31] Kauffman S, Levin S (1987) Towards a general theory of adaptive walks on rugged landscapes. Journal of Theoretical Biology 128:11–45.
- [32] Kauffman S, Weinberger E (1989) The NK model of rugged fitness landscapes and its application to maturation of the immune response. Journal of Theoretical Biology 141:211–245.
- [33] Kryazhimskiy S, Draghi JA, Plotkin JB (2011) Perspective: In Evolution, the Sum Is Less than Its Parts. Science 332:1160–1161.
- [34] Gillespie J (1984) Molecular evolution of the mutational landscape. Evolution 38:1116–1129.
- [35] Orr H (2002) The population genetics of adaptation: The adaptation of DNA sequences. Evolution 56:1317–1330.
7 Appendix
7.1 Neutral Prevalence of Epistasis in the NK Model
The simplicity of the NK model allows the probabilities of different epistatic relationships between substituting sites to be calculated, assuming that sites are chosen to substitute at random. For distinct loci and , the random (neutral) walk prevalences are given by:
| (6) | |||||
| (7) | |||||
| (8) | |||||
| (9) | |||||
7.2 Estimating Substitution Probabilities for Upstream and Downstream Epistatic Pairs
Our results focus on two main types of epistasis: a site may be upstream or downstream of another site. While both types of influence create an epistatic interaction between the fitness effects of changes at both sites, simulation results reveal a preference for interactions where the first site to substitute, , is upstream of . Here we try to quantify both hypothesized effects of epistasis – the detrimental undermining of fixed beneficial effects, and the positive potential for epistasis to uncover new directions for adaptation – by calculating conditional probabilities in the NK model.
The first goal is to calculate the probability that a site with alleles and is capable of a beneficial substitution after a beneficial change at site from allele to allele , assuming epistasis between and . We consider two ways in which sites and can interact: is upstream of , and so determines the effect of substitution at , or may be downstream of ; we will ignore the case where each site may mutually influence one another. In both cases, we want to solve:
| (10) |
where the notation indicates the fitness effect of allele at site when site has allele , and represents the total fitness contribution of both sites when site has allele and site has allele . Because fitness is a product across sites, we define . While fitness is technically the Nth root of the product across all sites, our results below depend only on the ranks of fitness contributions; we therefore ignore this complication.
These calculations, performed in detail below, demonstrate that the chance for a site to be evolvable – selectively favored to substitute – is diminished if that site’s epistatic partner has beneficially substituted, and that this reduced probability is caused by the fact that such a substitution will disrupt the genetic background that was favorable to the prior substitution. Strikingly, these costs to epistasis seem to be consistent between the two types of epistasis, despite the observed preference for interactions where is upstream of (Figure 3). While these two kinds of epistasis are equally likely to undermine the benefit of previous substitutions, and so have a net deleterious effect, they differ in a more subtle aspect of evolvability. Natural selection should exhaust the set of potentially beneficial changes and so late in adaptation we expect evolvable sites to be rare. To simulate late adaptation, we could assume that – that is, that site was not evolvable prior to change at site . Does this assumption reveal a difference between the two classes of epistasis?
Simple numerics demonstrate that this additional assumption favors substitution at when is downstream of : 35.8% 0.15% of such sites are favorable after substitution at , as opposed to only 14.4% 0.19% when is upstream of . While these probabilities could be derived as above, a more intuitive approach is to consider the effect of each assumption of the fitness effect of a substitution at site , after substitution at site . This effect is related to the ratio:
In either model, our expectation of the value of the denominator is increased by the knowledge that . When is downstream of , this increase is partially mitigated by two factors: , and the remaining term in the numerator, , is an independent draw. However, when is upstream of , then is an independent draw, and is expected to be smaller than an independent draw, since it equals . This asymmetry between the evolutionary acceptability of two directions of epistatic influence is therefore caused by another asymmetry: the high likelihood that sites are unevolvable later in an adaptive process.
7.3 Site is upstream of
When depends on , but is independent of , then we have and . Eq. 10 therefore reduces to:
Because the beneficial substitution occurred on background , and we assume only beneficial substitutions, . We want the distribution of , given that:
All four of these variables are standard random uniform variates, and we assume that they are independent. Let , , , and . We can therefore solve for the convolution , then for the quotient distribution .
We can find the distribution of by constructing the cumulative distribution function:
Then we differentiate to obtain the p.d.f.:
Next, we obtain the convolution of over by a similar construction. Let , and note that ranges from zero to infinity. A simple geometric approach reveals that is piecewise at 1. When , we can define the c.d.f.:
and when :
However, our goal is to find the distribution of given that it is greater than , and since , this latter piece of is not needed.
Focal site will be beneficial if , which we can now calculate as:
7.4 Site is downstream of
If depends on , but is independent of , then and . The condition therefore simplifies to . Let and and assume that these are independent uniform random variates.
Now we let and find the convolution by first deriving a c.d.f.
Now, we want to assess the probability that , a pair of independent random uniform variates, is greater than . Using the result above that , we can write this as a ratio of integrals:
7.5 Supplemental Figures