Signature of outflows in strong Mg ii absorbers in quasar sightlines
Abstract
We report a correlation between velocity offset () of strong Mg ii absorption systems and the bolometric luminosity () of quasars in SDSS-DR7. We find that, shows a power law increase with , with a slope . We find that such a relation of with is expected for outflows driven by scattering of black hole radiation by dust grains, and which are launched from the innermost dust survival radius. Our results indicate that a significant fraction of the strong Mg ii absorbers, in the range of may be associated with the quasars themselves.
keywords:
galaxies : active – quasars : general – quasars : absorption lines1 Introduction
The study of Mg ii absorption line systems in the spectra of quasars (QSOs) has been useful in detecting distant normal field galaxies situated close to the lines of sight of QSOs (Bergeron & Boissé, 1991; Steidel et al., 1994). Conventionally, all such absorbers with velocity relative to the background QSO are believed to be associated to the QSO itself (‘associated systems’) while those at larger velocity offset are believed to be entirely independent of background QSO. This general belief was questioned recently by the puzzling results on the abundance of strong Mg ii absorber having equivalent width () more than 1.0 Å : (i) by Prochter et al. (2006) where they found time excess of strong Mg ii absorber towards the ray burst (GRB) sources relative to QSO sight lines (see also Sudilovsky et al. 2007; Vergani et al. 2009; Tejos et al. 2009), and (ii) by Bergeron et al. (2011), where they found similar excess by a factor of about 2 (3 confidence) towards 45 blazar sight lines.
These counter-intuitive results, have inspired many alternative explanations, such as dust extinction towards QSO sight lines which can lower the apparent incidence rate of absorbers, or gravitational lensing which can increase it toward GRBs/blazars, but none have been found to explain the above discrepancies (Porciani et al., 2007; Ménard et al., 2008; Lawther et al., 2012). However the blazars, as a class, are believed to have relativistic jet pointed close to our line of sight. Bergeron et al. (2011) speculated that such powerful jets in the blazars are capable of sweeping sufficiently large column densities of gas (up to ) and accelerating such clouds to velocities of order , thereby possibly accounting for the excess of Mg ii absorption systems towards blazars in comparison with QSOs. However, such an excess in number of Mg ii absorbers per unit redshift () was not confirmed in the analysis of flat-spectrum radio quasars (FSRQs) by Chand & Gopal-Krishna (2012), though FSRQs also possess powerful jets similar to blazars, which they reconciled with the above hypothesis of relativistically ejected absorbing clouds, by suggesting that perhaps due to larger angle from the line of sight (unlike blazars with smaller angle), these accelerated clouds might not intersect the line-of-sight in the case of FSRQs. Using a larger sample size of 95 GRB (including 12 GRB from Prochter et al. 2006), Cucchiara et al. (2012) did not confirm the original enhancement found in the case of GRB by Prochter et al. (2006), though a signature of mild excess of about 1.5 times was noticed for strong Mg ii absorption systems, albeit with only a low confidence level of 90%.
The firm conclusion for jet based above excess still await the realistic numerical modelling of jet-ambient gas interaction especially for the excess seen towards blazars (about a factor of 2) and CDQs (about 10%) (Joshi et al., 2013) vis-a-vis normal QSOs. However an alternative scenario, which could be more plausible, is the dust or radiation driven outflows (e.g. Scoville & Norman, 1995). For instance, if there is some contribution to of strong Mg ii absorber from these outflows, then one will expect that AGN luminosity should have statistical correlation with the velocity offset of the strong Mg ii absorber relative to the background AGN, which is usually defined by,
| (1) |
where , is the emission redshift of the QSO and is the absorption redshift of the Mg ii system.
In this letter we report a correlation between the of strong Mg ii absorbers and the bolometric luminosity () of QSOs, using the strong Mg ii absorber catalogue by Lawther et al. (2012). We also propose an explanation for this correlation which draws upon radiation driven outflow models. In §2 we describe the sample of strong Mg ii absorbers and our selection criteria. In §3 we present our results and a theoretical model of radiation driven outflows. In §4 we study the fractional number counts of absorbers, and discuss our results in §5.
2 Description of the sample
We consider a sample of 10367 strong Mg ii absorbers with equivalent width Å belonging to 9144 QSOs, from the recent compilation by Lawther et al. (2012) based on 105783 QSOs of SDSS DR7 (Abazajian et al., 2009; Schneider et al., 2010). However, the range of varies with , and the observed wavelength range of the spectrum. Therefore, in order to make the sample unbiased, firstly, we have considered a SDSS spectral range from 4000-9000 Å which is a little narrower (by about 100 Å) than the actual one. We then applied the following four selection filters.
-
1.
We removed 773 broad absorption line (BAL) QSOs from our above sample to avoid any contamination in our analysis by BAL features which has resulted in the removal of corresponding 931 strong Mg ii absorbers.
-
2.
For all the quasars having , the Mg ii emission line will fall above 9000 Å, which is our conservative upper limit on wavelength of SDSS spectrum. As a result, SDSS spectra for such sources will not allow any detection of strong Mg ii doublet falling in the redshift range between 2.21024 up to . Therefore to avoid this observational bias, we excluded all sources having from our sample, which resulted in the removal of 43 QSOs having 52 strong Mg II absorbers.
-
3.
Another filter was applied to avoid the observational bias which might result from the lower wavelength limit, viz 4000 Å, in the SDSS spectra. In our analysis we aim to see any correlation of luminosity with velocity offset up to about 0.4c. However for 4000 Å considered as the conservative starting wavelength of our spectra, will be the minimum redshift, which allows us to detect Mg ii absorber (if any) at least up to a velocity offset of . Therefore, we have removed 1461 sightlines with having 1544 strong Mg ii absorbers in their spectra.
-
4.
After applying the above mentioned redshift cuts, we are left with the systems with . In these intermediate redshift systems, the value can be larger than , which in principle may give rise to a bias of higher with increasing . Hence we also remove all the absorbers with from the remaining sample which amounts to exclusion of 1523 absorbers along 1439 sightlines. One should note that is chosen because if we keep value less or greater than this, then the sample is significantly reduced. Another motivation as will be clear in the coming sections, is that is an upper limit for the radiation (dust) driven outflows.
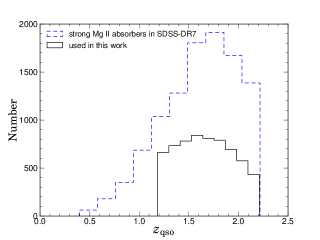
Finally, we are left with 6317 strong Mg ii systems along 5682 QSOs in the selected redshift range. Bolometric luminosities for the QSOs in SDSS DR7 are calculated in a recent study by Shen et al. (2011). We cross matched the QSOs in our sample, with the catalogue described in Shen’s paper to obtain the bolometric luminosity. We then removed two more absorbers whose QSO luminosities were erg s-1. Our final bias free sample consists of 6315 strong Mg ii systems with luminosity range erg s-1, with redshift range , and with the velocity offset range of . In Figure 1, the blue dashed line represents the distribution of strong Mg II absorbers in SDSS-DR7, compiled by Lawther et al. (2012), and the black solid line is the final sample selected for this study.
3 Correlation between and : signature of radiation driven outflow
In order to test the dependence of on luminosity, we divide the sample in bins of bolometric luminosity. Most of the absorbers (5651 out of 6315) belong to QSO sightlines having a luminosity range erg s-1. We divide these 5651 systems into four bins of bolometric luminosity. We also have two more bins, one for erg s-1, and another with erg s-1, the first having 27 systems and the second with 637 systems.
Consider the case of the absorbers being distributed uniformly in the allowed range of (which in turn is determined from the allowed range of ), then the median value of should be independent of (see Appendix A for a proof). Hence, irrespective of the distribution of in a luminosity bin, the median value of beta should be same in all luminosity bins. To test this hypothesis, we estimate the median, the lower 25 percentile and the upper 25 percentile of data in each of the above mentioned six luminosity bins. We plot the median with circles, and the upper and lower percentiles as the end points of vertical dotted bars in Figure 2.
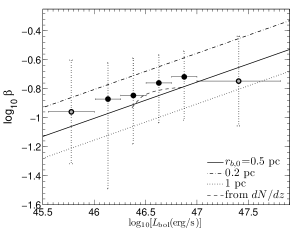
Interestingly, we find that the median is not constant. The data shows a correlation of with the . The 5651 absorbers systems with erg s-1, which form the mainstay of the sample show a power law increase of with , with a slope of . Increase of median value of with the bolometric luminosity, proves that the distribution in each bin is not uniform random. This fact is also hinted in the evolution of with (Zhu & Ménard, 2012). Using the evolution in for our sample, we evaluated the expected relation between the median value of and from equation (7). We then converted it to the corresponding relation between and luminosity by using the best fit relation between and luminosity, a characteristic of magnitude limited survey such as SDSS. We have shown this relation using a dashed curve in Figure 2. Although the dashed curve does show some evolution, but it is clear that it cannot fully explain the observed correlation.
Which physical processes can give rise to non-uniformity of absorber distribution? The evolution in has been attributed to the evolution in global star formation rate (Zhu & Ménard, 2012), although without any concrete evidence. Also, observations of intervening galaxies show a small covering fraction () for strong Mg ii absorbers ( Å) (Nielsen et al., 2012; Chen et al., 2010). Here we explore an alternate based on outflows associated with QSOs, which can give rise to non-uniformity of incidence of absorbers. As we explore in next section, the relation , is a natural consequence of QSO radiation driven outflows.
3.1 Absorbers as radiation driven outflows
Radiation driven outflows have been invoked repeatedly in literature to explain the co-evolution of black hole and bulge, to explain the accretion disc winds (e.g. Proga et al., 2000) and galactic winds (e.g. Murray et al., 2005; Sharma et al., 2011). We consider here the radiation driven outflows, where the photons scatter the dust grains and impart their momentum to dust. The dust in turn is collisionally coupled to the gas, and the momentum is uniformly distributed to the dust and gas mixture. In this scenario, the motion of dust and gas mixture surrounding the QSO is governed by the following equation,
| (2) |
where is the mass of the black bole and is the dark matter halo potential. is the integrated UV luminosity and for QSOs where the main emission is in high frequency bands, luminosity over UV and EUV bands is roughly half of the bolometric luminosity ()(Risaliti & Elvis, 2004). is the frequency averaged opacity for the scattering and absorption of UV photons by dust grains. For wavelength of photon m, the for a dust and gas mixture ranges from 200 to as large as 1000 cm2g-1 (Li & Draine, 2001). We take a value cm2g-1, which roughly serves as an average effective value of opacity. We can integrate equation (2) to obtain the following expression for velocity
| (3) |
where is the launching radius of the outflow. In the case of radiation pressure on dust grains, the opacity is generally quite high and hence the radiation force is many times larger than the gravity, therefore the gravitational force can be neglected. At a large distance the velocity attains the following terminal value
| (4) |
The base radius () for launching these outflows is an important factor and it should be the minimum distance at which the dust grains can survive. Studies on dust survival yield following relation between the sublimation radius of the dust grains and the luminosity of the AGN (Mor & Netzer, 2012),
| (5) |
The value of is pc for graphite grains and pc for the silicate grains. Substituting equation (5) into (4), we obtain the following expression for wind terminal speed,
| (6) |
We note that this mechanism has previously been discussed in the context of AGN outflows by Scoville & Norman (1995). These authors also arrived at similar terminal speed for a radiation driven outflow.
We plot this scaling to compare with the observed correlation of and in Figure 2. The dash-dotted, solid and dotted line in Figure 2 correspond to pc respectively. We find that this simple theoretical model fits the observed correlation pretty well, which indicates that the absorber systems are likely to be radiation(dust) driven outflows.
One is then tempted to ask as to how these outflows fit in the unification schemes of AGN. We find that the launching radius of the outflows is the dust sublimation radius, which is also the inner radius of the dusty torus. Inside the torus, the UV photons are quickly reprocessed into IR. Although the IR photons can also drive outflows (Dorodnitsyn et al., 2011; Sharma & Nath, 2012), however the speeds would not be large, as the IR to dust scattering cross section is more than an order of magnitude smaller than in UV. One possible way to reconcile this is the following.
Let us suppose that the outflows do not plough through the main body of the torus, but consist of material lifted from the outer surface of the torus. In that case, as the torus material is dilute and highly porous at its periphery, the UV photons can in principle travel a large distance without being attenuated and impart their momentum to gas and dust mixture lifted from the outer surface of the torus. More specifically, in the picture presented in Elvis (2000), the region which we are considering should take place between the BAL envelope and the torus. We note that, this scenario not only gives rise to large velocity outflows, but it may also account for the small fraction () of the QSOs which show these absorbers owing to the fact that the region allowed for the outflows (periphery of the torus) occupies a very small fraction of the viewing angle.
4 Fractional number of absorbers
Next we study the dependence of fractional number counts of absorbers as a function of QSO luminosity. We define the fractional number count as below,
Again, we limit our analysis to the spectral region with . From our sample, as described in §2, we can easily estimate the “Number of absorbers found” in a given luminosity bin, having . However to find the corresponding “Number of QSOs searched in a bin”, we also need to count those QSOs in the parent sample of SDSS-DR7 from which the QSOs with Mg ii absorbers are selected. We use the parent catalogue from Shen et al. (2011) of which the sample used in this work is a subset. Therefore, we estimate the “Number of QSOs searched in a bin” by using non-BAL QSOs from Shen et al (2012) catalogue, which satisfy the redshift criteria , to ensure the absence of any observational biases (see §2).
We plot the fractional number count as a function of luminosity () in Figure 3. The values are shown by filled diamonds whose x-coordinate is the centre of each luminosity bin. We also show the overall average of the sample using a horizontal line, whose value is .
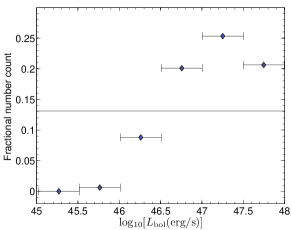
We find that the fraction increases steeply with increasing QSO luminosity and reaches a maximum roughly for erg s-1. For erg s-1 there is a mild decrease with luminosity, however this decrease is uncertain as in this bin, we have many apparently faint high redshift quasars, for which the signal to noise criterion removes large chunks of spectra and the corresponding absorbers (D. Lawther pvt. comm.). We note that the fractional number of absorbers has a contribution from outflowing and intervening systems, which we can not separate here.
5 Discussion
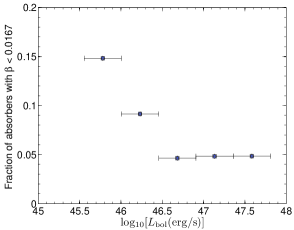
We would like to emphasize an important point in connection with our result. There is a general consensus in the literature, which goes along the line that the absorbers which have ( km s-1), are associated with the QSO and with higher than this represent the intervening media. We stress here that this criterion is not adequate to denote the associated systems, and the true associated systems can also have , e.g. the QSO driven high velocity outflows considered here.
To illustrate this, we plot in Figure 4, the ratio of absorbers with to the total number of absorbers in a particular luminosity bin as a function of bolometric luminosity. One can clearly see that lower are possible for only lower luminosity, and vice versa. Firstly, the figure once again confirms that the velocity offset is correlated with luminosity, because low absorbers appear along the sightlines of low luminosity QSOs. Secondly, this plot, in conjunction with the correlation of with , shows that the systems which are really ‘associated ’ with the QSOs are spread all the way from to .
Our results call for a study to separate out the truly associated (outflowing) systems and the intervening ones. Of course, one tedious way to do this is to locate the intervening galaxies in each quasar sightline, however yet another way can be through the detailed study of line shapes and features arising from outflows and intervening material. We look forward to such a study in the future.
There is another implication of the observed dependence of fractional number count of absorbers on QSO luminosity. If one considers a sample of a particular type of QSOs that covers a restricted luminosity range, then the relative number of absorbers may differ for different samples, and be different from the overall average. If we consider the right side of Figure 3, corresponding to erg/s, there the fractional number counts are roughly double of the overall average value of . We note that recent observations of blazars (Bergeron et al., 2011) report an excess of Mg ii absorbers relative to that in QSOs. We speculate here that this excess may also arise from the fact that the blazar sample is small, and it may be possible that it is biased towards higher luminosity, where the fractional number count is larger. It is possible that if the analysis is repeated with a larger sample of blazars then the excess may fade away. In fact, a similar conclusion has been reached for a sample of FSRQs and lobe and core dominated QSOs where in both cases one finds only a mild excess (Joshi et al., 2013). In this regard we bring a recent paper by Cucchiara et al. (2012) to the attention of the reader, regarding the excess seen towards GRBs, where with a large sample of GRBs the puzzle of Mg ii incidence rate indeed disappears, and one does not find any excess.
In summary, we have found a correlation between the velocity offset of strong Mg ii absorbers and the luminosity of QSOs. The velocity offset () has been found to increase with the luminosity with a power law index . We have found that radiation driven outflows from QSOs can give rise to such a dependence of on . These findings lead us to conclude that a significant fraction of strong Mg ii absorbers (even with ) along QSO sightlines may be the AGN driven outflows.
We are grateful to D. Lawther for supplying the redshift path data. We thank an anonymous referee for insightful comments.
References
- Abazajian et al. (2009) Abazajian K. N. et al., 2009, ApJS, 182, 543
- Bergeron & Boissé (1991) Bergeron J., Boissé P., 1991, A&A, 243, 344
- Bergeron et al. (2011) Bergeron J., Boissé P., Ménard B., 2011, A&A, 525, A51
- Chand & Gopal-Krishna (2012) Chand H., Gopal-Krishna, 2012, ApJ, 754, 38
- Chen et al. (2010) Chen H.-W., Helsby J. E., Gauthier J.-R., Shectman S. A., Thompson I. B., Tinker J. L., 2010, ApJ, 714, 1521
- Cucchiara et al. (2012) Cucchiara A. et al., 2012, arXiv : 1211.6528
- Dorodnitsyn et al. (2011) Dorodnitsyn A., Bisnovatyi-Kogan G. S., Kallman T., 2011, ApJ, 741, 29
- Elvis (2000) Elvis M., 2000, ApJ, 545, 63
- Joshi et al. (2013) Joshi R., Chand H., Gopal-Krishna, 2013, in prep.
- Lawther et al. (2012) Lawther D., Paarup T., Schmidt M., Vestergaard M., Hjorth J., Malesani D., 2012, A&A, 546, A67
- Li & Draine (2001) Li A., Draine B. T., 2001, ApJ, 554, 778
- Ménard et al. (2008) Ménard B., Nestor D., Turnshek D., Quider A., Richards G., Chelouche D., Rao S., 2008, MNRAS, 385, 1053
- Mor & Netzer (2012) Mor R., Netzer H., 2012, MNRAS, 420, 526
- Murray et al. (2005) Murray N., Quataert E., Thompson T. A., 2005, ApJ, 618, 569
- Nielsen et al. (2012) Nielsen N. M., Churchill C. W., Kacprzak G. G., 2012, arXiv : 1211.1380
- Porciani et al. (2007) Porciani C., Viel M., Lilly S. J., 2007, ApJ, 659, 218
- Prochter et al. (2006) Prochter G. E. et al., 2006, ApJ, 648, L93
- Proga et al. (2000) Proga D., Stone J. M., Kallman T. R., 2000, ApJ, 543, 686
- Risaliti & Elvis (2004) Risaliti G., Elvis M., 2004, in Astrophysics and Space Science Library, Vol. 308, Supermassive Black Holes in the Distant Universe, Barger A. J., ed., p. 187
- Schneider et al. (2010) Schneider D. P. et al., 2010, VizieR Online Data Catalog, 7260, 0
- Scoville & Norman (1995) Scoville N., Norman C., 1995, ApJ, 451, 510
- Sharma & Nath (2012) Sharma M., Nath B. B., 2012, arXiv : 1209.0242, ApJ in press
- Sharma et al. (2011) Sharma M., Nath B. B., Shchekinov Y., 2011, ApJ, 736, L27
- Shen et al. (2011) Shen Y. et al., 2011, ApJS, 194, 45
- Steidel et al. (1994) Steidel C. C., Dickinson M., Persson S. E., 1994, ApJ, 437, L75
- Sudilovsky et al. (2007) Sudilovsky V., Savaglio S., Vreeswijk P., Ledoux C., Smette A., Greiner J., 2007, ApJ, 669, 741
- Tejos et al. (2009) Tejos N., Lopez S., Prochaska J. X., Bloom J. S., Chen H.-W., Dessauges-Zavadsky M., Maureira M. J., 2009, ApJ, 706, 1309
- Vergani et al. (2009) Vergani S. D., Petitjean P., Ledoux C., Vreeswijk P., Smette A., Meurs E. J. A., 2009, A&A, 503, 771
- Zhu & Ménard (2012) Zhu G., Ménard B., 2012, arXiv : 1211.6215
Appendix A The median value of
From equation (1), we know that mainly depends on the difference of and . Here we address the question whether or not the median value of which we have computed over its fixed range varying from , depends on the value of . For maximum value of , the lower limit of , using equation (1) is given by where is a constant whose value is 0.65 for . The median value of absorber redshift () is the solution of following equation,
| (7) |
where is the number of Mg ii absorbers per unit redshift. If the absorbers are distributed uniformly and the quantity is constant, then from equation (7) we get, Using equation (1) we find the corresponding median value of , which is independent of . However, the observed evolves with luminosity (and ), which indicates that absorbers are not distributed uniformly.