Effects of H2 coating of grains on depletion of molecular species
Abstract
Physical conditions in dense and cold regions of interstellar clouds favour the formation of ice mantles on the surfaces of interstellar grains. It is predicted that most of the gaseous species heavier than H2 or He will adsorb onto the grains and will disappear from the gas-phase, changing its chemistry, within years. Nonetheless, many molecules in molecular clouds are not completely depleted in timescales of 105 yr. Several speculative mechanisms have been proposed to explain why molecules stay in the gas phase, but up to now none are fully convincing. At the same time, these mechanisms are not mutually exclusive and we can still explore the effects of other possible processes. We speculate on the consequences of H2 coating of grains on the evaporation rates of adsorbed species. More experiments and simulations are needed to calculate the evaporation rate (X-H2).
keywords:
astrochemistry — ISM: abundances — ISM: molecules — molecular processes1 Introduction
Icy mantles on dust grains have been long detected in cold and dense regions of the interstellar medium (Williams et al., 1992). These mantles are the result of the accumulation of heavy molecules on grain surfaces due to the low temperature and high density conditions of the environment. The collisions between the dust grains and the neutral component of the gas lead to the retention of the gas phase particles on the grain surface, because their thermal energy is lower than the typical adsorption energies and because the excess kinetic energy can be transferred rapidly to the surface (Herbst & Millar, 1991). Calculations have shown (Leitch-Devlin & Williams, 1985) that –100% of the collisions result in retention, depending on the species and the nature of the surface. Moreover, the widespread detection of molecular mantles in dense regions of molecular clouds indicates a high efficiency of the sticking of heavy atoms and molecules on the surfaces of cold dust grains.
The main observed component of the mantles is water ice (Tielens & Hagen, 1982; Whittet et al., 1998), but it is thought that most of the gaseous species heavier than H2 or He will adsorb onto the grains and will disappear from the gas-phase, changing its chemistry, in a relatively short “freeze-out” time. The freeze-out rate is years (Leitch-Devlin & Williams, 1985), where is the total hydrogen nucleon number density. For densities as low as cm-3, the freeze-out timescale is much less than the expected lifetime of a typical molecular cloud ( yr), so it would be expected that, contrary to the observational result, the majority of observations would not show evidence for heavy gas-phase species. Iglesias (1977) showed that for non-zero sticking efficiency, when no desorption processes act to remove mantle material, the accretion of gas-phase species on to the dust dominates the chemical evolution and the total freeze-out of gas is inevitable.
Thus, some mechanism is preventing the growth of mantles in grains and maintains an equilibrium between molecules in the gas and solid phases by producing the desorption of molecular species from the surface of dust grains. The finding of a convincing desorption mechanism that explains the observed molecular gas-phase abundances has proved to be rather elusive in the last 20 years. It is not yet precisely known how this desorption takes place and several different continuous desorption processes have been proposed, either working simultaneously or separately (Roberts et al., 2007):
-
-
Classical thermal evaporation (Leger et al., 1985), which is negligible at the temperatures of dense clouds, K
- -
- -
- -
- -
-
-
if the cloud is composed of clumpy molecular gas layers, interstellar UV radiation can penetrate two or three times deeper than in the case of a homogeneous cloud and can produce orders of magnitude more photo-ionisation and photo-desorption even at modest extinctions, (Boissé, 1990; Bethell et al., 2007).
The feedback from the star formation processes, which eventually disrupt the dense cores from which stars form, will also limit the growth of ice mantles or force the return of the adsorbed species to the gas phase, in a sporadic or intermittent manner, through a variety of mechanisms: by sublimation of icy mantles from warm grains near bright stars in a more or less gradual way (Viti & Williams, 1999; Schöier et al., 2002; Rodgers & Charnley, 2003; Garrod et al., 2008), by destruction or sputtering of grain cores and mantles by passing shocks (Charnley et al., 1988; Flower & Pineau des Forets, 1994; Bergin et al., 1998; van Dishoeck & Blake, 1998), or by ice sublimation due to UV radiation originating in shocks (Viti et al., 2003; Christie et al., 2011).
All the mechanisms above are not mutually exclusive, but no proposed non-thermal mechanism convincingly explains the presence of molecules such as CO in dark clouds or it is widely accepted as a reliable desorption mechanism (e.g., Frerking et al., 1982; Duvert et al., 1986; Dickman & Herbst, 1990). In this paper, we propose to explore another possible mechanism: the consequences of the variation of the adsorption energies due to the different properties of the substrate and, in particular, the effect that the coating of dust grains by molecular hydrogen has on the evaporation rates of adsorbed molecules.
2 Effects of H2 coating of grains on adsorption energies
Once a molecular species sticks to a grain, the time it stays on the surface before it evaporates depends on the surface temperature and the binding (adsorbing) energy of the adsorbate species on a given substrate. The desorption rate, in s-1, is described by Hasegawa et al. (1992)
| (1) |
where is the surface temperature of the grain, the adsorption energy in K, and is the characteristic vibrating frequency for the adsorbed species, , where is the surface density of sites ( cm-2) and is the mass of the adsorbing particle. Typically – s-1. The adsorption energies, , of molecules onto the grains depends on the properties of the substrate. Table 1 shows the adsorption energy, in K, of several fundamental species on different substrates that can be found in molecular clouds. Table 1 also shows the evaporation time expected for each adsorption energy for two relatively close grain surface temperatures, and 15 K. It is easily visible the large differences between the different molecular species and substrates and the influence of temperature.
| Species | H | H2 | H2 | He | O | CO | CO | CO |
|---|---|---|---|---|---|---|---|---|
| Surface | H2O ice | H2O ice | H2 ice | Silicate | H2O ice | graphite | H2 O ice | CO ice |
| (K) | 350a | 450a,b | 100c | 100a | 800a | 1208d | 1740c | 960d |
| K | ||||||||
| 530 s | 0.46 yr | s | s | yr | yr | yr | yr | |
| K | ||||||||
| s | 4.5 s | s | s | yr | yr | yr | yr | |
| On H2 coated grains | ||||||||
| Species | CN | NH3 | He | O | N2 | CO | CO2 | |
| Surface | H2 ice | H2 ice | Silicate | H2 ice | H2 ice | H2 ice | H2 ice | |
| e (K) | 302 | 615 | 100 | 160 | 340 | 348 | 572 | |
| K | ||||||||
| 24 s | yr | s | s | 18 min | 40 min | yr | ||
-
a
from Tielens & Allamandola (1987).
- b
-
c
from Sandford & Allamandola (1993a).
-
d
from Allen & Robinson (1977).
-
e
Values estimated using a scaling factor of 1/5 of the adopted standard value of the adsorption energy, (Allen & Robinson, 1977). The original standard values of were: CN on graphite, 1510 K (Allen & Robinson, 1977); NH3 on NH3 ice, 3075 K (Sandford & Allamandola, 1993a); O on H2O ice, 800 K (Tielens & Allamandola, 1987); N2 on H2O ice, 1700 K (Tielens & Allamandola, 1987); CO on H2O ice, 1740 K (Sandford & Allamandola, 1993a); and CO2 on H2O ice, 2860 K (Sandford & Allamandola, 1993a).
When modelling the accretion of gas-phase molecular species onto the grain surfaces, many adsorption energies are needed to describe the complex interacting system thus created (Cuppen & Herbst, 2007). Ideally, we would need to know the adsorption energies of the species onto the carbonaceous substrate, but also the energies between the species and ice (or different ice structures) and with other adsorbed species. Unfortunately, many of these energies are poorly known, if at all (see Cuppen & Herbst, 2007, and references therein). The lower half of Table 1 also shows some estimates of the adsorption energies of several molecular species when the substrate is H2. Most of these values were calculated assuming, for demonstration purposes and following Allen & Robinson (1977), a scaling value of 1/5 of the adopted standard value of . The adsorption energies for H2 surfaces are considerably reduced when compared with the ones for silicate or H2O ice surfaces. For instance, the adsorption energy for H2 on H2O ice, K, while on H2 ice, K. The adsorption energies of other accreting heavy molecules behave in a similar way. Once ’s are reduced to 1/5 of the silicate surface values, evaporation timescales would be shorter than freezing timescales, minutes for CO on H2 at 10 K (see Table 1).
2.1 Coating of grains by H2
By definition, H2 is the most abundant gas-phase species in molecular clouds and several authors have long suspected that it could be an important component of the grain surfaces (Tielens & Hagen, 1982; Govers et al., 1980). At the same time, the adsorption energies of H2 indicate that it is a rather volatile molecule. Table 1 shows that the evaporation time for H2 on H2O ice can go from a few seconds at a grain surface temperature of 15 K to 0.5 years for 10 K.
The surface coverage of H2 molecules will depend on the balance between their evaporation and accretion rates. The number of accreting H2 molecules per unit of time can be calculated from Tielens & Hagen (1982)
| (2) |
where is the abundance of gas-phase H2 molecules, is the mean velocity of H2 molecules ( cm s-1, where is the gas kinetic temperature), is the grain geometrical cross-section ( cm-2), and is the sticking coefficient, which we will assume equal to 1. In practical terms, for a dense gas density, cm-3, a H2 molecule should hit a grain every 10 s.
The number of H2 molecules that evaporate from the surface of a grain per unit of time can be expressed as
| (3) |
where (H2) is the number of H2 molecules on the grain surface.
If the number of grain sites, , the accretion time is s or yr. For a dust temperature of 10 K, and K, the evaporation time is s or yr. The time needed for the system to reach steady state can be calculated as
| (4) |
and the number of H2 molecules on the grain surface will be
| (5) |
For a number of grain sites, = 1–3, and (H2) cm-3, all the exposed sites will be occupied by H2 molecules in yr at cm-3 (Tielens & Hagen, 1982). The evaporation of H2 from an H2 ice surface is very fast, leaving no possibility of multiple layers of H2 ice.
Given the possibility that grains in molecular clouds are covered by a layer of H2 molecules and, as Table 1 shows, this can greatly reduce the adsorption energies of heavy molecules, it is relevant to explore how much do the changes in the adsorption energies used in the chemical models change the values of molecular depletion in the gas.
3 Results of the chemical modelling
We used our gas-grain chemical model based on the gas-grain chemistry of Hasegawa et al. (1992) to explore the evolution of gas- and solid-phase abundances of species after assuming that the grains are coated with H2 molecules. The chemical model contained 3768 gas and surface reactions involving 503 species, but we only took into account adsorption and evaporation of species from the grain surfaces, with no other chemical reaction on them apart from the formation of H2. We ran several models at different gas densities (, , and cm-3, at a gas and dust temperature of 10 K, and cosmic ray ionisation rate s-1. All models used initial elemental ‘low metal’ atomic abundances (Ruffle & Herbst, 2000).
We assumed a crude approach to simulate the effects of the coating of grains by H2 molecules and the subsequent modification of the adsorption energies, . We ran three different sets of models: a fiducial one with no modification of , and two models where all , except for H, H2 and He, were reduced by either a factor of 1/2 or 1/3, a conservative value still far away from the scaling factor used by Allen & Robinson (1977) to estimate the change in the adsorption energy of molecules landing on H2-coated grains. Figure 1 shows the results for two different number densities, and cm-3, and three different sets of adsorption energies: standard values, 1/2 of the standard values, and 1/3 of the standard values.
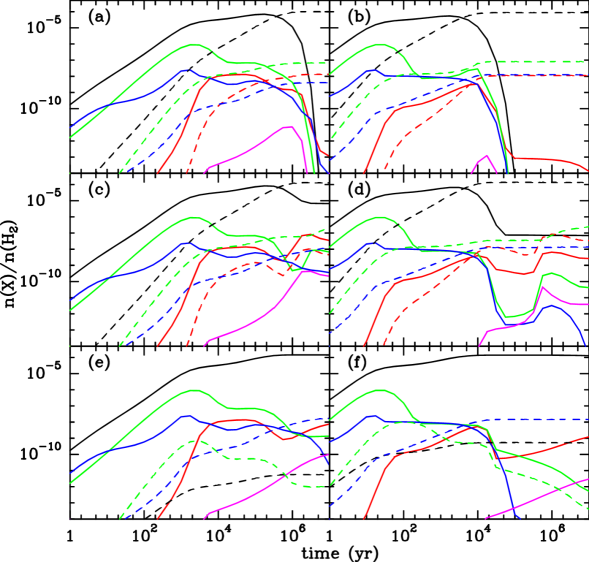
The upper row of Fig. 1 shows the results of the fiducial case. For a gas density of cm-3, the gas-phase molecular abundances begin to suffer from depletion at a few times yr, at which point the gas and grain-phase abundances are approximately similar, and most of the molecular species disappear from the gas-phase at a few times yr. This effect is accelerated by about a factor of 10 for a higher density, cm-3.
The middle row of Fig. 1 shows the results of the case where the adsorption energies are half of the standard values. There is still some degree of depletion (larger than 90%) for some molecules, at a density of cm-3, but total depletion is never reached. Some molecules, such as NH3, do not have so high a depletion and the gas-phase abundance remains higher than the solid-phase abundance at all times. The level of depletion is much larger for higher densities, but even in this case there is not an almost total disappearance of the gas-phase molecules as in the standard case. On the other hand, the times when the solid-state abundances become larger than the gas-phase abundances do not seem to change that much.
The case where the molecular adsorption energies have been reduced by a factor of 3 (bottom row of Fig. 1) shows the more dramatic changes. Many molecules, such as CO, CS (prime candidates for depletion) or NH3, show little or insignificant depletion, even at high densities, measured as the fraction of molecules in the gas and solid phases. This is not the case for CN, which still shows high depletion in this case. One must be cautious in this case, though, because the presence of CO in the gas at all times clearly affects the abundance of many molecules, such as CN and N2H+.
4 Discussion and Conclusions
We have shown how the modelling of the depletion of heavy molecular species in dense and cold regions of molecular clouds depends on the determination of accurate adsorption energies, . Different values of affect the time molecular species reside on the grain surfaces and can provide a way to help explain the non-complete freeze-out of molecules from the gas phase. In particular, we argue that the adsorption energies of molecules on a substrate of H2 ice can be several times lower than the ones commonly used in current chemical models. We also showed that H2 could occupy all the available grain sites in a relatively short time, yr, which could produce a change in the adsorption rates of molecules on grain surfaces.
We ran a few simple gas-grain models to test how much relatively small changes in the adsorption energies of molecular species affect the gas-phase abundances. We find that if we use values of half of the standard values, the depletion of most of the molecules is greatly reduced, although it is still at levels of a factor of 10. A further reduction of the molecular adsorption energies, down to a factor of , which would be a conservative value of how much the adsorption energies can be changed, shows that molecules show very little or no depletion even at relatively high densities, cm-3. Thus, lower evaporation energies of heavy molecular species due to the coating of grains by H2 molecules may explain the presence of CO and other heavy molecules in the gas in average dark clouds.
As we indicated in Sect. 2.1, we do not expect to have more than one monolayer of H2 molecules due to the almost instantaneous evaporation of any H2 landing on H2-ice (see Table 1). On the other hand, we estimate that a CO molecule landing on a grain completely covered by H2 will be able to scan the sites on the surface of the grain in a time, s, much shorter than the expected evaporation time, (CO) min. If the grain surface is only partially covered by H2-ice, the effect will be that any CO molecule landing on H2-ice will be able to find a free site outside of the H2-ice, at which point it will remain trapped on the surface. This will reduce the number of available sites to be covered by H2 molecules by about 500 in a year, as we expect about one CO molecule landing on the surface per day at a gas density of cm-3, and should not have any effect on the basic mechanism we discussed.
In the calculations shown in Sect. 2.1, we assumed a “flat” or homogeneous grain surface, represented by just one value of the absorption energy, , seen by the H2 molecules. But grain surfaces are thought to be rough, with an inhomogeneous structure of valleys, protrusions, cavities, and with and a certain degree of porosity. Landing H2 molecules will be then subject to a variety of binding energies. Results of the effects of surface roughness on the formation rate of H2 on grains (Cuppen & Herbst, 2005, 2007; Cuppen et al., 2006) show that irregularities affect the binding energies of the surface molecules, effectively increasing the binding energy “seen” by each molecule. We expect that H2 molecules will tend to fill the valleys of the surface and, probably, help to build, locally, more than one layer of H2 ice.
We realise that there are several objections that could be raised against this approach. There were some experimental results that show that the surface coverage of H2 might be % for a binding energy of 450 K (Govers et al., 1980; Schutte et al., 1976). Additionally, in the simulations of Cuppen & Herbst (2007), H2 molecules pile up with CO in it. The potential dislocation of (almost completely) coating H2 by an incident H2 or heavier molecule can act against this proposed mechanism for desorption of heavy molecules from grains in dark clouds. Tielens & Hagen (1982) also indicated that the H2 molecular layer may not be rigid enough to prevent oncoming heavier molecules to bind themselves to the surface underneath the H2 layer.
Nonetheless, even if the H2 layer does not completely cover the grain surface and cannot completely avoid that landing heavy molecular species bind with the surface below it, there is no doubt that H2 molecules must be located all over the grain surfaces, due to the ubiquity of H2 in molecular clouds. This should have some, maybe substantial, effect on the effective adsorption energy value of molecular species that in the right environment makes this mechanism relevant. Particularly, after proving that some relatively small changes can affect a lot the depletion rate of heavy molecules.
At the same time, the present mechanism and the several previously proposed desorption mechanisms could very well work simultaneously. It is yet to be seen which process dominates in a certain environment, how effective the H2 coating can be or in which kind of environments it would be dominant.
The presence of a monolayer of H2-ice on the surfaces of grains in molecular clouds could be observationally tested. Unfortunately, there is no clear evidence yet of the detection of solid H2 on interstellar grains. Sandford & Allamandola (1993b) showed that solid H2 could be detected by an infrared absorption band at 2.417 m (4137 cm-1) attributed to the (1) pure vibrational transition of H2. This band has never been detected and Sandford & Allamandola (1993b) argue that it would probably trace the H2 trapped in water ices. Schaefer (2007) proposed six pure -hydrogen pair transition bands as candidates to explain unidentified emission features in ISO-SWS spectra of the NGC 7023 nebula. If any H2-ice absorption band was detected, it would be a combination of existing surface and mantle solid H2. Infrared spectroscopy studies of dust have found visual extinction thresholds of for H2O ice (Whittet et al., 1988), for CO ice (Whittet et al., 1989), and for CO2 ice (Whittet et al., 2007), which roughly correspond to very few monolayers of ice, probably between 2 and 5 (Hassel et al., 2010). The detection of only one monolayer of H2 ice, in the absence of any solid H2 in the mantle, may not be yet feasible.
Finally, it is interesting to consider if the H2-coating mechanism proposed here can have any influence on the determination of the visual extinction thresholds discussed above. As Table 1 shows, the evaporation time of H2 on H2-ice is highly sensitive on temperature, s at 15 K. Thus, at the expected temperatures of the grains at those visual extinctions thresholds (between 12 and 20 K, Draine & Lee, 1984; Smith et al., 1993), H2 molecules do not have time to build up on the grain surfaces and we do not expect them to play any relevant role. Only when the grain temperatures go down to about 10 K will this mechanism delay the growth of ices
Our simple modelling of the chemistry, changing the values of the adsorption energies, also proves how important is to obtain reliable estimates of evaporation energies, either laboratory measurements or theoretical calculations, for heavy molecules on H2 ice or, for that matter, in different kinds of substrate. A simplified experiment could be the study of H2 adsorption on various types of pure ice (H2O, NH3, SO, SO2, H2CO, …) to estimate the interaction potential between the H2 molecules and other heavier molecules.
5 acknowledgements
O.M. is supported by the NSC (Taiwan) ALMA-T grant to the Institute of Astronomy & Astrophysics, Academia Sinica. T.I.H. acknowledges the supports from NSC(Taiwan) 96-2112-M-001-018-MY3 and NSC 101-2911-I-001-503 (France-Taiwan, ORCHID)
References
- Allen & Robinson (1977) Allen M., Robinson G. W., 1977, ApJ, 212, 396
- Bergin et al. (1998) Bergin E. A., Neufeld D. A., Melnick G. J., 1998, ApJ, 499, 777
- Bethell et al. (2007) Bethell T. J., Zweibel E. G., Li P. S., 2007, ApJ, 667, 275
- Boissé (1990) Boissé P., 1990, A&A, 228, 483
- Charnley et al. (1988) Charnley S. B., Dyson J. E., Hartquist T. W., Williams D. A., 1988, MNRAS, 235, 1257
- Christie et al. (2011) Christie H., Viti S., Williams D. A., Girart J. M., Morata O., 2011, MNRAS, 416, 288
- Cuppen & Herbst (2005) Cuppen H. M., Herbst E., 2005, MNRAS, 361, 565
- Cuppen & Herbst (2007) Cuppen H. M., Herbst E., 2007, ApJ, 668, 294
- Cuppen et al. (2006) Cuppen H. M., Morata O., Herbst E., 2006, MNRAS, 367, 1757
- Dickman & Herbst (1990) Dickman R. L., Herbst W., 1990, ApJ, 357, 531
- Draine & Lee (1984) Draine B. T., Lee H. M., 1984, ApJ, 285, 89
- Duley & Williams (1993) Duley W. W., Williams D. A., 1993, MNRAS, 260, 37
- Duvert et al. (1986) Duvert G., Cernicharo J., Baudry A., 1986, A&A, 164, 349
- Flower & Pineau des Forets (1994) Flower D. R., Pineau des Forets G., 1994, MNRAS, 268, 724
- Frerking et al. (1982) Frerking M., Langer W. D., Wilson R. W., 1982, ApJ, 262, 590
- Garrod et al. (2008) Garrod R. T., Weaver S. L. W., Herbst E., 2008, ApJ, 682, 283
- Govers et al. (1980) Govers T. R., Mattera L., Scoles G., 1980, J. Chem. Phys., 72, 5446
- Hartquist & Williams (1990) Hartquist T. W., Williams D. A., 1990, MNRAS, 247, 343
- Hasegawa & Herbst (1993) Hasegawa T. I., Herbst E., 1993, MNRAS, 261, 83
- Hasegawa et al. (1992) Hasegawa T. I., Herbst E., Leung C. M., 1992, ApJS, 82, 167
- Hassel et al. (2010) Hassel G. E., Herbst E., Bergin E. A., 2010, A&A, 515, A66
- Herbst & Millar (1991) Herbst E., Millar T. J., 1991, in James R. A., Millar T. J., eds, Molecular Clouds Interstellar chemistry. p. 209
- Hollenbach & Salpeter (1970) Hollenbach D. J., Salpeter E. E., 1970, J. Chem. Phys., 53, 79
- Iglesias (1977) Iglesias E., 1977, ApJ, 218, 697
- Langer et al. (2000) Langer W. D., van Dishoeck E. F., Bergin E. A., Blake G. A., Tielens A. G. G. M., Velusamy T., Whittet D. C. B., 2000, Protostars and Planets IV, p. 29
- Leger et al. (1985) Leger A., Jura M., Omont A., 1985, A&A, 144, 147
- Leitch-Devlin & Williams (1985) Leitch-Devlin M. A., Williams D. A., 1985, MNRAS, 213, 295
- Roberts et al. (2007) Roberts J. F., Rawlings J. M. C., Viti S., Williams D. A., 2007, MNRAS, 382, 733
- Rodgers & Charnley (2003) Rodgers S. D., Charnley S. B., 2003, ApJ, 585, 355
- Ruffle & Herbst (2000) Ruffle D. P., Herbst E., 2000, MNRAS, 319, 837
- Sandford & Allamandola (1993a) Sandford S. A., Allamandola L. J., 1993a, ApJ, 417, 815
- Sandford & Allamandola (1993b) Sandford S. A., Allamandola L. J., 1993b, ApJ, 409, L65
- Schaefer (2007) Schaefer J., 2007, Chem. Phys., 332, 211
- Schöier et al. (2002) Schöier F. L., Jørgensen J. K., van Dishoeck E. F., Blake G. A., 2002, A&A, 390, 1001
- Schutte et al. (1976) Schutte A., Bassi D., Tommasini F., Turelli A., Scoles G., Hermans L. J. F., 1976, J. Chem. Phys., 64, 4135
- Smith et al. (1993) Smith R. G., Sellgren K., Brooke T. Y., 1993, MNRAS, 263, 749
- Tielens & Allamandola (1987) Tielens A. G. G. M., Allamandola L. J., 1987, in Morfill G. E., Scholer M., eds, NATO ASIC Proc. 210: Physical Processes in Interstellar Clouds Evolution of interstellar dust. pp 333–376
- Tielens & Hagen (1982) Tielens A. G. G. M., Hagen W., 1982, A&A, 114, 245
- Tielens et al. (1994) Tielens A. G. G. M., McKee C. F., Seab C. G., Hollenbach D. J., 1994, ApJ, 431, 321
- van Dishoeck & Blake (1998) van Dishoeck E. F., Blake G. A., 1998, ARA&A, 36, 317
- Viti et al. (2003) Viti S., Girart J. M., Garrod R., Williams D. A., Estalella R., 2003, A&A, 399, 187
- Viti & Williams (1999) Viti S., Williams D. A., 1999, MNRAS, 305, 755
- Whittet et al. (1989) Whittet D. C. B., Adamson A. J., Duley W. W., Geballe T. R., McFadzean A. D., 1989, MNRAS, 241, 707
- Whittet et al. (1988) Whittet D. C. B., Bode M. F., Longmore A. J., Adamson A. J., McFadzean A. D., Aitken D. K., Roche P. F., 1988, MNRAS, 233, 321
- Whittet et al. (1998) Whittet D. C. B., Gerakines P. A., Tielens A. G. G. M., Adamson A. J., Boogert A. C. A., Chiar J. E., de Graauw T., Ehrenfreund P., Prusti T., Schutte W. A., Vandenbussche B., van Dishoeck E. F., 1998, ApJ, 498, L159
- Whittet et al. (2007) Whittet D. C. B., Shenoy S. S., Bergin E. A., Chiar J. E., Gerakines P. A., Gibb E. L., Melnick G. J., Neufeld D. A., 2007, ApJ, 655, 332
- Willacy et al. (1994) Willacy K., Rawlings J. M. C., Williams D. A., 1994, MNRAS, 269, 921
- Willacy & Williams (1993) Willacy K., Williams D. A., 1993, MNRAS, 260, 635
- Willacy et al. (1994) Willacy K., Williams D. A., Duley W. W., 1994, MNRAS, 267, 949
- Williams et al. (1992) Williams D. A., Hartquist T. W., Whittet D. C. B., 1992, MNRAS, 258, 599