Physics of the Inner Ejecta
Abstract
Eta Carinae’s inner ejecta are dominated observationally by the bright Weigelt blobs and their famously rich spectra of nebular emission and absorption lines. They are dense ( to cm-3), warm ( to 7000 K) and slow moving (40 km s-1) condensations of mostly neutral (H0) gas. Located within 1000 AU of the central star, they contain heavily CNO-processed material that was ejected from the star about a century ago. Outside the blobs, the inner ejecta include absorption-line clouds with similar conditions, plus emission-line gas that has generally lower densities and a wider range of speeds (reaching a few hundred km s-1) compared to the blobs. The blobs appear to contain a negligible amount of dust and have a nearly dust-free view of the central source, but our view across the inner ejecta is severely affected by uncertain amounts of dust having a patchy distribution in the foreground. Emission lines from the inner ejecta are powered by photoionization and fluorescent processes. The variable nature of this emission, occurring in a 5.54 yr “event” cycle, requires specific changes to the incident flux that hold important clues to the nature of the central object.
1 Introduction
The “inner ejecta” of Car reside in the bright core of the Homunculus Nebula, spatially unresolved in seeing-limited ground-based images. Spectra show a complex amalgam of features, including broad emission lines from the stellar wind and a vast number of narrower lines from the ejecta gav53 ; ADT53 ; AD66 ; HA92 ; HDJ94 ; dam98 . High-resolution images using speckle techniques WEI86 ; HOF88 , and later the Hubble Space Telescope (HST) WEI95 ; ebb94 ; mors98 ; s+04 , revealed several bright objects less than 0.3′′ apart, customarily labeled A, B, C, D. The first HST spectra showed that A, the brightest object, is the central star, while the others – the “Weigelt knots” or ”Weigelt blobs” – are slow-moving nebular ejecta that produce strong narrow emission lines while also reflecting the star’s light kd95 ; kd97 . Their origin has not been explained, and this article is concerned mainly with their present-day nature.
The blobs appear to be located near the Homunculus’ midplane, which is usually assumed to lie close to the star’s equatorial plane and the orbital plane of the binary kdrh97 . They are on the near side, moving away from the star at speeds of 30 to 50 km s-1 – less than a tenth as fast as the Homunculus lobes kd97 ; zeth99 ; niel07 Ejection dates based on proper motions have ranged from 1890 to 1940, well after Great Eruption in the 1840s WEI95 ; kd97 ; s+04 ; dor04 .111 In principle, long-term acceleration might affect this question kd97 ; s+04 . The Weigelt Knots are most often linked with the “Little Homunculus” ejected during the second eruption in the 1890’s (Bish03 ; Bish05 ; see chapters by Weigelt and Kraus and by Smith in this volume).
At present, objects B, C and D were located 0.1′′ to 0.3′′ northwest of the star, corresponding to 300–1000 AU in deprojected distance or a light travel time of several days.222 pc for Car, see chapters in this volume by Humphreys and Martin and by Walborn. Their apparent sizes are somewhat less than 0.1′′ or AU, but these are just the brightest peaks in a complex pattern of emission and reflection (affected by extinction) that extends out to 0.4′′ or more from the central star. Little is known about the fainter associated emission/reflection regions, but altogether we call this ensemble of nebular material the “inner ejecta.”333 Additional fainter knots are noted in some papers. One must be wary, however, because the HST’s optical point spread function has a “ring of beads” which is not entirely removed by deconvolution using the standard STScI software.
Spectroscopic studies of the inner ejecta have pursued three main goals. The most basic is to estimate physical properties: density, temperature, ionization, kinematics, composition, and mass. These parameters may be clues to the nature and history of the central star(s). Another goal is to characterize the spectrum of the central source, e.g., as a binary system, by considering the nebular gas as a light reprocessing machine. The excitation, photoionization and specific emissions from the gas depend on illumination by the central source in the UV and unobservable far-UV. These are critical wavelengths for testing models of the central star or stars. Finally, a third goal is to use the exceptionally bright and rich (and sometimes very unusual) line emission to study basic atomic physics and line formation processes.
In this review we focus mostly on spectroscopy of the brightest Weigelt knots B, C and D, including a new analysis of D based on HST Treasury spectra obtained in 2002–2003. We also briefly discuss two other phenomena, namely, narrow nebular absorption lines that appear throughout the inner ejecta stis99 ; gull01 ; gull05 ; gull06 ; niel07 and a remarkable emission line region known as the “Strontium filament” gull01 ; zeth01sr . Strictly speaking these lie outside the inner ejecta as defined above, but they also provide insights into the nature of the central star and inner ejecta.
One important uncertainty is the nature of localized dust extinction. We know that the dust around Car is patchy on small scales, in order to explain the blobs’ high apparent brightness relative to the star. Our line of sight to the latter has several magnitudes more extinction than B, C, and D which are less than 0.3′′ away kd86 ; HA92 ; kd95 ; HGN06 – or at least this was true a few years ago MDK06 . Moreover, the visual-wavelength Weigelt blobs appear almost inversely correlated with the spatial distribution of mid-IR (warm) emission by dust. These factors lead to a fundamental ambiguity about whether the observed blobs are distinct gas condensations or simply minima in the intervening dust. Perhaps they are a combination of both.
Another issue to keep in mind is the overall transience of the inner ejecta. The Weigelt blobs were ejected from the star less than years ago. If the blobs are not confined by surrounding pressures, they should expand and dissipate in roughly a sound-crossing time, on the order of 75 years. Their spatial and spectral appearance has changed in recent years, see chapter by Humphreys and Martin in this volume. High-ionization emission lines such as He I, which are now trademarks of the knot spectra, did not appear until the 1940’s RMH08 ; fea01 . Continuing changes will occur as the material expands and moves farther from the star. Meanwhile there are cyclical changes with a 5.54-year period, usually attributed to the binarity of the central object (§2 below). Any discussion of the inner ejecta must be framed with reference to the epoch of the observations.
2 Spectroscopic Overview of the Weigelt Blobs
The Weigelt blobs produce H I and He I recombination lines and more than 2000 other identified emission lines spanning a range of ionizations from Ca+ and Ti+ up to S+2, Ar+2, and Ne+2. Most of the UV, visual, and near-IR features belong to singly-ionized iron group species, notably Fe II and [Fe II]. Extensive line lists are available viot89 ; HA92 ; HDJ94 ; dam98 ; wall01 ; zeth01cr ; vern02 . A particularly interesting aspect is the variety of strong fluorescent lines, whose upper energy states are vastly overpopulated by photoexcitation because of accidental wavelength coincidences with the H I Lyman series or other strong lines. Fluorescent Fe II 2507,2509 are the strongest emission features in near-UV spectra; their enhancements compared to other Fe II lines are larger in Car than in any other known object kd95 ; viot89 ; joha99 ; joha04 . Altogether, the varieties of lines and excitation processes provide a broad array of diagnostics with which to study both the blobs and the central object.
An obstacle to these studies has been the seeing-limited angular resolution of ground-based spectroscopy, typically 1′′. To some extent the line profiles distinguish between blobs and the stellar wind; velocity dispersions are 40–70 km s-1 vs. several hundred km s-1 respectively. However, the rich narrow-line spectrum has complex blends that resemble broad features, HST spectra of the inner ejecta show differences at sub-arcsec scales, and reflection and projection effects occur at all scales. Moreover, some high ionization forbidden lines originate in high velocity gas, distinct from the blobs and not directly part of the stellar wind (§4.1). Spatial resolution better than 0.2′′ is therefore essential for detailed studies.
The spectra of the stellar wind and the blobs vary with a 5.54 yr period zane84 ; whit94 ; dam96 ; dam08b ; dam08a ; MK04 ; meh10a . This cycle is punctuated by “events” defined by the disappearance of high-ionization emission from the blobs and inner ejecta, notably [Ne III], [Fe III], [Ar III] and He I. These features vanish on time scales of 1–6 weeks and then recover more slowly afterward. Meanwhile other phenomena occur, including an abrupt drop in the 2–10 keV X-ray emission from the colliding winds ICD99 ; CIS01 ; corc05 ; henl08 .444 See chapter by Corcoran and Ishibashi in this volume. A major goal of Car studies since 1997 has been to understand the spectroscopic events, which must be linked to some basic aspect of the central source. The disappearance of high-ionization [Ne III], [Fe III], [Ar III] and He I lines is almost certainly caused by an abrupt drop in the far-UV flux incident on the blobs and inner ejecta as originally proposed by zane84 (see §3 and §5 below). What physical effects in the central object can change its spectral energy output?
The regularity of the event cycle is usually interpreted as evidence that the central object is a 5.54 yr binary dam96 ; dam08a ; dam00 ), but no specific model has emerged that explains the full range of phenomena (see meh11 ; RMH08 ; dam08a for recent discussions). The proposed companion star is less luminous but hotter than the very massive primary meh10a . It contributes most of the helium-ionizing far UV flux and thus controls the high-ionization emission lines. The orbit is highly eccentric, so close interactions occur only for a brief time near periastron. Between spectroscopic events, the stars are widely separated and both contribute to the ionization and excitation of the inner ejecta. During an event, near periastron, the hot companion plunges deep inside the dense primary wind, so its contribution to the emergent far-UV emission is briefly obscured.555 (Editors’ comment:) Strictly speaking, the disappearance of far-UV near periastron may be caused by mass accretion onto the secondary star as proposed by Soker et al. See meh11 , the chapter by Davidson in this volume, and references therein. The inner ejecta then become less ionized because they receive light from only the cooler primary, whose wind structure and spectral energy output might also be altered by the binary encounter kd99 ; s+03lat ; kd05 ; dam08a . A model of this type can account for the X-ray variations ICD99 ; pc02 ; corc05 . But there are many uncertainties, including the nature of the hot companion star, the orbit parameters, and properties of both winds. Any model of the binary system must explain the spectroscopic properties of the inner ejecta and, specifically, the changes that occur throughout the 5.54 yr cycle. See comments and references in the chapter by Davidson in this volume.
3 Blob D and the 2003.5 Spectroscopic Event
The spectroscopic event that occurred in mid-2003 was studied at wavelengths ranging from radio through X-rays.666 See other chapters in this volume as well as kd05 ; heii06 ; dam08a and many refs. therein. Here we summarize key results for the inner ejecta, especially the almost-resolved ( 0.1′′) spectra of blob D that were obtained as part of the HST Treasury program on Car.777 http://etacar.umn.edu/. This publicly available dataset provides the most complete and reliable existing information of this type. The 2003.5 HST observations covered roughly 1630 Å to 10100 Å at resolution 40 km s-1and 0.1′′; no better data on an event are expected in the forseeable future.888 The only instrument with adequate spatial resolution, HST/STIS, was inoperative during the subsequent event in 2009. Moreover, the star’s rising brightness progressively makes the Weigelt blobs harder to observe MDK06 . Thus it is very conceivable that no one will ever obtain new “event” spectra of these objects as good as the 2003.5 STIS data.
Figures 1–8 illustrate spectral properties of blob D measured on six occasions across the 2003.5 event. The line with highest ionization, [Ne III] 3868, showed the most rapid decline and complete disappearance. Figure 1 shows it along with the more complex Balmer H8. The narrow in situ H I emission disappeared while the reflected broad stellar wind component weakened in emission but strengthened in its blueshifted P Cyg absorption (see also kd05 ; HGN06 ). Narrow lines with slightly lesser ionization, e.g., [Ar III] 7135 and [S III] 9532, disappeared about 2–3 weeks later than [Ne III] (see Figure 2 in hama05 ). At lower ionizations, features like [N II] 5755 lagged even farther, cf. Figures 1 and 2. At the event was significantly underway in [Ne III] but not in [N II], and at 2003.48 the [Ne III] line had disappeared while [N II] emission was still present.


Continuing toward lower ionization, the behavior of Fe II, [Fe II], and [Ni II] ranged from modest weakening to modest strengthening during the event. The lowest ionization lines measured in blob D, [Ca II], Ti II and V II, all became stronger (see also dam98 ). Figure 3 shows that [Ca II] 7291 and 7323 lines nearly tripled in strength, while [Ni II] 7303 mildly strengthened and He I 7281 disappeared. Some Ti II lines (not shown) approximately doubled in strength.

These phenomena were correlated with the ionization energy needed to create each ion. Ne+2, Ar+, S+2 and N+ require 41.0, 27.6, 23.3 and 14.5 eV, respectively, while Fe+ and Ni+ require 7.9 and 7.6 eV, and Ti+ and Ca+ need just 6.8 and 6.1 eV. The narrow in situ (not reflected) emission lines of H I and He I are consistent with this pattern if they form, as expected, by recombination in regions of H+ (13.6 eV) and He+ (24.6 eV). He I lines behaved approximately like [Ar III] and [S III], while the H I lines declined like [N II] (see also hama05 ).
The only obvious exceptions to this simple ionization trend were fluorescent features excited by H I Lyman lines. Figures 4 and 5 show the dramatic weakening of fluorescent O I 8446 pumped by Ly, and Fe II lines excited by Ly. Their behavior differed from the other Fe II and [Fe II] lines and seems to contradict the ionization trend. However, their emission depends not only on the amounts of Fe+ and O0, but also on H+ which produces Ly and Ly by recombination (see §4.6). In fact, the fluorescent lines behaved much like the narrow Balmer and Paschen lines in blob D, consistent with the ionization trend. This can be seen in Figure 4, which shows the disappearance of narrow H I Pa15 along with the fluorescent Fe II and O I features. All these lines disappeared when the gas became mostly H0.


Figure 6 summarizes the ionization trend for narrow lines in blob D during the 2003.5 event. Damineli et al. dam08a ; dam08b produced similar plots based on ground-based observations of a spatially unresolved mixture of regions, but with better temporal sampling and a longer temporal baseline. They show that the high-ionization lines disappeared abruptly, in just 5 to 10 days. The highest ionization line, [Ne III] 3868, was extinguished first, followed by He I 6678 about 5 days later, then [S III] 6312 6.5 days later, and finally [N II] 5755 8.5 days after that. The highest ionization lines were also the last to recover after the event, roughly in reverse order of their disappearance; the recovery times were more gradual (months) than the disappearance times (days to weeks).
The shortest disappearance times might be limited by recombination rates, which depend on gas density (see §4.2). But this is unlikely to dominate the other temporal behaviors, since the recovery times (when overall ionization is increasing) are much longer. Therefore, the emission line changes probably trace the central source’s spectral changes as viewed by the inner ejecta. In particular, the far-UV flux that regulates [Ne III] emission must have been extinguished faster, earlier and then recovered more slowly, than the lower energy spectrum that controls the lower ions. The incident photon energy distribution must have progressively “softened” until mid-event when all of the far-UV was gone. Then the spectrum hardened again as the far-UV recovered over a period of months (see also dam08b ; meh10a ; meh11 and §5 below).

Another spectral change tied to the ionization was the weakening of narrow Balmer absorption during the 2003.5 event. Unlike the stellar wind’s P Cyg absorption, these lines are formed in regions far outside the wind and even outside the Weigelt blobs (§4.6 below). They require a large column density of dense, partially ionized gas with a significant population of H0 in the level. Figure 7 shows the disappearance of H and H absorption in blob D during the 2003.5 event. The corresponding H feature (not shown) weakened by a factor of 2 but did not disappear. This narrow absorption line behavior did not exactly follow the weakening of the narrow H I emission lines or the Fe II emission lines pumped by Ly, but a decline during the 2003.5 event surely did occur in blob D. Weaker Balmer absorption strength indicates a drop in the H0 population, related to a lower degree of ionization.999 Johansson et al. joha05 report that corresponding narrow absorption in H strengthened during the 2003.5 event, and the same is true of ground-based spectra of the star plus ejecta in the 2009.0 event rich2010 . We cannot make direct comparisons to these results, because the spatial coverage was different and instrumental saturation in the HST data may have degraded spectral extractions near the peak of H. We can only speculate that the ground-based H absorption results were affected by blending with the narrow emission from the blobs, which is time variable and stronger in H than in the other Balmer lines. H might also be less sensitive to changes in the population if its larger oscillator strength leads to greater line saturation compared to H and H. We conclude that the absorbing gas participated in a spectroscopic/ionization event similar to the emission line regions in the inner ejecta.


Closer inspection of these data suggests that the temperature in blob D also fell by a moderate amount during the 2003.5 event. For each ion species, emission lines arising from higher energy states generally faded more dramatically. Figures 7 and 8 show, for example, that [S II] 4069 and 4076 declined by a factor of two during the event while [S II] 6716 and 6731 decreased by only 10%. These lines are collisionally excited, and the upper states of 4069,4076 and 6716,6731 have energies of 3.0 and 1.8 eV repectively. There is also a density dependence oste06 ; hama94 , but if we assume that the density did not change much during the event, then the observed change in the line ratio indicates a drop in temperature. We cannot derive a specific temperature without knowledge of the density, but if the temperature in the S+ gas was 7000 K before the event (2002.51), then during the event (2003.58) it declined by roughly 900 K (or 700 K if the initial temperature was 6000 K). Similar effects can be seen in [Fe II] and [Ni II], see §4.2 below.

Finally, we note that the Balmer P Cygni absorption lines, formed in the stellar wind and reflected by dust in blob D, varied contemporaneously with the narrow in situ emission lines discussed above (Figures 1 and 7). Detailed comparisons have shown that these changes tracked each other to within a month stah05 ; HGN06 ; kd05 ; dam08b . This relationship indicates again that the blobs were responding to changes in the radiative output from the central source, presumably the opaque primary stellar wind plus the hot secondary star. (Variations in the kinetic energy of the primary wind would affect the blobs only after a travel-time delay of a year or more.) This result implies that ionization and excitation in the blobs (and probably all of the inner ejecta) are dominated by the radiative flux from the central star, rather than shocks or other mechanical processes (see §5).
4 Analysis: Physical Properties and Peculiarities
Here we review basic physical properties that can be derived from the spectral lines in the inner ejecta.101010 Some of the text in §4.1 was contributed by K. Davidson and A. Mehner. We discuss blobs B, C and D interchangeably because their spectra are broadly alike.
4.1 Kinematics and Location of the Highly Ionized Gas
Kinematic data are essential for defining locations and origins of various types of regions in the inner ejecta. We mentioned some results in §1 and §2, and more information can be found elsewhere in this volume, in chapters by Weigelt and Kraus and by Smith. The Weigelt knots have Doppler velocities around km s-1 in both low and high excitation emission lines. High ionization features such as [Ne III] have Doppler widths of 65–70 km s-1 (FWHM), while [Fe II] and non-fluorescent Fe II have FWHM 55 km s-1 (§3, and s+04 ). We expect features with disparate ionization energies to form in different locations (§5, vern05 ; meh11 ). In one plausible but unproven geometry, the blobs are mostly neutral (H0) gas with ionized layers facing the central binary system. Since the hot secondary star is the chief source of relevant ionizing photons, the ionized zone varies during the 5.54 yr orbit, leading to alternate appearance and disappearance of high-ionization lines. At spatial resolution 0.05′′, HST spectroscopy shows that locations of maximum [Ne III] and [Fe III] brightness approximately match those of the low-excitation lines meh10a .111111 Some earlier authors assumed that high-ionization lines originate diffusely between the star and the Weigelt knots vern05 . To some extent this may be true, but the brightness peaks are located as stated above. HST had no imaging filters suitable for isolating the pertinent spectral lines. Higher spatial resolution will be needed to show ionization stratification. The differing line widths suggest that high-ionization zones are only loosely related to the low-ionization material, and possibly ablating from the blobs.
Ground-based spectra show blue wings of [Ne III], [Fe III], [Ar III], and [S III], extending to local peaks near km s-1 ADT53 ; AD66 ; dam98 ; hama94 ; HA92 . These are unrelated to the Weigelt knots; HST spectroscopy shows that the blue-shifted [Fe III] originates in a slightly elongated region with radius 0.1′′, centered near the star (Figs. 8 and 9 in meh10a ). The simplest guess is that these features come from our side of a mildly oblate region in the outer wind, with densities low enough to emit forbidden lines meh10a . Larger-scale locations in the Homunculus are also possible, however. Helium emission is not useful in this regard, because the complex He I line profiles combine several distinct regions, including absorption in the wind.
Apart from the Weigelt knots, narrow high-excitation forbidden lines appear in HST spectra of the star itself meh10a . Based on their small widths, low velocities, and de-excitation densities, they represent line-of-sight gas comparable to the Weigelt knots, not the stellar wind. Given HST’s high spatial resolution, these features’ response to the central UV output must be closely correlated with our direct spectroscopic view of the star itself.121212Strictly speaking, our view of the dense primary wind plus the hot companion star. The Weigelt knots may differ because they “see” the star from other directions. The primary wind is not spherically symmetric, and local circumstellar extinction may be both patchy and variable. In fact the line-of-sight [Ne III] and [Fe III] intensities do vary systematically and non-trivially through the 5.54 yr cycle meh10a ; dam08a . Their growth, broad mid-cycle maximum, and gradual decline seem reasonable in terms of photoionization by the secondary star as it moves along its orbit, but no quantitative model has been developed. The line-of-sight data meh10a showed a conspicuous brief secondary maximum in [Ne III] and [Fe III] several months before the 2003.5 event (Figure 10). This may have been the time when the orbiting secondary star was optimally located for photoionizing our line of sight meh11 .
Narrow Balmer absorption lines also trace the ionized nebular gas (§4.6). These features appear in spectra across the central 1′′ to 2′′, encompassing the star and inner ejecta kd01a . In HST spectra of the Weigelt blobs, they have heliocentric velocities of roughly 46 to 50 km s-1 (Figure 7). These values are similar to those for the narrow high-ionization emission lines s+04 . During the 2003.5 spectroscopic event, narrow H absorption weakened while corresponding H and H absorption disappeared, in a manner similar to the narrow H I emission lines. It therefore seems likely that these absorption lines form in an ionized layer that is loosely related to the blobs. In spectra taken along our direct line of sight to the star, there is additional narrow Balmer absorption at 146 km s-1 gull05 . This component of ionized absorbing gas seems to have no relationship to either the stellar wind or the blobs. It probably resides elsewhere in the inner ejecta, see §4.6.
4.2 Reddening, Extinction & Temperature
Extinction and reddening by dust can dramatically affect the observations. In principle we can estimate the reddening, , by comparing emission lines that share the same upper level. If optically thin, then their intrinsic flux ratios are
| (1) |
where , , and are the flux, wavelength and decay rate for line 1, etc. Ideally we would measure enough lines at different wavelengths to characterize the reddening curve. In practice, however, there are not enough well-measured lines of this type. One could simply adopt a standard reddening curve for the interstellar medium (e.g. card89 ), but both the cirumstellar and interstellar extinction for Car are known to be anomalously gray with rather than a normal value around 3.1 kdrh97 . Thus was probably about 7 magnitudes for the central star in 1998, but hill01 . Both these values appear to have declined since that time MDK06 ; meh10b . The blobs are thought to have much less extinction, in order to explain their surprisingly large brightnesses compared to the central object kd95 .
Hamann et al. hama99 measured suitable line pairs in HST/STIS spectra of blobs B+D. They found 0.6, 0.7, and 0.8 mag, respectively, based on [Fe II] 3175/5551, [Fe II] 3533/6355, and [Ni II] 4326/7256. Investigations with non-[Fe II] lines, however, have given vern02 ; meh10a . It is difficult to reconcile all these results, except to note that they span different wavelengths, and that a STIS instrumental effect tends to counteract reddening for Å meh10a .
Another way to estimate both reddening and temperature is to compare the entire rich spectrum of [Fe II] lines to theoretical predictions. The observed [Fe II] lines arise from metastable states at energies 4 eV, and densities in the Weigelt blobs (§4.3 below) exceed the collisional de-excitation values for most of them. Thus we can reasonably assume that the level populations are close to local thermodynamic equilibrium. In that case the relative [Fe II] line strengths are given by Equation 1 multiplied by a Boltzmann factor for the upper states’ populations. With enough lines spanning a range of wavelengths and excitation energies, we can solve for both reddening and temperature. Resulting temperatures are useful because the usual nebular diagnostics oste06 don’t work for the Weigelt blobs. For example, [O III] 4363 and 5007 are too weak because of Car’s low oxygen abundance, and [N II] 5755/6583 is too sensitive to density in this environment.
Using a few [Fe II] lines measured in blobs B+C+D with the pre-1997 HST/FOS instrument, and assuming that K, Davidson et al. estimated kd95 . Figure 9 shows results of a more detailed analysis by Hamann et al. hama99 using every reliably measured [Fe II] line in the visual and red spectrum of blobs B+C obtained in March 1998 with HST/STIS. Here each [Fe II] line’s observed flux is plotted relative to a theoretical value that assumes LTE conditions at temperatures 6000 and 10000 K, , and a standard reddening curve with (atomic data from joha77feii ). Since Car has an abnormal ratio as noted above, the values in Figure 9 should be regarded as estimates of the quantity , smaller than the true .
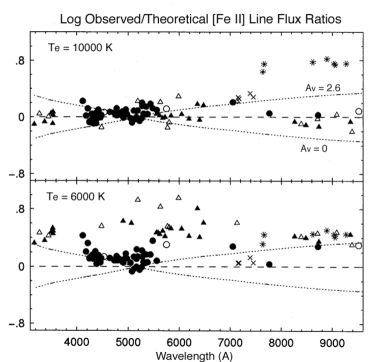
No temperature-and-reddening combination fits all the data. Levels above 2.5 eV (circles and triangles in Fig. 9) agree fairly well with K and , but this choice under-predicts lower-excitation lines (asterisks). The latter are more consistent with K and . Qualitatively a discrepancy like this can occur merely because there is a range of temperatures, so the high-excitation lines preferentially represent the highest – especially if dust within each blob causes 0.1 or 0.2 mag of local reddening. Quantitatively, though, this explanation requires a temperature range broader than 6000–10000 K.
Most likely the actual gas temperatures are near 6000 K based on the lowest energy levels (Figure 9), while levels above 2 eV are over-populated by continuum pumping. Permitted Fe II transitions absorb UV star light and populate states above 4 eV, followed by a cascade through the lower states. This “continuum fluorescence” mechanism affects Fe II emission in AGN broad-line regions netz83 ; will85 , LBV winds hill01 ; hill98 , H II regions vern00 , and probably the “strontium filament” region in the Homunculus (bau02 ; vern02 and §5 below). Eta Car has long been recognized as a good locale for fluorescence in general (e.g., kd71 ; kd95 ; HDJ94 ; viot99 ), and the likely role of Fe II continuum fluorescence in the Weigelt blobs became clear in the late 1990s hama99 .
[Ni II] lines provide additional contraints. For example, the strong 7378,7412 lines have an upper level about 1.8 eV above the ground state, while 7255,7308 share an upper state near 2.9 eV. Their ratios are nearly immune to reddening but sensitive to temperature. In the high density limit with LTE populations, the theoretical 7378/7308 ratio is about 21 for K and 5 for K hama94 . The observed value in blob D at 2002.5 was about 6, broadly consistent with the [Fe II] results if there is some non-LTE over-population of the Ni+ upper states.
During the 2003.5 event, these line ratios signaled a drop in either the temperature or the amount of fluorescence excitation. In blob D, for example (§3), [Fe II] and [Ni II] lines with higher energy states tended to weaken more than the lower-excitation lines. While this fact might have something to do with declining amounts of continuum photo-excitation, the [S II] changes described in §3 are more readily interpreted as a temperature decrease of to K.
Thus the observed changes in the line ratios suggest a temperature decline over 2–3 months. This is much longer than the radiative cooling time. For the nominal composition and physical conditions we derive for the blobs (see below), a representative cooling time is 1 to 10 days based on calculations in dalg72 and G. J. Ferland’s unpublished Hazy ionization-code manual. In addition, the blobs are located just several light-days from the star. Thus it appears that the temperature responded to changes in the spectral energy output from the central source, with only small delays due to cooling and light travel times (see also §5).
4.3 Densities
The rich emission line spectra provide various density indicators. The most reliable involve ratios of lines with similar upper-state energies, i.e., members of a multiplet, to minimize the temperature sensitivity. Such ratios can be sensitive to electron densities if they are within an order of magnitude or so of the critical densities for collisional de-excitation oste06 . Most estimates for the Weigelt blobs provide only lower limits to because each observed line ratio is near the high-density limit. Hamann et al. hama99 found these results: cm-3 based on [S II] 6716/6731, cm-3 from [S II] 4069/6731, cm-3 from [Fe II] 7155/8617, and cm-3 to cm-3 from [Ni II] 3439/3993 and 7412/7387. Wallerstein et al. wall01 estimated cm-3 based on [S II] 4068/4076. The classic ratio [O II] 3729/3726 is not detected due to the low oxygen abundance, and the analogous [N I] 5201/5198 lines are severely blended with Fe II and [Fe II]. Later work vern02 produced similar results using photoionization models.
The spatial and spectral complexity of the inner ejecta suggest that there is a range of densities. The estimates quoted above apply to low-ionization gas and they are skewed toward high densities which give the largest emissivities. There are no simple line-ratio density indicators for the more highly ionized gas, but we obtain some constraints from the observed time scales for H I and He I emission changes during spectroscopic events. Such changes cannot be much faster than the recombination time , where is a recombination rate coefficient. At the beginning of the 2003.5 event, the H I and He I line fluxes dropped substantially in less than 10 days hart05 ; dam08a ; dam08b . This fact implies densities cm-3 and cm-3 in the He I and H I emitting regions, respectively.
We conclude that – cm-3 is a reasonable estimate for the main emitting regions in the blobs, but other density regimes may also be present.
4.4 Composition
The composition of the ejecta is relevant to dust formation in the stellar wind and to nucleosynthesis and mixing processes in the stellar interior. The amount of CNO processing is of particular interest for Car. Hydrogen burning via the CNO cycle produces no net change in the total number of C + N + O nuclei, but the reaction rates in equilibrium lead to a net conversion of C and O into N. Spectra of the “outer ejecta” (just outside the nominal outer boundary of the bipolar Homunculus) show that nitrogen exceeds C + O there kd86 . Inside the Homunculus the logarithmic N/O abundance relative to solar is very large, dufo97 , while the ejecta far outside it have nearly solar N/O sm04 ; smit05 . The outer ejecta thus appear to contain the first CNO processed gas to be expelled, possibly just before the 1843 eruption (see also weis99 ). The stellar wind today is also CNO-processed hill01 .
If the blobs and inner ejecta were expelled after the Homunculus (§1), then they too should contain heavily CNO processed gas. The most reliable abundance estimates rely on lines that form in the same physical conditions. Hamann et al. hama99 used the N III] 1750 and O III] 1664 inter-combination lines to estimate [N/O] 1.8 (i.e., ) in blobs B+D. They also estimate [Fe/O] 2.0 to 2.3, based on [Fe II] 8617/[O I] 6300 and [Fe II] 7155/[O I] 6300, where the factor-of-two uncertainty comes mainly from the uncertain density. These results are consistent with an estimate that [C/Ne] and [O/Ne] are both roughly 1.7 to 2.0 based on photoionization models vern05 . We conclude that the blobs and associated high-ionization gas are heavily CNO-processed.
The dust content of the blobs is more uncertain. The fact that we see a reflected spectrum of the star in the blobs indicates that dust is present. Mid-IR observations show warm dust in the inner ejecta ches05 ; s+03ir . The strutures seen in the mid-IR images closely correspond with the knots seen in the visible although they are not spatially coincident. The visible structures, dominated by scattering, trace the walls of the dense clumps of dust, while the infrared structures are identified with the emission from hot dust, probably the external layers of the clumps. This observational evidence is consistent with the theoretical dust temperatures, which indicate that dust can survive closer to the star than the nearest Weigelt blob B s+03ir ; kdrh97 . The infrared flux appears to be decreasing from 2002 to 2005 art , but is not correlated with the 2003.5 event or with orbital phase. It may be due to enhanced dust destruction in response to the increased stellar flux.
To avoid projection effects and determine how much dust actually resides within the line-emitting blobs, we can examine the gas phase depletions of refractory elements like Fe, Cr, Ni, Ti and Ca compared to non-refractory elements like C, N, O, Ar and S. In cool interstellar gas clouds in our Galaxy, refractory elements are typically depleted by factors of 10 to 100 because they are locked up in dust grains sava96 . Iron, in particular, is depleted by a factor of 200 in cool Galactic clouds. In the Weigelt blobs, however, one study of [Fe III] lines found the Fe/H abundance to be roughly half solar vern05 . If we combine this with an estimate by Hillier et al. hill01 ; HGN06 for solar Fe/H in the star, we conclude that iron is not strongly depleted in the vicinity of the blobs. This result is consistent with a cursory inspection of the low-ionization blob spectra, wherein emission lines of Fe, Ca and Ti are well represented compared to the lines of non-refractory elements like S and even the grossly overabundant N. Thus the depletions of refractory elements are much smaller in the blobs than in cool Galactic clouds.
There are two other hints that the dust-to-gas ratio is small in the blobs. First, the strong fluorescent emission lines of Fe II and O I pumped by Ly and Ly, respectively, require many scattering events in the Lyman lines (§4.5 below). A “normal” Galactic amount of dust would destroy the Lyman line photons before they are absorbed substantially Fe II or O I. Second, energy budget considerations indicate that the blob material (like the Homunculus on much larger scales) has a relatively unobscured view of the central object kd95 . If much dust is present, it must have a patchy distribution so that starlight can largely avoid it by scattering MDK06 ; HGN06 .
4.5 Fe II and Fluorescent Line Emission
Spectra of the blobs and inner ejecta are strongly affected by resonant fluorescence. Fe II has by far the richest spectrum of known fluorescent lines, including a spectacular pair at 2507.6 and 2509.1 Å (Figure 5, viot89 ; kd95 ; kd97 ; joha93 ; HDJ94 ). There are also fluorescent lines of O I, Cr II, Fe III, Ni II and possibly Mn II joha95 ; joha00 ; zeth01cr . Their upper energy states are vastly over-populated because of accidental wavelength coincidences with H I Lyman lines. An interesting exception is Mn II, which apparently absorbs a strong UV line of Si II joha95 . Fe II and O I fluorescence has been discussed thoroughly oste06 ; elit85 ; gran80 ; sigu98 for a variety of stellar environments, including symbiotic stars and of other early-type stars with dense circumstellar envelopes rudy00 ; carp88 ; pens83 ; hart00 ; joha83 ; joha84 ; hama88 ; hama89 . In general this phenomenon can help us diagnose physical and radiative conditions in the emitting regions.
The fluorescence in Fe+ is “pumped” by Ly and yields a unique pattern of emission lines. The primary cascade lines appear in the UV between 1800 Å and 3000 Å and also in the far-red between 8000 Å and 10000 Å (HDJ94 and refs. therein). Figures 4 and 5 above show examples of Fe II fluorescent lines in the blob D spectrum. These lines would not be detectable without this form of excitation.
The strongest fluorescent lines in Car are the Fe II 2508,2509 shown in Figure 5. Their particular excitation has been discussed extensively by Johansson et al. joha93 ; joha98 . They constitute an interesting puzzle because they appear far too strong compared to other lines arising from the same upper states; transitions to particular lower states are anomalously favored. Johansson et al. joha98 and Johansson & Letokhov joha04 proposed that stimulated emission is responsible – a natural UV laser! This hypothesis is controversial because it seems incompatible with simple estimates of the photon densities zeth99 ; kdrh97 ; more work is needed. In any case, Ly fluorescence clearly does control the excitation of 2508,2509.
Figure 4 also shows fluorescent O I 8446, which represents a secondary cascade from an energy state pumped by H I Ly. The importance of fluorescent excitation in this case can be deduced from the relative strengths of the primary cascade lines in the near-IR (e.g., 11287/13165) and from the strength of 8446 compared to non-fluorescent O I 7773 HDJ94 . The O I resonance wavelength differs from from Ly by only 0.04 Å or 12 km s-1. Given the high Ly opacity expected in these regions, Ly photons incident from the outside would have little effect on the O0 excitation. Therefore O I fluorescence must be driven by Ly photons created within the blobs; we will return to this point below.
Simple considerations of the fluorescence processes lead to useful constraints on the physical conditions. For example, the Fe+ transitions that absorb Ly arise from metastable lower states which must be significantly populated. These populations can be maintained by collisions if the gas densities are above the critical values for those levels, cm-3, consistent with our estimates in §4.3 above.
Another constraint involves ionization. Strong O I emission requires a significant amount of neutral gas, since is closely coupled to by charge exchange reactions. The Fe II emission regions are also expected to have appreciable amounts of H0 (§5 below and vern02 ). However, Ly and Ly photons must be abundant in order to drive the fluorescence. Any Lyman line that is incident from the outside will be blocked by the extremely large line opacities of H0. Therefore, the fluorescence observed in Fe II, O I, etc. is caused by Lyman line photons that are created locally inside the emitting regions (see also below and HDJ94 ). This requires a particular ionization balance with enough neutrals to maintain sufficient O0, Fe+, etc., but also enough H+ to produce Lyman line emission. In a photoionized gas, this balance is achieved in zones of partial ionization just behind (i.e., on the more-neutral side of) the H+–H0 recombination front vern02 ; bal04 .
One can think of Fe II fluorescence as an escape route for Ly photons that are otherwise trapped. The low Fe/H Fe+/H0 abundance ratio means that such photons will scatter many times from hydrogen atoms before being absorbed by Fe+. Some of this absorption occurs in Fe II lines that have relatively poor wavelength coincidences with Ly (1215.67 Å). For instance, the strong Fe II 2508 line is pumped by a UV transition offset by 630 km s-1. Therefore, if the Ly line profile in this gas is symmetric, it cannot be much less than 1260 km s-1wide. For another strong fluorescent line, Fe II 9123, the corresponding value is 1340 km s-1. Since fluorescent Fe II lines with poorer wavelength coincidences are absent, 1300 km s-1 is a fair estimate of the full width of the exciting Ly line within the gas HDJ94 ; hart05 . Similar results have been derived from the Cr II fluorescence features zeth01cr .
Locally-emitted Ly photons can indeed be distributed across this wide range in apparent velocities because of natural broadening. If the line-center optical depth is large, , then the Ly absorption profile is dominated by damping wings and FWHM , where is a characteristic doppler width elit86 . Our estimate FWHM(Ly) km s-1 implies that Ly has , which corresponds to an H0 column density of cm-2 if the velocity distribution is thermal and K. This estimate agrees well with theoretical predictions for dense Fe II emitting regions bal04 ; elit85 . If the Fe II emitting region in Car is 20% ionized vern02 , then the total hydrogen column would be roughly cm-2. This is much smaller than the probable column density through an entire Weigelt blob (§1), which is consistent with the fluorescent lines forming in boundary layers between the neutral and ionized gas.
Another important constraint comes from the O I fluorescence. In low-density H II regions where the optical depth in H is not large, Ly is converted, after only about 10 scattering events, into H plus Ly photons which then escape: “Case B recombination.” This situation cannot produce O I fluorescence because a typical Ly photon is scattered by H0 about as often as by O0, leaving little opportunity for O0 to absorb Ly kdhn79 ; gran80 . O I fluorescence therefore requires large optical depths in H in order to trap the H photons and inhibit the conversion of Ly into H + Ly. This in turn requires a large population in the level of H0. If we could view this gas against the background of a bright continuum source, we should see strong narrow absorption in the Balmer lines (see §4.6 below)!
Finally, it has been suggested that the Ly photons needed for the Fe II fluorescence come from the stellar wind rather than in situ emission in or near the Weigelt blobs kd01b ; vern02 ; hart05 ; joha04 . This might seem plausible because i) the Ly intensity from the star should be much stronger than the adjacent stellar continuum hill01 , and ii) the width of the Ly profile can be FWHM km s-1 because the wind speeds can exceed 500 km s-1 hill01 ; s+03lat . However, it is not clear that the wind’s Ly profile really is this broad; the observed stellar Balmer lines are narrower (Fig. 7, HGN06 ; kd05 . Several other stars with strong nebular Fe II fluorescence have even narrower H I lines than Car, though their fluorescent spectra also require Ly with FWHM km s-1 hama88 ; hama89 . Therefore an external source of broad H I emission lines does not seem to be important for the fluorescent Fe+ excitation. A more serious concern is that the large Lyman line opacities would prevent external photons from penetrating the blobs to drive the fluorescence. We noted above that Ly photons from the outside cannot play any role in the O I pumping. The large Ly opacities in the blobs imply that external Ly photons could pump Fe II only in transitions that are far removed from the Ly line center; the other Fe II lines need to be pumped by locally created Ly. Thus there would need to be two fluorescent processes operating at the same time and varying in unison during the spectroscopic events. Moreover, it is not obvious why the star’s Ly intensity would vary as needed because, for example, the stellar Balmer line fluxes change by only a factor of 2. Overall, the observed Fe II fluorescent lines are more easily understood if they are linked to the ionization and the local creation of Ly photons.
4.6 Narrow Nebular Absorption Lines
Narrow absorption lines of H I and some low-ionization metals appear across the 1–2′′ core of the Homunculus, including the central star and the Weigelt blobs kd99 ; hama99 ; stis99 ; gull01 ; gull06 ; joha05 ; niel07 . Figure 7 shows, for example, narrow absorption in H and H in the spectrum of blob D. These features are clearly not related to the broad P Cygni wind profiles. At least some of them form in the inner ejecta (see below), while others apparently arise farther out in the “Little Homunculus” or in the outer shell surrounding the Homunculus itself niel07 ; gull06 ; gull01 . This situation is highly unusual; one does not generally see Balmer absorption in the ISM or even in denser-than-average nebulae because very few H I atoms there are in the level.
The metal absorption lines have low ionizations typified by Fe II and Ti II. In spectra towards the star they show at least 30 distinct velocity components, with the strongest features near 146 and 513 km s-1. In the blob spectra the absorption components are less distinct and their velocities are different niel07 . A detailed analysis of the stellar spectrum gull06 ; niel07 shows that many of the Fe II and Ti II lines arise from metastable excited states, so densities in the absorbing gas must be near or above those states’ critical values. Gull et al.gull06 estimate that the strong system at 146 km s-1 has to cm-3and to 7300 K, located roughly 1300 AU from the star. The relevant column density in Fe+ is cm-2. If we assume that Fe/H is solar and all of the iron is singly ionized, then the corresponding hydrogen column is cm-2. They also note that metastable Fe+ levels below 3.2 eV are approximately in LTE, while those at higher energies are overpopulated compared to LTE – similar in this respect to the Weigelt blobs as discussed above. The estimated location places the absorbing gas within the inner ejecta, at ′′, but it is clearly distinct from the blobs since it has a different velocity and lies along our line of sight to the central star.
Balmer absorption lines in a nebular environment are surprising because they require significant populations in the level of H0. A line-center optical depth of in H, for example, implies a column density cm-2 if the doppler velocities are thermal with K. This requires a dense gas that is neutral enough to have H0 but also ionized enough to populate the level. This situation is believed to occur in the broad emission line regions of quasars ferl79 ; kdhn79 , and Balmer line absorption has been observed directly in quasar outflows where the densities and ionizations might be similar to the inner ejecta of Car hutc02 ; hall07 .
One way to populate the H I level is by collisions in a warm gas where this level is thermalized, such that that the downward rate due to electron collisions exceeds the net rate for radiative decays. At first sight this would require an absurdly large electron density – except that almost every radiative decay is nullified, macroscopically speaking, when the fresh Ly photon is immediately absorbed in an excitation event. Therefore our net radiative decay rate includes only the few Ly photons that escape from the vicinity. In this case the minimum density for strong collisional de-excitation is roughly given by
| (2) |
where is the downward collision rate coefficient, is the line-center optical depth in Ly, is the escape probability for Ly photons, and cm-3 is the critical density for the level at K in the absence of Ly entrapment. For cm-3, thermalization requires and thus a total H0 column density cm-2 , assuming a thermal velocity dispersion. This corresponds to cm-2 in LTE at 7000 K, easily sufficient to produce for the Balmer absorption lines.
These physical conditions are reasonable for the partially ionized gas associated with the Weigelt blobs. In fact, they resemble what we inferred from the fluorescent emission lines (§4.5). However, thermalization is an extreme requirement. Balmer absorption lines can occur at values of and , below the thermalization limit if recombination is also important for creating Ly photons that are subsequently trapped. The inability of these Ly photons to escape can lead to populations that are significantly enhanced relative to LTE hall07 .
This general scheme for observable Balmer absorption is supported by measurements of damped Ly and Ly absorption lines in spectra of the central star HGN06 . The origin of the damped lines is uncertain because they are too broad to measure their kinematics. However, they clearly form in the nebular environment of Car and a likely location is in the Balmer line absorber discussed above. The neutral hydrogen column density derived for the damped absorber, cm-2, is also consistent with the conditions needed for Balmer line absorption.
Another factor that might play a role is the metastable nature of the H state joha05 . Radiative decays from occur primarily by 2-photon emission with transition probability 8 s-1, compared to s-1 for Ly decay from . Therefore the level thermalizes at much lower density than . On the other hand, collisional mixing between the states (e.g. ) may help to depopulate . Detailed calculations are needed to examine the various processes controlling H0 ionization and population in environments consistent with the absorbers in Car131313 Johansson et al. joha05 argued that the population is regulated by absorption of Ly photons from the central object. However, that scheme ignores the large Lyman line opacities in the absorbing nebula (see also §4.5). We also note that most of the environments favored by their calculations for Balmer line absorption would be optically thick to Thomson scattering at all wavelengths..
In any case, the narrow absorption lines clearly represent important gas components in the Homunculus. Some of the absorbers reside in the inner ejecta with large column densities and physical conditions similar to the Weigelt blobs. They appear to be blob-like material that happens to be viewed against a bright background of direct or reflected starlight. The narrow Balmer absorption lines seen toward the blobs might actually form in an outer ionized layer of the blobs themselves (§4.1). However, the distributed appearance of the Balmer and other narrow absorption lines across the inner ejecta, with a range of velocities, shows that these absorbing regions are much more extended than the individual Weigelt blobs. They might also contain a significant amount of mass (§6 below).
4.7 Mass of the Weigelt Blobs and Inner Ejecta
The mass of ejected material has direct implications for the nature, evolution, and instabilities of the central star. We can estimate this mass from the strengths of forbidden emission lines. This is fairly straightforward because the relevant level populations are close to LTE (see above); the observed flux is therefore proportional to mass rather than mass times density. Davidson et al. kd95 used the [Fe II] 5376 flux measured in HST observations of a 0.3′′ region including Weigelt blobs B+C+D, and found M⊙ assuming all of the iron is Fe+, solar Fe/H abundances, 3 magnitudes of extinction, and LTE at K. This estimate is surely a lower limit because it ignores possible depletion of iron into dust grains and it applies only to the emitting regions of [Fe II] 5376. (It excludes the more highly ionized zones, see §5). Nonetheless, if we adopt a diameter 0.1′′ 230 AU for each blob (§1), we find that this mass corresponds to an average density cm-3within them, reasonably consistent with our estimates above (§4.3).
We can estimate the mass outside the blobs by using emission lines measured through a larger 1′′aperture. Starting with the measured flux in [Fe II] 7155 HDJ94 , we reduce this flux by 20% to represent only the narrow (non-stellar) emission component, correct for 2 magnitudes of red extinction, assume solar Fe/H, and LTE populations with K. The result, M⊙, is three times larger than the Davidson et al. estimate for the inner 0.3′′. A similar calculation applied to [Ar III] 7136 in the same ground-based data (but including its entire flux because it appears to be entirely nebular, §4.1), yields 0.002 M⊙ for higher ionization gas.
The narrow absorption lines might provide a rough estimate of the nebular mass independent of extinction. For instance, if the Balmer line absorber covers an area of AU2 and its average column density is cm-2 (well below the value measured toward the star but above the minimum needed for thermalization, §4.5), then the total mass in this absorber is M⊙, where is the neutral fraction.
To some degree, we can simply add these mass estimates together because they represent different gas components. Doing this we find a minimum total mass of 0.013 M⊙ within the central . However, the values based on emission line fluxes are only lower limits because i) they probe just the optimal emitting regions for particular lines, and ii) the extinction corrections may be larger if, as expected, the obscuration is substantially gray (§4.2) or the dust distribution is patchy. (Fainter regions may be those with more extinction rather than less emission, §1). Based on these considerations, the total mass in the inner ejecta is most likely in the range 0.02 to 0.05 M⊙ (see also kd97 ).
4.8 The Strontium Filament
The “strontium filament” is a patch of nebulosity located several arcsec northwest of the star. It is remarkable for its Sr II and [Sr II] emission lines as well as some extraordinarily low-ionization features zeth01sr ; zeth01cr ; bau02 ; hart04 ; bau06 . Not really a filament, this structure is much larger than the Weigelt blobs and has more complicated kinematics. Studies of the Sr filament may be helpful for understanding the inner ejecta.
Its spectrum is essentially a lower-ionization version of that emitted by the Weigelt blobs. It is dominated by emission from species such as C0, Mg0, Ca0, Ca+, Sc+, Ti+, V+ and Mn+, in addition to the signature Sr+ lines hart04 . Its iron spectrum has more Fe I and [Fe I] than Fe II and [Fe II], and there are none of the fluorescent lines of Fe II, O I, etc., that require partially ionized gas (§4.5). There are also no H I or He I emission lines; the hydrogen must be essentially neutral.
Spectroscopically, the Weigelt blobs most resemble the Sr filament during a spectroscopic event. At such a time the blobs’ H I and He I lines become extremely weak, fluorescent lines disappear, and the lowest ionization features like [Ca II] and Ti II and [Ti II] strengthen (§3). The blobs never become as neutral as the Sr filament, but overall the conditions then appear to be similar. Calculations of multi-level Sr+ and Ti+ atoms in the Sr region bau02 ; bau06 suggest that the free electron densities there are of order cm-3 at temperatures of K (cf. §4.2 and §4.3). Considering that the gas is mostly neutral, the total hydrogen density may be substantially higher. The energy source for this region’s line emission is believed to be incident stellar radiation. However, the lower ionization in the filament cannot be explained merely by its distance from the star. The stellar spectrum seen by the filament appears to cut off sharply above 8 eV, limiting the ionization state to neutrals and some singly-ionized species in the iron group hart04 . The Weigelt blobs see a harder stellar spectrum, even during a spectroscopic event.
The strong metal line emissions from both the blobs and the Sr filament are believed to be excited by a combination of collisions and photo-absorption of the stellar visible and near-UV flux, i.e., by continuum pumping (see below).
5 Line Formation Physics
The rich emission-line spectra discussed above present many diagnostic opportunities but also a basic problem: How are they produced? The importance of radiation from the star is evident in the spectroscopic events. For example, the stellar wind P Cygni features reflected by dust in the blobs change at roughly the same time as the in situ narrow emission lines (§3 and Fig. 7). Changes in the star and in the blobs track each other within a month or less (see also stah05 ; HGN06 ; kd05 ; dam08a . This fact probably indicates that the blob spectra are responding to changes in radiation from the star (or rather the two stars). Evidently this is the energy source for ionization and excitation inside the blobs. The other possibility, kinetic energy in the stellar wind, is less powerful and is ruled out by the event timings (also §3).
Verner et al. vern02 ; vern05 and Mehner et al. meh10a used photoionization codes to show that most properties of the blob spectra can, indeed, be matched by dense clouds irradiated by sources like those expected for the primary star and its putative hot companion. In these models the high-ionization lines of [Ne III], [Ar III], He I, etc., form in (H+) layers directly exposed to the central source, while Fe II, [Fe II], Ni II, [Ni II], [Ca II], Ti II, [Ti II], etc., form in a warm, partially ionized environment behind the H0–H+ recombination front. The predicted temperature there is roughly 5000–7000 K and the H+/H fraction ranges from 50% in the warmest regions to 15% farther behind the front vern02 . Collisions and UV continuum pumping together produce strong emission from Fe II, [Fe II] and similar ions.
Circumstances like these have often been discussed for the Fe II emission regions of active galactic nuclei ferl79 ; netz83 ; will85 ; vern99 ; bal04 . Continuum pumping dominates the excitation of Fe+ and similar ions for energy levels above a few eV vern02 ; vern05 ; bau02 ; bau06 ; hill98 . Thermal collisional excitation populates metastable lower states, which serve as launching pads for continuum pumping to the higher states vern02 ; bal04 .
The well-studied line absorber at 146 km s-1 appears to be blob-like material seen against the background of the stellar continuum (§4.6). Specific calculations for that environment indicate, again, that low states of Fe+ are populated by collisions at K and to cm-3. UV absorption lines directly measure continuum pumping out of these states gull05 . Narrow Balmer absorption lines at this same velocity in the stellar spectrum indicate that the low-ionization absorber is accompanied by enough hydrogen ionizations to populate the level of H0.
These results take us a long way toward understanding the spectra of the Sr filament and inner ejecta, but there are complications. The most basic is that the local ionization waxes and wanes with the 5.54 yr event cycle. To some degree we can think of this as a spatial movement of the H0–H+ recombination front. Between spectroscopic events, such a front must exist somewhere in the region of interest, because we see both low and high ionization lines.141414 H0 and H+ can be diffusely mixed in comparable amounts, with no well-defined ionization front, only if the “photoionization parameter” is very small kdhn79 . Straightforward models do not allow such small values in Car’s inner ejecta meh10a . During each spectroscopic event, however, the spectral signatures of the (H+) zone dramatically weaken throughout the inner ejecta. The recombination front must then be much closer the central star.
A key to understanding these ionization changes is in the detailed timing of the transition from spectroscopic high to low states. First one sees a decline in the [Ne III], [Ar III] and He I lines, followed in order by [Fe III], Si III], N II, [N II] and H I, according to their ionization energies (§3, also dam08a and refs. therein). Before the event there must be a significant flux with eV to maintain the Ne++. But then, over about 2 weeks, the source cutoff energy slides down to the Lyman limit at 13.6 eV. This behavior reverses during the recovery phase, but over a longer time. Meanwhile, most low-ionization features, notably [Fe II] and the non-fluorescent Fe II lines, remain fairly steady. Their ionization and excitation must be less affected by changes in the flux above the Lyman limit. The lowest-ionization lines, [Ca II] and [Ti II], strengthen during an event – most likely due to a general shift in ionization from Ca+2 and Ti+2 toward Ca+ and Ti+.
Mehner et al. meh10a reported the [Ne III] and [Fe III] behavior shown in Figure 10, including a strong peak several months before the 2003.5 event (see §4.1 above). These HST/STIS data refer specifically to gas along our line of sight to the star, with a velocity of km s-1 like the Weigelt blobs. The blobs vary in a similar way, but the peak just mentioned was not reported in ground-based data dam08a .

The Sr filament, on the other hand, has a lower ionization spectrum and remains that way throughout the event cycle hart04 . Evidently the H0–H+ ionization front never reaches that region, although the stellar flux would normally be strong enough to do so. Some intervening gas must block the stellar UV continuum and impose a cutoff above 8 eV at that location of the filament hart04 . The shield must be substantially non-ionized, with large bound-free opacities not just in H I but also in complex atoms with ionization thresholds near 8 eV. The leading candidates are Mg0, Si0, and Fe0 with ionization energies 7.6, 8.1, and 7.9 eV. The nature of this UV shielding medium is almost as intriguing as the Sr filament itself, but we should keep in mind that UV extinction may occur throughout a range of locations.
The most puzzling aspect of line emission from the Sr Filament and the Weigelt blobs during an event is that neither region appears to contain a significant amount of H+. Hydrogen recombination lines are very weak or absent (§§3,4.7). The photoionization calculations cited above generically predict that the low-ionization emitting zones should be partially ionized. Some amount of ionization is necessary to provide photoelectric heating and free electrons. If hydrogen and helium are entirely neutral, then the burden for these tasks falls entirely upon the heavy elements and possibly dust grains. This seems problematic because it would lead to very small electron fractions and temperatures insufficient to collisionally excite even the low-energy forbidden lines in species like Fe+ or Fe0. There should be some amount of ionization leading to H I line emission during all phases of the event cycle.
The solution to this problem is not obvious. One possibility is that significant H+ exists in these regions but has escaped detection. Quantitative upper limits to Balmer lines in the Sr Filament have not been reported; Hartman et al. hart04 imply that they are weaker than other lines. Weak nebular H I lines are difficult to measure near Car because they are blended with the dust-reflected broad stellar wind lines. Blob D as described in §3 appears to have narrow H and H emission during the low-ionization states, but these are weaker than before the event and H and H are hard to detect (Fig. 7). If we compare the weak-state narrow H flux to a typical [Fe II] line, we find that the ionized fraction H+/H in blob D during the 2003.5 event was less than 1/10 of the values 15% to 50% predicted by models of the Fe+ emitting region vern02 .151515 Here we assume Case B recombination for H and LTE for [Fe II], with cm-3 and K. The disappearance of Fe II fluorescence pumped by in situ Ly (§4.5) also suggests that the Fe II zone is effectively H0 during an event. Meanwhile the temperature drops by only about 10% and collisionally excited [Fe II] lines remain nearly steady, as though they have nothing to do with the changing ionization.
Another possibility is that shocks or turbulence in the outflow provide just the right amount of heat and free electrons without significantly ionizing hydrogen. This process might be supplemented by absorption of the stellar flux by heavy elements and possibly dust grains. It is not at all clear whether this scenario is viable, but it is worth investigating because these processes are unrelated to the incident far-UV flux and the hydrogen ionization. They might provide a natural explanation for the steadiness of some low-ionization emission throughout the 5.54 yr event cycle.
A third possibility is that the gas is too cool for collisional excitation but some other process drives the low-ionization emission. Continuum pumping is expected to play an important role, which may be enhanced if non-thermal motions (e.g., turbulence) broaden the lines and thus enhance the photo-excitation rates netz83 ; vern02 ; bal04 . Continuum pumping ties low-ionization lines directly to the relatively stable near-UV and visible spectrum of the central object. However, collisional excitation at some reasonable temperature is still needed to populate the low-energy metastable states, facilitating continuum pumping to higher states. As noted earlier, low metastable states of Fe+, Ti+, etc., in the blobs and Sr Filament appear to have LTE-like populations with to 7000 K (§4.2, and bau02 ). Somehow this occurs without much hydrogen ionization. This presents a problem because at 6000–7000 K with 107 electrons per cm3, the Saha eqn predicts more H+ than H0!
6 Summary: The Nature and Origin of the Inner Ejecta
The inner ejecta are dominated observationally by the Weigelt blobs, which appear to be concentrations of warm, relatively dense gas that is heated, photo-excited and usually (apart from the spectroscopic events) photo-ionized by the central continuum source. Considerable amounts of gas also exist outside the blobs, including prominent absorption line regions and some faster and less dense gas that emits [Ne III], [Ar III], etc. The blobs, at least, represent heavily CNO processed gas emitted from the primary star roughly a century ago. There appears to be little dust within the main emitting and absorbing condensations of the inner ejecta, but our knowledge of the amount and spatial distribution of this material is limited by uncertainties in the patchiness and amount of the (rather gray) foreground extinction.
There are at least two leading unsolved puzzles in the emission line physics. The most fundamental concerns the heating and weak ionization of the gas that produces strong emission from ions like Fe+, Ni+, Ca+, Ti+ and Sr+. Existing photoionization and photo-excitation models imply that this gas should be partially ionized, with significant amounts of H+; but the data indicate that hydrogen is practically non-ionized in the blobs during the spectroscopic events (and in the Sr filament at all times). Another puzzle involves the bizarre line ratios emitted from Ly-pumped levels of Fe+ that produce the strong 2508 and 2509 lines.
We conclude with a reminder about the broader goal of studies of the inner ejecta – to understand the nature and evolution of the central object. Here let us mention one particular topic that deserves more study. During the transitional phases at the beginning and end of a spectroscopic event, the UV flux from the central star(s) is extinguished by varying amounts/properties of a shielding gas. Moreover, the event timings observed in various ions (§3) imply that the cutoff energy slides from the far-UV to the near UV and back again. Calculations are needed to see what might cause this behavior. It cannot occur merely by variable column densities in a neutral medium. A more realistic scenario would involve column densities in partially ionized gas, possibly combined with varying degrees of ionization.
In the binary model of the central object, radiative shielding occurs when the hot companion star plunges deep inside the dense wind of the primary (§2). The shielding medium is the dense wind, perturbed or enhanced by its interaction with the hot binary. Quantitative spectral studies of the inner ejecta, especially during the transition phases, should be very helpful for constraining basic properties of the companion star, its wind, and the binary orbit/orientation. For a few days before and after periastron passage, some regions of the inner ejecta should be lit up by far more UV radiation than others. New observations with enough spatial and temporal resolution might allow us to see this pattern of illumination move across the inner ejecta, as has been suggested already for some nebulosity farther out in the Homunculus s+04ph . The best tracer for these effects is probably the [Ne III] 3868 line because its emission is tied directly to the far-UV output from the hot companion and its profile is not blended with reflected features from the stellar wind (see meh10a ).
Acknowledgements.
FH grateful to the HST–Eta Carinae Treasury Team, especially Kris Davidson and Bish Ishibashi, for their help and guidance with the HST spectra. Brian Cherinka also helped with some of the data processing. FH had valuable discussions about nebular physics with Gary Ferland and Pat Hall. Andrea Mehner contributed recent information, especially for §4.1. Finally, I thank the editors Roberta Humphreys and Kris Davidson for useful comments.References
- (1) Aller, L. H., & Dunham, T.: The Spectrum of Eta Carinae in 1961. ApJ 146, 126-141 (1966)
- (2) Artigau, É, Martin, J. C., Humphreys, R. M., Davidson, K., Chesneau, O., Smith, N.: Penetrating the Homunculus – Near-Infrared Adaptive Optics Images of Eta Carinae. AJ 141, 202 (2011)
- (3) Baldwin, J. A., Ferland, G. J., Korista, K. T., Hamann, F., LaCluyzé, A.: The Origin of Fe II Emission in Active Galactic Nuclei. ApJ 615, 610-624 (2004)
- (4) Bautista, M. A., Gull, T. R., Ishibashi, K., Hartman, H., Davidson, K.: Excitation of Srii lines in Eta Carinae. MNRAS 331, 875-879 (2002)
- (5) Bautista, M. A., Ballance, C., Gull, T. R., Hartman, H., Lodders, K., Martínez, M., Meléndez, M.: Scandium and chromium in the strontium filament in the Homunculus of Carinae. MNRAS 393, 1503-1512 (2009)
- (6) Bautista, M. A., Hartman, H., Gull, T. R., Smith, N., Lodders, K.: [Ti II] and [Ni II] emission from the strontium filament of Carinae. MNRAS 370, 1991-2003 (2006)
- (7) Cardelli, J. A., Clayton, G. C., Mathis, J. S.: The relationship between infrared, optical, and ultraviolet extinction. ApJ 345, 245-256 (1989)
- (8) Carpenter, K. G., Pesce, J. E., Stencel, R. E., Brown, A., Johansson, S., Wing, R. F.: The ultraviolet spectrum of noncoronal late-type stars - The Gamma Crucis (M3.4 III) reference spectrum. ApJS 68, 345-369 (1988)
- (9) Chesneau, O., and 17 colleagues: The sub-arcsecond dusty environment of Eta Carinae. A&A 435, 1043-1061 (2005)
- (10) Corcoran, M.F., Ishibashi, K., Swank, J.H., Petre, R.: The X-Ray Light Curve of Carinae: Refinement of the Orbit and Evidence for Phase-dependent Mass Loss. ApJ 547, 1034–1039 (2001)
- (11) Corcoran, M. F.: X-Ray Monitoring of Carinae: Variations on a Theme. AJ 129, 2018-2025 (2005)
- (12) Dalgarno, A., McCray, R. A.: Heating and Ionization of HI Regions. ARAA 10, 375 (1972)
- (13) Damineli, A.: The 5.52 Year Cycle of Eta Carinae. ApJ 460, L49–52 (1996).
- (14) Damineli, A., Stahl, O., Kaufer, A., Wolf, B., Quast, G., Lopes, D. F.: Long-term spectroscopy of Carinae. I. The high and low excitation phases. A&AS 133, 299-316 (1998)
- (15) Damineli, A., Kaufer, A., Wolf, B., Stahl, O., Lopes, D. F., de Araújo, F. X.: Carinae: Binarity Confirmed. ApJ 528, L101-L104 (2000)
- (16) Damineli, A., Levenhagen, R., Leister, N. V.: The 5.5-yr cycle in Carinae in the last 50 years. In: The Fate of the Most Massive Stars, ASP Conf. Ser. 332, 119 (2005).
- (17) Damineli, A., Hillier, D.J., Corcoran, M.F., et al.: A multispectral view of the periodic events in Carinae. MNRAS 386, 2330–2344 (2008)
- (18) Damineli, A., Hillier, D.J., Corcoran, M.F., et al.: The periodicity of the Carinae events. MNRAS 384, 1649–1656 (2008).
- (19) Davidson, K.: On the Nature of Eta Carinae. Monthly Not. Roy. Astr. Soc., 154, 415-427 (1971)
- (20) Davidson, K., Netzer, H.: The Emission Lines of Quasars and Similar Objects. Revs. Mod. Phys., 51, 715-766 (1979)
- (21) Davidson, K., Dufour, R. J., Walborn, N. R., Gull, T. R.: Ultraviolet and visual wavelength spectroscopy of gas around Carinae. ApJ 305, 867-879 (1986)
- (22) Davidson, K., Ebbets, D., Weigelt, G., et al.: HST/FOS Spectroscopy of Eta Carinae: The Star Itself, and Ejecta within 0.3 arcsec. AJ 109, 1784-1796 (1995)
- (23) Davidson, K., Humphreys, R. M.: Eta Carinae and Its Environment. ARAA 35, 1-32 (1997)
- (24) Davidson, K., Ebbets, D., Johansson, S., et al.: HST/GHRS Observations of the Compact Slow Ejecta of Eta Carinae. AJ 113, 335-345 (1997)
- (25) Davidson, K., Ishibashi, K., Gull, T. R., Humphreys, R. M.: HST/STIS Observations of the Star During its Recent Event. In: ASP Conf. Ser. 179, Eta Carinae at the Millennium, ed. J. A. Morse, R. M. Humphreys, A. Damineli, 227-235 (1999)
- (26) Davidson, K.: Why the Binary Hypothesis Isn’t a Panacea. In: ASP Conf. Ser. 179, Eta Carinae at the Millennium, ed. J. A. Morse, R. M. Humphreys, A. Damineli, 304-315 (1999)
- (27) Davidson, K., Smith, N., Gull, T.R., Ishibashi, K., Hillier, D.J.: The Shape and Orientation of the Homunculus Nebula Based on Spectroscopic Velocities. AJ, 121, 1569-1577 (2001)
- (28) Davidson, K.: Unique Spectroscopic Problems Related to Eta Carinae. In: ASP Conf. Ser. 242, Eta Carinae & Other Mysterious Stars (ed. T. R. Gull, S. Johansson, K. Davidson), 3-13 (2001)
- (29) Davidson, K., et al.: A Change in the Physical State of Carinae?. AJ 129, 900-906 (2005)
- (30) Dorland, B.N., Currie, D.G., Hajian, A.R.: Did Eta Carinae’s Weigelt Blobs Originate Circa 1941? AJ 127, 1052-1058 (2004)
- (31) Dufour, R. J., Glover, T. W., Hester, J. J., et al.: New HST Results on the Outer Nebula of Carinae. In: Luminous Blue Variables: Massive Stars in Transition, ASP Conf. Ser. 120, 255 (1997)
- (32) Duncan, R. A., White, S. M., Lim, J.: Evolution of the radio outburst from the supermassive star Carinae from 1992 to 1996. MNRAS 290, 680-688 (1997)
- (33) Ebbets, D., Garner, H., White, R., et al.: HST images of Carinae. In: Circumstellar Media in Late Stages of Stellar Evolution. 34th Herstmonceux Conf., (Clegg, R.E.S., Stevens, I.R., Meikle, W.P.S., eds.) Cambridge: Cambridge University Press, 95–97 (1994)
- (34) Elitzur, M., Netzer, H.: Line fluorescence in astrophysics. ApJ 291, 464-467 (1985)
- (35) Elitzur, M., Ferland, G. J.: Radiation pressure and emission clouds around active galactic nuclei. ApJ 305, 35-44 (1986).
- (36) Feast, M., Whitelock, P., Marang, F.: Variability of Carinae - III. MNRAS 322, 741-748 (2001)
- (37) Ferland, G., Netzer, H.: Application of line transfer calculations to active nuclei and novae. ApJ 229, 274-290 (1979)
- (38) Gaviola, E.: Eta Carinae. II. The spectrum. ApJ 118, 234-251 (1953)
- (39) Grandi, S. A.: O I 8446 emission in Seyfert 1 galaxies. ApJ 238, 10-16 (1980)
- (40) Gull, T.R., Ishibashi, K.: The Three-Dimensional and Time-Variant Structures of Ejecta Around Eta Carinae as Detected by the STIS. In: ASP Conf. Ser. 242, Eta Carinae & Other Mysterious Stars (ed. T. Gull, S. Johansson, K. Davidson) 59-70 (2001)
- (41) Gull, T.R., Viera, G., Bruhweiler, F., et al.: The Absorption Spectrum of High-Density Stellar Ejecta in the Line of Sight to Carinae. ApJ 620, 442-449. (2005)
- (42) Gull, T.R., Viera Kober, G., & Nielsen, K.E.: Eta Carinae Across the 2003.5 Minimum: The Character and Variability of the Ejecta Absorption in the Near-Ultraviolet. ApJS 163, 173-183 (2006)
- (43) Hall, P. B.: A Quasar with Broad Absorption in the Balmer Lines. AJ 133, 1271-1274 (2007)
- (44) Hamann, F., Persson, S. E.: The similar emission-line spectra of the young star LkH-alpha 101 and the hypergiant MWC 300. ApJS 71, 931-949 (1989)
- (45) Hamann, F., Simon, M.: 7500-9300 A spectroscopy of MWC 349A. ApJ 327, 876-893 (1988)
- (46) Hamann, F., Depoy, D.L., Johansson, S., Elias, J.: High-resolution 6450-24500 Å spectra of Carinae. ApJ 422, 626–641 (1994)
- (47) Hamann, F.: Emission-line studies of young stars. 4: The optical forbidden lines. ApJS 93, 485-518 (1994)
- (48) Hamann, F., Davidson, K., Ishibashi, K., Gull, T. R.: Preliminary Analysis of HST-STIS Spectra of Compact Ejecta from Eta Carinae. In: Eta Carinae at The Millennium, ASP Conf. Ser. 179 (Morse, J. A., Humphreys, R. M., Damineli, A., eds.), 116-122 (1999)
- (49) Hamann, F., and the HST–Eta Carinae Treasury Team: HST Spectroscopy of Eta Car’s Inner Ejecta. In: The Fate of the Most Massive Stars, ASP Conf. Ser. 332 (Humphreys, R.M., Stanek, K. Z., eds.), 283-293 (2005)
- (50) Hartman, H., Damineli, A., Johansson, S., Letokhov, V. S.: Time variations of the narrow Fe II and H I spectral emission lines from the close vicinity of Carinae during the spectral event of 2003. Astr. Astrophys. 436, 945-952 (2005)
- (51) Hartman, H., Gull, T., Johansson, S., Smith, N., HST Eta Carinae Treasury Project Team: Identification of emission lines in the low-ionization strontium filament near Carinae. A&A 419, 215-224 (2004)
- (52) Hartman, H., Johansson, S.: Ultraviolet fluorescence lines of Fe II observed in satellite spectra of the symbiotic star RR Telescopii. Astr. Astrophys. 359, 627-634 (2000).
- (53) Henley, D. B., Corcoran, M. F., Pittard, J. M., et al.: Chandra X-Ray Grating Spectrometry of Carinae near X-Ray Minimum. I. Variability of the Sulfur and Silicon Emission Lines. ApJ 680, 705-727 (2008)
- (54) Hillier, D.J., Allen, D.A.: A spectroscopic investigation of Carinae and the Homunculus Nebula. I - Overview of the spectra. Astr. Astrophys. 262, 153–170 (1992)
- (55) Hillier, D. J., Crowther, P. A., Najarro, F., Fullerton, A. W.: An optical and near-IR spectroscopic study of the extreme P Cygni-type supergiant HDE 316285. Astr. Astrophys. 340, 483-496 (1998)
- (56) Hillier, D. J., Davidson, K., Ishibashi, K., Gull, T.: On the Nature of the Central Source in Carinae. ApJ 553, 837-860 (2001)
- (57) Hillier, D.J., Gull, T., Nielsen, K., et al.: The UV Scattering Halo of the Central Source Associated with Carinae. ApJ 642, 1098–1116 (2006).
- (58) K.-H. Hofmann, G. Weigelt: Speckle masking observation of Carinae. Astr. Astrophys. 203, L21-L22 (1988)
- (59) Humphreys, R.M., Davidson, K., Koppelman, M.: The Early Spectra of Carinae 1892 to 1941 and the Onset of its High Excitation Emission Spectrum. AJ 135, 1249–1263 (2008)
- (60) Hutchings, J.B., Crenshaw, D.M., Kraemer, S.B., et al.: Balmer and He I Absorption in the Nuclear Spectrum of NGC 4151. AJ 124, 2543-2547 (2002)
- (61) Ishibashi, K., Corcoran, M.F., Davidson, K., et al.: Recurrent X-Ray Emission Variations of Carinae and the Binary Hypothesis. ApJ 524, 983–987 (1999)
- (62) Ishibashi, K., Gull, T. R., Davidson, K., et al.: Discovery of a Little Homunculus within the Homunculus Nebula of Carinae. Astronomical Journal 125, 3222-3236 (2003)
- (63) Ishibashi, K.: Historical Eruptions of Eta Carinae: Looking Through the Homunculus. In: ASP Conf. Ser. 332, “The Fate of the Most Massive Stars”, ed. R. Humphreys & K. Stanek (San Francisco, ASP), 131-136 (2005)
- (64) Johansson, S.: New Fe II identifications in the infrared spectrum of Carinae. MNRAS 178, 17P-20P (1977)
- (65) Johansson, S.: Forbidden Transitions of Fe II. Physica Scripta 15, 183- (1977)
- (66) Johansson, S.: Strong Fe II fluorescence lines in RR Tel and V1016 CYG excited by D IV in a Bowen mechanism. MNRAS 205, 71P-75P (1983)
- (67) Johansson, S., Jordan, C.: Selective excitation of Fe II in the laboratory and late-type stellar atmospheres MNRAS 210, 239-256 (1984)
- (68) Johansson, S., Hamann, F.W.: Fluorescence lines in ultraviolet spectra of stars. Physica Scripta T47, 157- (1993)
- (69) Johansson, S., Wallerstein, G., Gilroy, K.K., Joueizadeh, A.: Fluorescence lines of MnII in the red spectrum of Carinae. Astr. Astrophys. 300, 521-524 (1995)
- (70) Johansson, S., Leckrone, D. S., Davidson, K.: The Impact of GHRS on Atomic Physics - A Fruitful Collaboration Between Laboratory and Stellar Spectroscopy. In: The Scientific Impact of the Goddard High Resolution Spectrograph, ASP Conf. Ser. 143 (ed. Brandt, J.C., Ake, T.B., Petersen, C.C.), 155- (1998)
- (71) Johansson, S., Zethson, T.: Atomic Physics Aspects on Previously and Newly Identified Iron Lines in the HST Spectrum of Carinae. In: Eta Carinae at The Millennium, ASP Conf. Ser. 179 (ed. J.A. Morse, R.M. Humphreys, A. Damineli), 171-183 (1999)
- (72) Johansson, S., Zethson, T., Hartman, H., et al.: New forbidden and fluorescent Fe III lines identified in HST spectra of Carinae. Astr. Astrophys. 361, 977-981 (2000)
- (73) Johansson, S., Letokhov, V.S.: Astrophysical lasers operating in optical Fe II lines in stellar ejecta of Carinae. Astr. Astrophys. 428, 497-509 (2004)
- (74) Johansson, S., Gull, T.R., Hartman, H., Letokhov, V.S.: Metastable hydrogen absorption in ejecta close to Carinae. Astr. Astrophys. 435, 183-189 (2005)
- (75) Martin, J.C., Koppelman, M.D.: Carinae’s Brightness Variations Since 1998: Hubble Space Telescope Observations of the Central Star. AJ 127, 2352–2361 (2004)
- (76) Martin, J. C., Davidson, K., Humphreys, R. M., Hillier, D. J., & Ishibashi, K. 2006. On the He II Emission in Eta Carinae and the Origin of its Spectroscopic Events. ApJ, 640, 474-490.
- (77) Martin, J.C., Davidson, K., Koppelman, M.D.: The Chrysalis Opens? Photometry from the Carinae Hubble Space Telescope Treasury Project, 2002-2006. AJ 132, 2717–2728 (2006)
- (78) Mehner, A., Davidson, K., Ferland, G.J., Humphreys, R.M.: High-excitation Emission Lines Near Carinae. ApJ 710, 729-742 (2010)
- (79) Mehner, A., Davidson, K., Humphreys, R. M.: A sea change in Carinae. ApJ 717, L22-L25 (2010)
- (80) Mehner, A., Davidson, K., Martin, J. C., et al.: Critical Differences and Clues in Eta Car’s 2009 Event. ApJ 740, 2 (2011)
- (81) Morse, J.A., Davidson, K., Bally, J., et al.: Hubble Space Telescope Wide Field Planetary Camera 2 Observations of Carinae. AJ. 116, 2443-2461 (1998)
- (82) Netzer, H., Wills, B.J.: Broad emission features in QSOs and active galactic nuclei. I - New calculations of Fe II line strengths. ApJ 275, 445-460 (1983)
- (83) Nielsen, K.E., Ivarsson, S., Gull, T.R. Eta Carinae across the 2003.5 Minimum: Deciphering the Spectrum toward Weigelt D. ApJS 168, 289-296 (2007)
- (84) Osterbrock, D.E., Ferland, G.J.: Astrophysics of gaseous nebulae and active galactic nuclei, 2nd. ed. Sausalito, California: University Science Books (2006)
- (85) Penston, M.V., Benvenuti, P., Cassatella, A.: IUE and other new observations of the slow nova RR Tel. Mon. Not. Roy. Astr. Soc. 202, 833-857 (1983)
- (86) Pittard, J.M., Corcoran, M.F.: In Hot Pursuit of the Hidden Companion of Carinae: An X-ray Determination of the Wind Parameters. Astr. Astrophys. 383, 636-647 (2002)
- (87) Richardson, N. D., Gies, D. R., Henry, T. J., Fernández-Lajás, E., Okazaki, A. T.: The H Variations of Carinae During the 2009.0 Spectroscopic Event. AJ 139, 1534-1541 (2010)
- (88) Rudy, R.J., Mazuk, S., Puetter, R.C., Hamann, F.: The 1 Micron Fe II Lines of the Seyfert Galaxy I Zw 1. ApJ 539, 166-171 (2000)
- (89) Savage, B.D., Sembach, K.R.: Interstellar Abundances from Absorption-Line Observations with the Hubble Space Telescope. Ann. Rev. Astr. Astrophys. 34, 279-330 (1996)
- (90) Sigut, T.A.A., Pradhan, A.K.: Ly Flourescent Excitation of Fe II in Active Galactic Nuclei. ApJ 499, L139-L142 (1998)
- (91) Smith, N., Davidson, K., Gull, T.R., Ishibashi, K., Hillier, D.J.: Latitude-Dependent Effects in the Stellar Wind of Carinae. ApJ, 586, 432-450 (2003)
- (92) Smith, N., Gehrz, R.D., Hinz, P.M., et al.: Mass and Kinetic Energy of the Homunculus Nebula Around Carinae. AJ 125, 1458-1466 (2003)
- (93) Smith, N., Morse, J.A., Gull, T.R., et al.: Kinematics and Ultraviolet to Infrared Morphology of the Inner Homunculus of Carinae. al. 2004a, ApJ 605, 405-424 (2004)
- (94) Smith, N., Morse, J.A.:, Nitrogen and Oxygen Abundance Variations in the Outer Ejecta of Carinae: Evidence for Recent Chemical Enrichment. ApJ 605, 854-863 (2004)
- (95) Smith, N., Morse, J.A., Collins, N.R., Gull, T.R.: The Purple Haze of Carinae: Binary Induced Variability? ApJ 610, L105-L108 (2004)
- (96) Smith, N., Morse, J.A., Bally, J.: The [O III] Veil: Astropause of Carinae’s Wind? AJ 130, 1778-1783 (2005)
- (97) Stahl, O., Weis, K., Bomans, D.J., et al.: A spectroscopic event of Car viewed from different directions: The data and first results. Astr. Astrophys. 435, 303-312 (2005)
- (98) Thackeray, A.D.: Identifications in the spectra of Carinae and RR Telescopii. MNRAS 113, 211-236 (1953)
- (99) Verner, E.M., Verner, D.A., Korista, K.T., et al.: Numerical Simulations of Fe II Emission Spectra. ApJS 120, 101-112 (1999)
- (100) Verner, E.M., Verner, D.A., Baldwin, J.A., Ferland, G.J., Martin, P.G.: Continuum Pumping of [Fe II] in the Orion Nebula. ApJ 543, 831-839 (2000)
- (101) Verner, E.M., Gull, T.R., Bruhweiler, F., et al.: The Origin of Fe II and [Fe II] Emission Lines in the 4000-10000 Å Range in the BD Weigelt Blobs of Carinae. ApJ 581, 1154-1167 (2002)
- (102) Verner, E., Bruhweiler, F., Gull, T.: The Binarity of Carinae Revealed from Photoionization Modeling of the Spectral Variability of the Weigelt Blobs B and D. ApJ 624, 973-982 (2005)
- (103) Viotti, R., Rossi, L., Cassatella, A., Altamore, A., Baratta, G.B.: The ultraviolet spectrum of Carinae. ApJS 71, 983-1009 (1989)
- (104) Viotti, R., Rossi, C., Baratta, G.B.: Self-Absorption Curve Analysis of [Fe II] and Fe II Emission Lines of Carinae. In: Eta Carinae at the Millennium, ASP Conf. Ser. 179 (ed. Morse, J.A., Humphreys, R.M., Damineli, A.) 184-191 (1999)
- (105) Wallerstein, G., Gilroy, K.K., Zethson, T., Johansson, S., Hamann, F.: Line Identifications in the Spectrum of Carinae as Observed in 1990-1991 with CCD Detectors. PASP 113, 1210-1214 (2001)
- (106) G. Weigelt, J. Ebersberger: Eta Carinae resolved by speckle interferometry. Astr. Astrophys. 163, L5-L6 (1986)
- (107) G. Weigelt, R. Albrecht, C. Barbieri, et al.: HST FOC Observations of Eta Carinae. In: The Eta Carinae Region: A Laboratory of Stellar Evolution, Revista Mexicana de Astronomia y Astrofisica Serie de Conferencias, Vol. 2 (ed. Niemela, V., Morrell, N., Feinstein, A.), 11-16 (1995)
- (108) Weis, K., Duschl, W.J.: The LBV Nebula around Car and Its Remarkable Features. In: Eta Carinae at The Millennium, ASP Conf. Ser. 179 (ed. Morse, J.A., Humphreys, R.M., Damineli, A.) 155-158 (1999)
- (109) Whitelock, P.A., Feast, M.W., Koen, C., Roberts, G., Carter, B.S.: Variability of Carinae. MNRAS 270, 364-372 (1994)
- (110) Wills, B.J., Netzer, H., Wills, D.: Broad emission features in QSOs and active galactic nuclei. II - New observations and theory of Fe II and H I emission. ApJ 288, 94-116 (1985)
- (111) Zanella, R., Wolf, B., Stahl, O.: Spectroscopy of the shell episode of Car, 1981-1983. Astr. Astrophys. 137, 79-84 (1984)
- (112) Zethson, T., Johansson, S., Davidson, K., et al.: Strange velocities in the equatorial ejecta of Carinae. Astr. Astrophys. 344, 211-220 (1999)
- (113) Zethson, T., Gull, T.R., Hartman, H., et al.: Sr II and [Sr II] Emission in the Ejecta of Carinae. Astronomical J. 122, 322-326 (2001)
- (114) Zethson, T., Hartman, H., Johansson, S., et al.: Cr II Fluorescence in Carinae due to H Lyman Alpha Pumping. In: Eta Carinae and Other Mysterious Stars: The Hidden Opportunities of Emission Spectroscopy, ASP Conf. Ser. 242 (ed. Gull, T. Johansson, S., Davidson, K.) 97-101 (2001)