2SRON Netherlands Institute for Space Research, P.O. Box 800, 9700 AV Groningen, The Netherlands
3Max Planck Institute for Extraterrestrial Physics, Giessenbachstrasse 1, 85748 Garching, Germany
11email: bast@strw.leidenuniv.nl
Exploring organic chemistry in planet-forming zones
Abstract
Over the last few years, the chemistry of molecules other than CO in the planet-forming zones of disks is starting to be explored with Spitzer and high-resolution ground-based data. However, these studies have focused only on a few simple molecules. The aim of this study is to put observational constraints on the presence of more complex organic and sulfur-bearing molecules predicted to be abundant in chemical models of disks and to simulate high resolution spectra in view of future missions. High Spitzer spectra at 10–30 m of the near edge-on disks IRS 46 and GV Tau are used to search for mid-infrared absorption bands of various molecules. These disks are good laboratories because absorption studies do not suffer from low line/continuum ratios that plague emission data. Simple LTE slab models are used to infer column densities and excitation temperatures for detected lines and upper limits for non-detections. Mid-infrared bands of HCN, C2H2 and CO2 are clearly detected toward both sources. As found previously for IRS 46 by Lahuis et al. (2006), the HCN and C2H2 absorption arises in warm gas with excitation temperatures of 400–700 K, whereas the CO2 absorption originates in cooler gas of 250 K. Absolute column densities and their ratios are comparable for the two sources. No other absorption features are detected at the 3 level. Column density limits of the majority of molecules predicted to be abundant in the inner disk — C2H4, C2H6, C6H6, C3H4, C4H2, CH3, HNC, HC3N, CH3CN, NH3 and SO2— are determined and compared with disk models. Simulations are also performed for future higher spectral resolution instruments. The inferred abundance ratios and limits with respect to C2H2 and HCN are roughly consistent with models of the chemistry in high temperature gas. Models of UV irradiated disk surfaces generally agree better with the data than pure X-ray models. The limit on NH3/HCN implies that evaporation of NH3-containing ices is only a minor contributor. The inferred abundances and their limits also compare well with those found in comets, suggesting that part of the cometary material may derive from warm inner disk gas. The high resolution simulations show that future instruments on JWST, ELTs, SOFIA and SPICA can probe up to an order of magnitude lower abundance ratios and put important new constraints on the models, especially if pushed to high ratios.
Key Words.:
Protoplanetary disks – Astrochemistry – ISM: molecules – Line: profiles – Planets and satellites: formation1 Introduction
The chemical composition of the gas in the inner regions of circumstellar disks plays an important role in determining the eventual composition of the comets and atmospheres of any planets that may form from that gas (see reviews by Prinn 1993; Ehrenfreund & Charnley 2000; Markwick & Charnley 2004; Bergin 2011). In the last few years, observations with the Spitzer Space Telescope have revealed a rich chemistry in the inner few AU of disks around low-mass stars, containing high abundances of HCN, C2H2, CO2, H2O and OH (Lahuis et al. 2006; Carr & Najita 2008; Salyk et al. 2008; Pascucci et al. 2009; Carr & Najita 2011; Kruger et al. 2011; Najita et al. 2010; Pontoppidan et al. 2010; Salyk et al. 2011). Spectrally and spatially resolved data of CO using ground-based infrared telescopes at 4.7 m show that the warm molecular gas is indeed associated with the disk (e.g., Najita et al. 2003; Brittain et al. 2003, 2007, 2009; Blake & Boogert 2004; Pontoppidan et al. 2008; Salyk et al. 2011b; Brown et al. subm.), with in some cases an additional contribution from a disk wind (Bast et al. 2011; Pontoppidan et al. 2011). Spectrally resolved ground-based observations have also been obtained of OH and H2O at 3 m (Carr et al. 2004; Mandell et al. 2008; Salyk et al. 2008; Fedele et al. 2011), and most recently of HCN and C2H2 (Gibb et al. 2007; Doppmann et al. 2008; Mandell et al. 2012). All of these data testify to the presence of an active high-temperature chemistry in the upper layers of disks that drives the formation of OH, H2O and small organic molecules. However, it is currently not known whether this gas contains more complex organic molecules which may eventually become part of exoplanetary atmospheres.
Observations of large interstellar molecules are usually carried out using (sub-)millimeter telescopes. A wide variety of complex organic species have been found in low- and high-mass protostars at the stage when the source is still embedded in a dense envelope (see Herbst & van Dishoeck 2009, for review). For disks, the pure rotational lines of CO, H2O, HCO+, H2CO, HCN, N2H+, CN, C2H, SO, DCO+ and DCN have been reported but more complex molecules have not yet been detected (e.g., Dutrey et al. 1997; Kastner et al. 1997; Thi et al. 2004; Fuente et al. 2010; Henning et al. 2010; Öberg et al. 2011; Hogerheijde et al. 2011). Although these millimeter data have the advantage that they do not suffer from dust extinction and can thus probe down to the midplane, current facilities are only sensitive to the cooler gas in the outer disk (AU). Even the Atacama Large Millimeter/submillimeter Array (ALMA) with its much improved spatial resolution and sensitivity can only readily image molecules at 5 AU or larger in the nearest disks. Moreover, ALMA cannot detect molecules without a permanent dipole moment such as C2H2 and CH4, which are among the most abundant species in the inner disk. Results so far show that there is no clear correlation between the chemistry in the inner and outer parts of the disk (Öberg et al. 2011). The chemistry in the inner regions seems to be sensitive to different shapes of radiation fields and the accretion luminosities (Pascucci et al. 2009; Pontoppidan et al. 2010), but these quantities do not seem to have an impact on the chemical composition of the colder gas further out in the disk.
Searches for more complex molecules in the inner few AU must therefore rely on infrared techniques. However, the strong mid-infrared continuum implies very low line/continuum ratios for emission lines, even at high spectral resolution. Indeed, the recent VLT-CRIRES () searches in the 3 m atmospheric window show that lines of molecules other than CO have line/continuum ratios of typically only a few %, and that even relatively simple species like CH4 are not detected at the 1% level (Mandell et al. 2012). On the other hand, absorption lines offer a much better chance of detecting minor species for a variety of reasons. First, absorption occurs from the ground vibrational level where the bulk of the population resides, so that the signal is much less sensitive to temperature. Another advantage is that absorption lines are relative in strength to the continuum whereas emission lines are absolute. So the strength of the absorption lines relative to the continuum will stay the same in sources which have a stronger continuum whereas the emission lines will be dominated by the continuum. Both these advantages imply that absorption lines are easier to detect for less abundant molecular species than emission lines.
Detection of absorption lines requires, however, a special orientation of the disk close to edge-on, so that the line of sight to the continuum passes through the inner disk. Only a few disks have so far been found with such a favorable geometry: that around Oph-IRS46 (Lahuis et al. 2006), GV Tau N (Gibb et al. 2007; Doppmann et al. 2008) and DG Tau B (Kruger et al. 2011). In all cases, the mid-infrared absorption bands of HCN, C2H2 and CO2 have depths of 5–15%, even at the low spectral resolution of Spitzer. For high spectra, detection of absorption features of order 1% should be feasible, providing a dynamic range of up to an order of magnitude in abundances to search for other molecules. With increased spectral resolution and sensitivity offered by future mid-infrared instruments such JWST-MIRI (3000), and SOFIA, SPICA and ELTs (), another order of dynamic range will be opened up.
A large variety of increasingly sophisticated physico-chemical models of the inner regions of disks exist (e.g., Willacy et al. 1998; Aikawa et al. 1999; Markwick et al. 2002; Nomura et al. 2007; Agúndez et al. 2008; Gorti & Hollenbach 2008; Glassgold et al. 2009; Nomura et al. 2009; Willacy & Woods 2009; Woitke et al. 2009; Kamp et al. 2010; Walsh et al. 2010; Aresu et al. 2011; Gorti et al. 2011; Heinzeller et al. 2011; Najita et al. 2011; Vasyunin et al. 2011; Walsh et al. 2012). The models differ in their treatments of radiation fields (UV and/or X-rays), the gas heating and resulting disk structure, dynamical processes such as accretion flows and disk winds, grain properties and chemical networks (e.g., grain opacities, treatment of gas-grain chemistry including H2 formation at high temperature). Some models consider only the simplest molecules in the chemistry, others have a large chemical network but publish primarily results for species that can be observed at millimeter wavelengths. Only Markwick et al. (2002) list the most abundant species, including complex molecules that do not have a dipole moment, at 1, 5 and 10 AU as obtained from vertically integrated column densities. Since infrared observations probe only part of the disk down to where the continuum becomes optically thick, these models may not be representative of the surface layers. Column densities appropriate for comparison with infrared data have been presented by Agúndez et al. (2008) and Najita et al. (2011) but do not provide data for more complex molecules. Woods & Willacy (2007) and Kress et al. (2010) consider PAH processing in the inner disk and study its impact on the abundances of related species like benzene and C2H2. Note that PAHs are generally not detected in disks around T Tauri stars, including the two disks studied here, at levels a factor of 10–100 lower than found in the interstellar medium (Geers et al. 2006; Oliveira et al. 2010).
Observations of molecules in comets provide another interesting data set for comparison with protoplanetary disks. Solar system comets were likely formed at distances of about 5–30 AU in the protosolar nebula. Many volatile molecules are now routinely observed in cometary atmospheres at infrared and millimeter wavelengths, including species as complex as C2H6, CH3OH, and even (CH2OH)2 (see Mumma & Charnley 2011; Bockelée-Morvan 2011, for reviews). It is still debated whether the abundances measured in comets directly reflect those found in the dense envelopes around protostars or whether they result from processing and mixing material from the inner and outer disk into the comet-forming zone. Putting constraints on the inner disk abundances of these molecules will be important to probe the evolution of material from the natal protosolar nebula to the formation of icy bodies.
In this study we use the existing high Spitzer spectra of IRS 46 and GV Tau to put, for the first time, upper limits on various molecules in the inner disk: HNC, CH3, C2H4, C2H6, C3H4, HC3N, C6H6, NH3, C4H2, CH3CN, H2S and SO2. These molecules were selected to include most of the top 15 highest vertical column density molecules at 1 and 5 AU by Markwick et al. (2002). The selected species can in principle directly test the predictions of models of inner disk chemistry. The list also contains several molecules observed in cometary atmospheres and two more molecules with a permanent dipole moment, HNC and HC3N, which together with HCN can be observed at both infrared and millimeter wavelengths and can thus be used to connect the inner and outer disk chemistries through ALMA imaging.
The mid-infrared spectra of IRS 46 and GV Tau contain detections of C2H2, CO2 and HCN which are analyzed here in terms of column densities and abundances, following the same strategy as for IRS 46 in Lahuis et al. (2007). The earlier detections of HCN and C2H2 toward GV Tau were performed in the 3 m window with higher spectral resolution (Gibb et al. 2007) but no Spitzer results have yet been presented on this source. We have reduced the GV Tau spectrum and rereduced the IRS 46 spectrum with the latest IRS pipeline in order to allow for a consistent comparison between the two sources. For the same reason, we have also reanalyzed the IRS 46 spectrum using the same analysis software.
A description of the observations and the reduction of the data for IRS 46 and GV Tau is presented in Section 2 together with some information about these two protoplanetary disks. Section 3.1 presents an overview of the observed and modeled spectra, whereas 3.2 uses a synthetic local thermodynamic equilibrium (LTE) model to estimate column densities and excitation temperatures for HCN, C2H2 and CO2 toward GV Tau and compares the results with those for IRS 46. Section 3.3 presents the upper limits for the various molecules toward the two sources and Section 3.4 shows how future instruments can provide more stringent limits. Discussion and comparison to chemical models is performed in Section 4. A summary of the main conclusions is found in Section 5.
2 Observations
2.1 IRS 46 and GV Tau
The observations of IRS 46 and GV Tau were made using Spitzer-IRS in both the Short-High (SH; m) and Long-High (LH; m) modes with a spectral resolving power of .
Oph-IRS 46 was observed at and (J2000), located in the Ophiuchus molecular cloud at a distance of around 120 pc (Loinard et al. 2008). IRS 46 was initially observed in 2004 as part of the Cores to Disks Spitzer legacy program (Evans et al. 2003) and in 2008 and 2009 at multiple epochs to search for variability. Its mid-infrared spectral energy distribution rises strongly with wavelength, as expected for a near edge-on disk (Crapsi et al. 2008). Strong HCN, C2H2 and CO2 absorption has been detected with Spitzer and attributed to arise from warm gas in the surface layers of the inner few AU of the disk, seen in absorption against the continuum produced by the hot inner rim on the near and far side of the star (Lahuis et al. 2006). Lahuis et al. (2011, and in prep.) show that hot water emission lines are also detected. More interestingly, strong variation in the depth of the molecular absorption bands as well as in the strength of the water emission lines and the mid-IR contiuum is observed on timescales of a few years. The data used here are the original observations obtained on August 29, 2004 as part of AOR# 0009829888 and published by Lahuis et al. (2006). These show the deepest molecular absorptions, thus providing the best upper limits of column densities of other species relative to the observed C2H2, HCN and CO2 column densities.
GV Tau is a T Tauri star that is partly embedded in the L1524 molecular cloud. Its observations were positioned at and (J2000). It has an infrared companion about 1.2 to the north. The companion is named GV Tau N and the primary optical source is called GV Tau S. Gibb et al. (2007) detected HCN and C2H2 toward GV Tau N using Keck-NIRSPEC at L-band, however, no such detections were made toward GV Tau S. GV Tau has subsequently been observed using the IRS SH mode at multiple epochs with Spitzer in a GO4 program (PI, F.Lahuis; program ID 50532). For the SH part of the spectrum the GO4 data (AOR # 0022351616, 0028247808, 0028247552 and 0031618304) were used. For the LH part, data from the Spitzer GTO program observed on 2 March 2004 as part of AOR # 0003531008 were adopted. Note that the Spitzer-IRS aperture does not resolve the GV Tau binary, in contrast to NIRSPEC. The Spitzer spectra therefore combine emission and absorption of GV Tau N and GV Tau S. Both GV Tau N and GV Tau S are variable at 2 m (Leinert et al. 2001; Koresko et al. 1999). This variability has been attributed to variable accretion mechanisms for GV Tau N and variation in the extinction due to inhomogeneities in the circumstellar material for GV Tau S (Leinert et al. 2001). However, the multi-epoch Spitzer data do not show significant mid-infrared variation on timescales of a few months up to a few years, in contrast with the near-IR ground-based results and with IRS 46. The mid-IR continuum of GV Tau N is about an order of magnitude brighter than the continuum of GV Tau S between m (Przygodda 2004; Roccatagliata et al. 2011). Since no absorption was seen in GV Tau S in Gibb et al. (2007) and Doppmann et al. (2008) it is assumed that the majority of the absorption arises toward GV Tau N. However, the continuum emission from the southern source captured in the Spitzer-IRS aperture slightly reduces the total optical depth of the absorption lines in the spectrum. To put an upper limit on the added uncertainty caused by the additional continuum emission from GV Tau S, it is assumed that the mid-IR continuum of GV Tau N is times stronger than that of GV Tau S, resulting in an additional uncertainty of % for features that are % deep. Since the effect is minor, no correction is made for the column densities derived here.
2.2 Data reduction
The data reduction started with the BCD (Basic Calibrated Data) images from the Spitzer archive processed through S18 pipeline. The BCD images were then processed using the Cores to Disks (c2d) analysis pipeline (Lahuis et al. 2006b; Kessler-Silacci et al. 2006). The main processing steps are background correction, bad-pixel removal, spectral extraction, defringing, order matching and spectral averaging. Two extraction methods were used; 1) a full aperture extraction from the BCD images and 2) an optimal extraction using an analytical psf (Lahuis et al. 2007) defined using a set of high calibration stars. For both extractions a relative spectral response function (RSRF) calibration is applied with Dra as the main reference star using MARCS models taken from the Spitzer science center (Decin et al. 2004).
For all observations the extraction method giving the best was used to produce the final spectra. The two (partly) independent extraction methods further allow to better discriminate between artifacts and true science features.
3 Results
3.1 Spectra
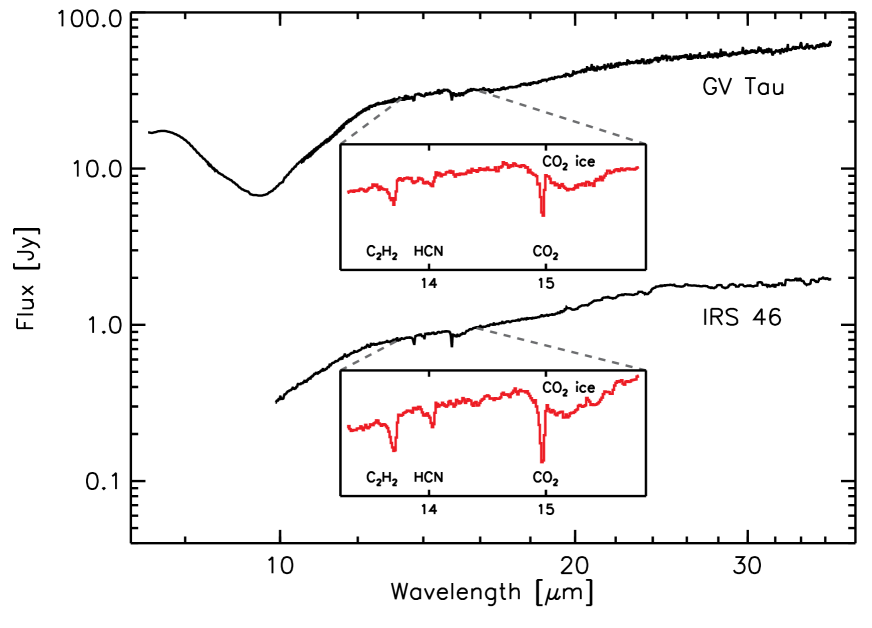
Figure 1 shows the spectra of IRS 46 and GV Tau over the m region. Both spectra differ by more than an order of magnitude in the mid-IR continuum level, but they show a striking resemblance in spectral shape and spectral features. The absorption bands of gaseous C2H2 , HCN and CO2 can be clearly seen at 13.7, 14.0 and 15.0 m, together with the solid CO2 feature at m. To search for other molecules, a local continuum has been fitted to the broad spectral features and divided out. The on the continuum is typically 100 or better. No other obvious absorption features are detected at the few % absorption level. The model spectra with derived column densities and upper limits are described below.
3.2 C2H2, HCN and CO2
To extract quantitative information from the spectra, a simple local thermodynamical equilibrium (LTE) absorption slab model has been used to fit the data. The free parameters in the model are the excitation temperature, the integrated column density along the line of sight and the intrinsic line width, characterized by the Doppler -value. The excitation temperature sets the level populations of the molecule using the Boltzmann distribution. The lack of collisional rate coefficients for many of the species considered here prevents non-LTE analyses. The model spectrum is convolved with the spectral resolution of the instrument and resampled to the observed spectra. More details about the model and the molecular parameters and data that are used for the three detected molecules can be found in Lahuis & van Dishoeck (2000); Lahuis et al. (2007); Boonman et al. (2003) and in Table 1.
| Molecule | Formula | Band |
111Central wavenumber of band and band strengths from Constants for molecules of
astropysical interest in the gas phase by J. Crovisier
http://wwwusr.obspm.fr/crovisie/basemole/ |
a | 222Band strength of the simulated spectra. , (see App. A.1 Helmich 1996). Calculations were performed for K, km s-1 and cm-2 at a resolution of 3000 to keep all bands far from saturation | Source333H08: HITRAN 2008 (Rothman et al. 2009), G09: GEISA 2009 (Jacquinet-Husson et al. 2011) and FPH: Helmich (1996) |
| [cm-1] | [atm-1 cm-2] | [atm-1 cm-2] | ||||
| Acetylene | C2H2 | CH bending | 729.1 | 630 | 816 | H08 |
| Carbon Dioxide | CO2 | bending | 667.4 | 200 | 249 | H08 |
| Hydrogen Cyanide | HCN | bending | 713.5 | 257 | 286 | H08 |
| Hydrogen Isocyanide | HNC | bending | 464.2 | 1570 | 798 | G09 |
| Methyl Radical | CH3 | out-of-plane bending | 606.5 | 611 | 616 | FPH |
| Ethylene | C2H4 | CH2 waggling | 949.2 | 324 | 320 | G09 |
| Ammonia | NH3 | symmetric bendng | 950.0 | 568 | 614 | H08 |
| Sulphur Dioxide | SO2 | bending | 517.6 | 113 | 97 | G09 |
| Ethane | C2H6 | CH3 rocking | 822.0 | 36 | 29 | H08 |
| Diacetylene / Butadiyne | C4H2 | CH bending | 627.9 | 437 | 229 | G09 |
| Benzene | C6H6 | CH bending | 673.5 | 250 | 212 | G09 |
| Propyne / Methyl Acetylene | C3H4 | CH bending | 638.6 | 360 | 201 | G09 |
| Cyanoacetylene / Propynenitrile | HC3N | 663.4 | 278 | 94 | G09 | |
| Methyl Cyanide / Acetonitrile | CH3CN | CC stretch | 920.3 | 6 | 3 | G09 |
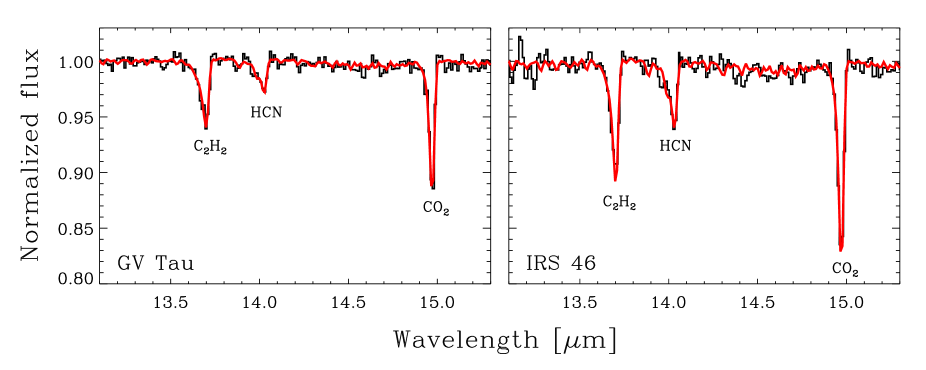
Figure 2 presents a blow-up of the m range of the GV Tau and IRS 46 spectra with the continuum divided out. Included are the best-fitting model spectra. The figure clearly shows that the - and -branch lines are difficult to detect at the Spitzer-IRS spectral resolution of , however the -branches of C2H2, HCN and CO2 are easily seen. In addition the -branch changes its form and depth with excitation temperature and column density. In particular, the depth of the -branch decreases with increased excitation temperature for the same total column density and broadens to the blue side due to an increase in the population of the higher rotational levels. A higher column density on the other hand increases the central depth of the -branch since more molecules absorb photons. As can be seen in Lahuis & van Dishoeck (2000) the -branch is sensitive to the adopted Doppler -value with the magnitude of the effect depending on the temperature and column density. Spectrally resolved data obtained with Keck-NIRSPEC (Salyk et al. 2011b; Lahuis et al. 2006) and within our VLT-CRIRES survey (Pontoppidan et al. 2011; Brown et al. subm.) show that the HCN and CO lines have km s-1. In our analysis we therefore adopt a Doppler -value of 10 km s-1. Lahuis et al. (2006) used =5 km s-1 for IRS 46 which gives slightly increased temperatures and reduced column densities by %.
| Temperature [K] | Column density [1016 cm-2] | |||
|---|---|---|---|---|
| Source | IRS 46 | GV Tau | IRS 46 | GV Tau |
| C2H2 | 2.1 0.4 | 1.4 0.3 | ||
| HCN | 3.7 0.8 | 1.8 0.4 | ||
| CO2 | 8.4 1.1 | 5.1 0.7 | ||
A grid of synthetic spectra of C2H2, HCN and CO2 was made for a range of column densities and temperatures and fitted to the data obtained for IRS 46 and GV Tau. The best fit as presented in Fig. 2 was determined by finding the minimum difference between data and model as measured by the values. The derived column densities and excitation temperatures for the different molecules are summarized in Table 2. For IRS 46, the values are consistent with those of Lahuis et al. (2006) taking into account that a higher value was adopted and that the final spectrum presented in this paper has a slightly higher ratio compared to Lahuis et al. (2006). It is seen that the temperatures of the different molecules and their column density ratios are comparable between GV Tau and IRS 46. This supports the hypotheses that both sources are inclined disks with similar characteristics. In both sources CO2 has the highest column density but the lowest temperature, whereas the HCN/C2H2 ratio is slightly above unity. In their 2 – 5 m study, Gibb et al. (2007) however find significantly lower temperatures for C2H2 (170 20 K) and HCN (115 20 K) compared to our estimated temperatures of about 400 to 700 K. However in later Keck-NIRSPEC L-band observations, Doppmann et al. (2008) and Gibb & Troutman (2011) detect lines out to much higher values, indicating warmer gas around 500 K. Our mid-infrared results are therefore not inconsistent with the near-IR data.
The high resolution near-IR data for IRS 46 and GV Tau N show that the spectral lines are shifted in velocity. For IRS46, CO and HCN are blueshifted by about 24 km s?1 with respect to the cloud (Lahuis et al. 2006) whereas for GV Tau the HCN lines are redshifted by about 13 km s-1 compared with the star (Doppmann et al. 2008). This could indicate that the observed HCN, C2H2 and CO2 absorption originates in a disk wind or infalling envelope rather than the disk itself. However, the high densities needed to excite these higher -transitions as well as the constraints on the size of the high abundance region (11 AU) imply that the absorption lines have an origin in outflowing or infalling gas that must be very closely related to the disk itself with a chemistry similar to that of the disk. This is further discussed in Lahuis et al. (2006); Gibb et al. (2007); Doppmann et al. (2008); Kruger et al. (2011) and Mandell et al. (2012). Fuente et al. (2012) recently imaged the warm HCN associated with the disk of GV Tau N at millimeter wavelengths and found an emitting radius of less than 12 AU.
3.3 Other molecules
3.3.1 Overview and molecular data
Table 1 summarizes the molecular data (vibrational mode, line positions, band strengths) used for all molecules for which searches have been made toward IRS 46 and GV Tau in the 10–30 m wavelength range, together with the main references from which they have been extracted. Only the intrinsically strongest bands of each molecule have been chosen; weaker bands are ignored. Note that isotopologues and vibrationally excited states or ‘hot bands’ are not included in the data sets, except in the fitting of the observed spectra of HCN, CO2 and C2H2. Hot bands are expected to be suppressed in full non-LTE calculations, where the excitation of the higher vibrational levels is subthermal at densities below cm-3. Synthetic spectra are generated following the procedures as described in Helmich (1996) and Lahuis & van Dishoeck (2000).
Our spectra use molecular data from various databases listed in Table 1. To assess their reliability, we have computed the integrated absorption band strengths of the simulated spectra and compared them with independent band strengths tabulated in the literature (columns 5 and 6 of Table 1). This table shows that the band strengths of all species agree to within factor of and in most cases much better. For the purpose of this paper this accuracy is sufficient and differences between databases and other literature values are not pursued here. It should be noted, however, that there are (sometimes significant) differences between line lists and not all line lists are complete.

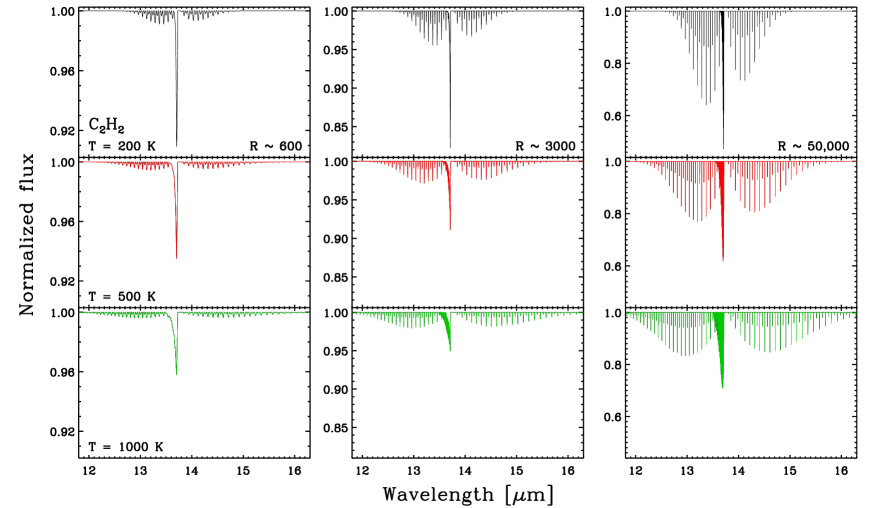
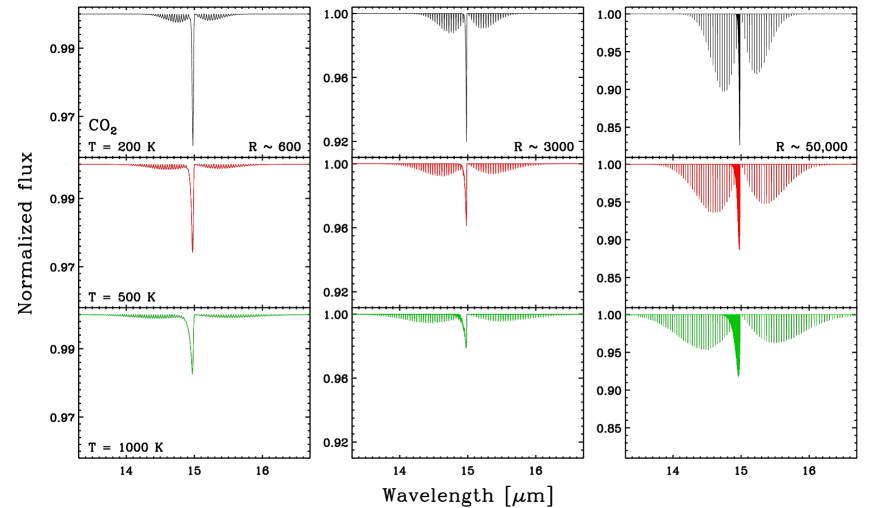
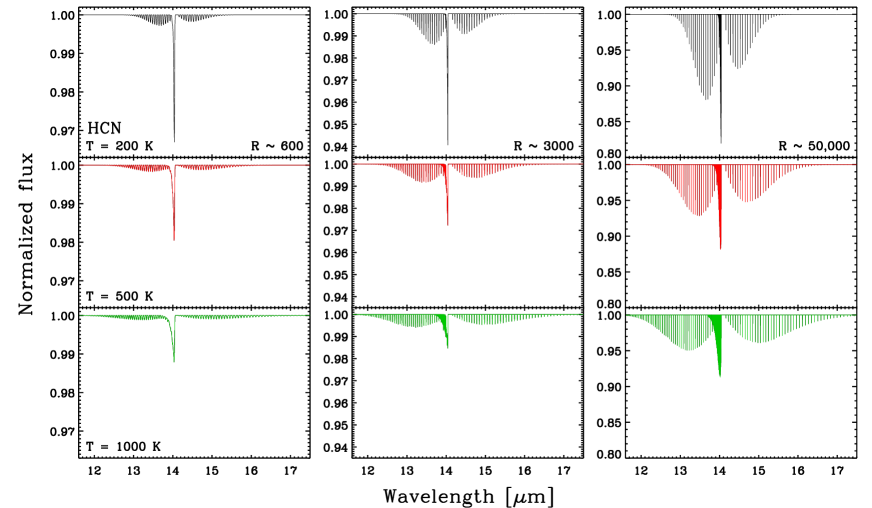
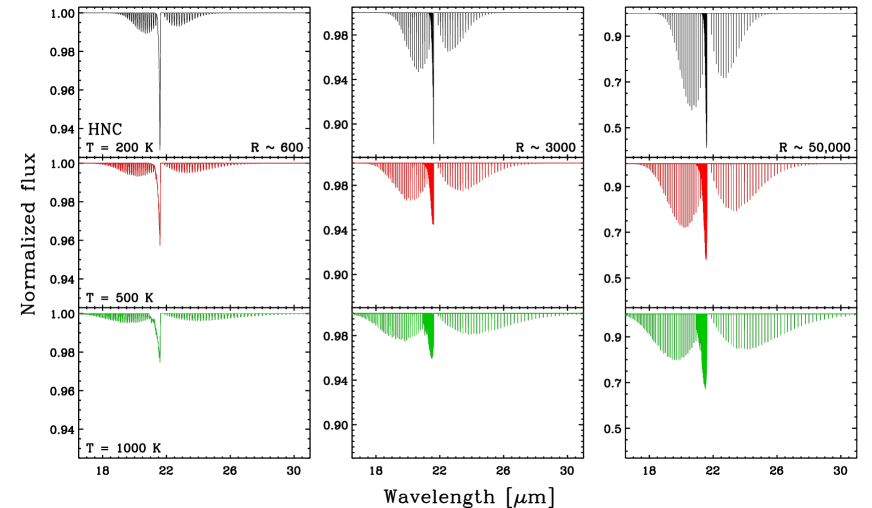
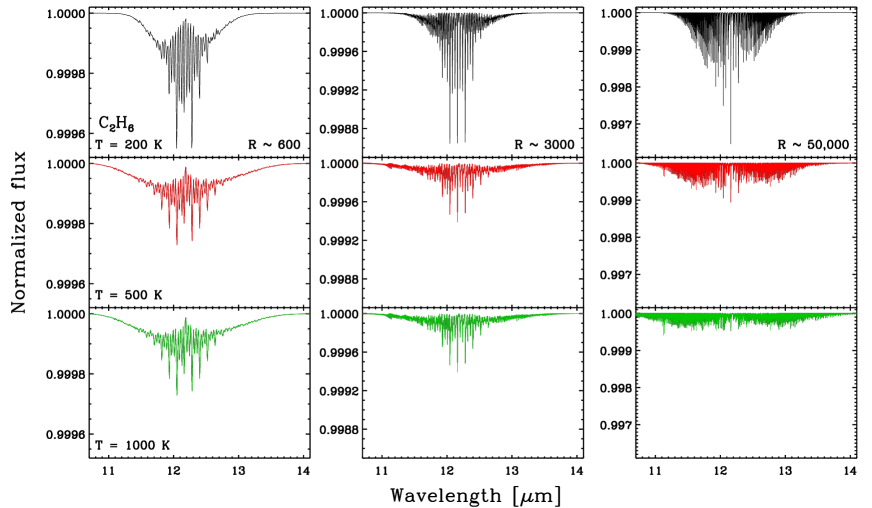
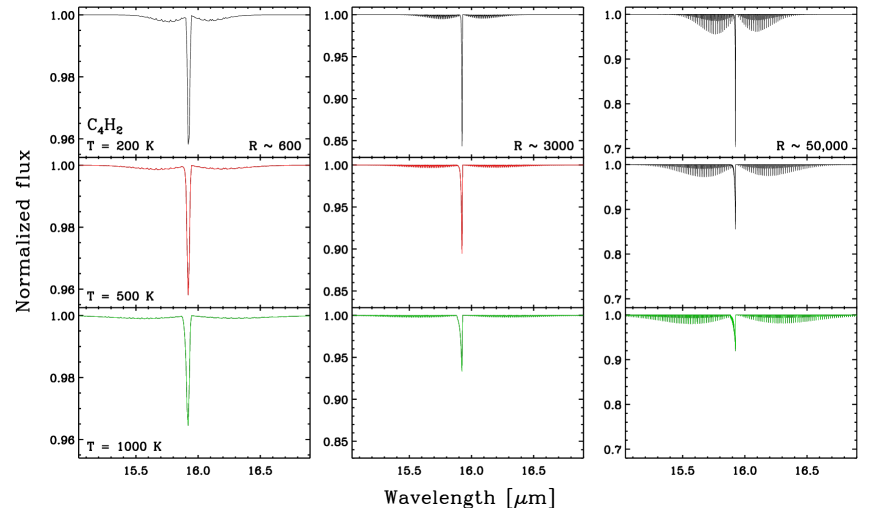
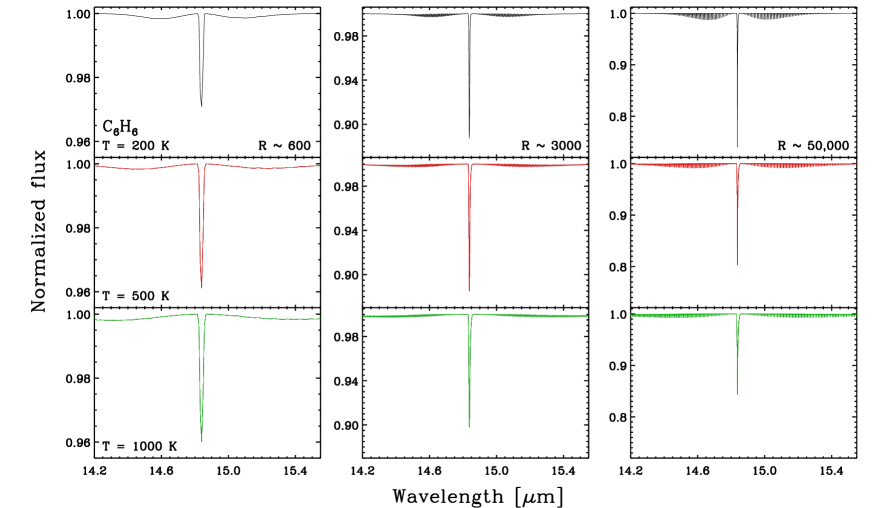
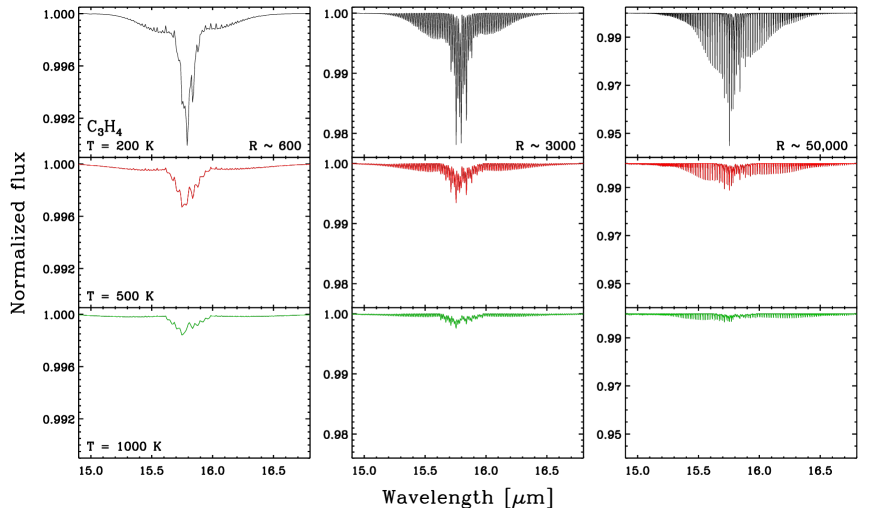
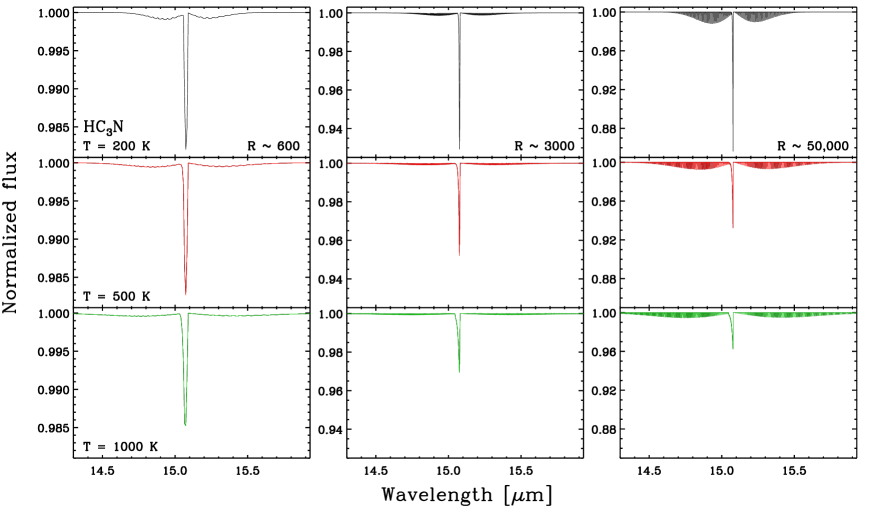
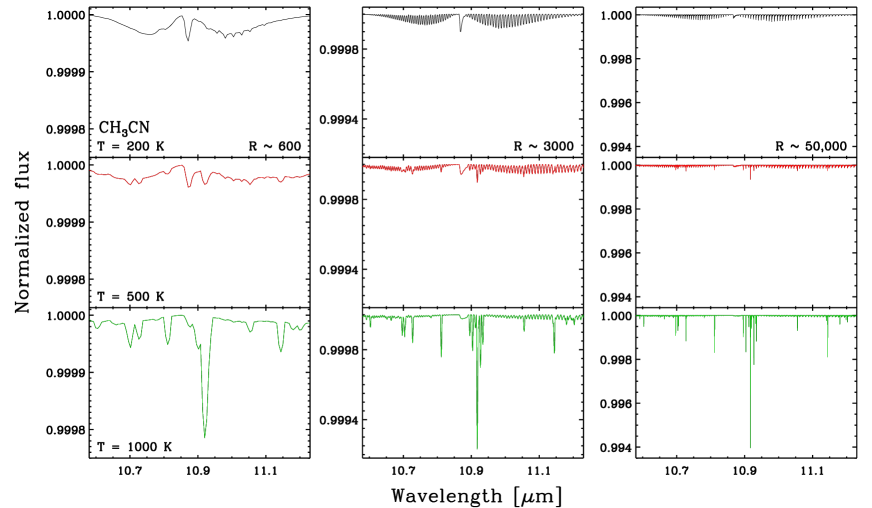
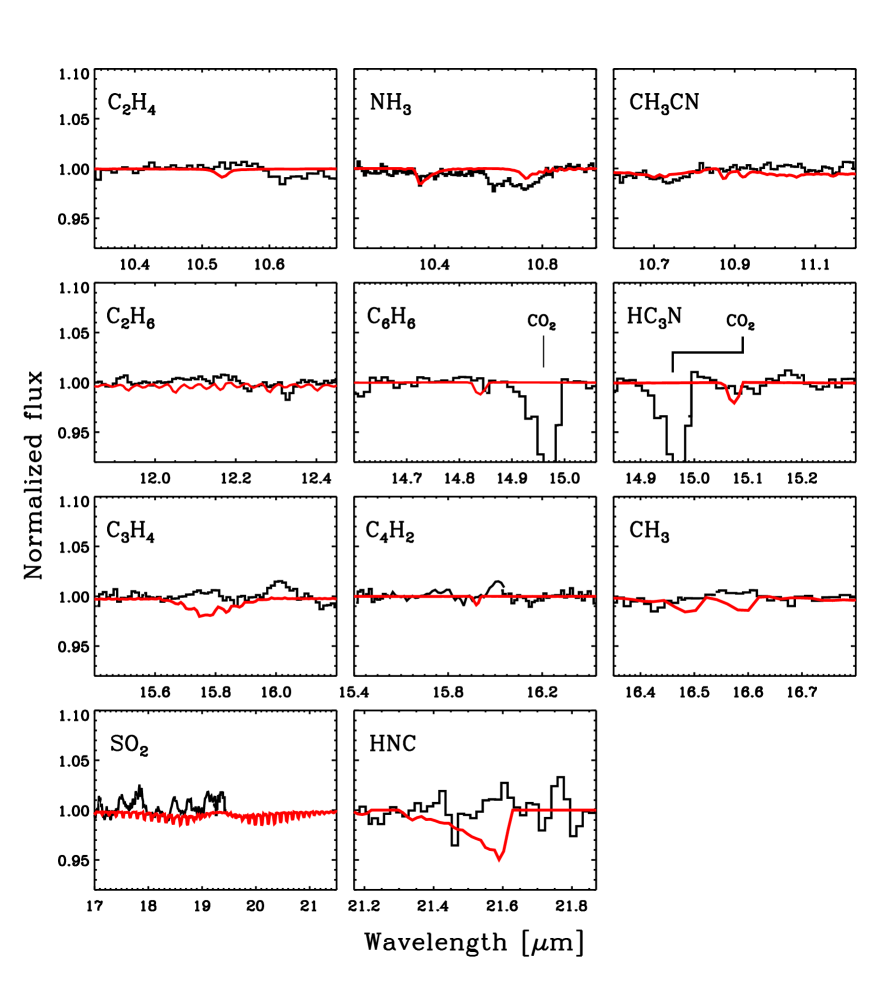
Figure 3 presents an overview of the simulated LTE spectra for all molecules considered here at K, and a column density of 1.1016 cm-2. A variety of absorption patterns is seen, depending on the characteristics and symmetries of the individual bands involved. Together, they span most of the wavelength range observed by Spitzer.
3.3.2 Upper limits from Spitzer data
For all species without detections upper limits were derived from the local normalized spectrum based on the rms noise over a region of 10 resolution elements. The definition of the continuum determines the derived rms noise and therefore the upper limits. To be conservative, the local continuum was defined by a straight line fit to clean regions either side of the spectral feature. The upper limit on the column density was taken to be the value for which the synthetic spectrum has a feature depth of 3. Examples for the case of GV Tau are presented in Fig. 4. For some species, e.g. CH3CN, the model lies below the continuum in the zoomed-in region presented in Fig. 4 due to blending of weak - and -branch lines at the Spitzer resolution. Over the wider wavelength range on which the continuum and model are defined both reach unity.
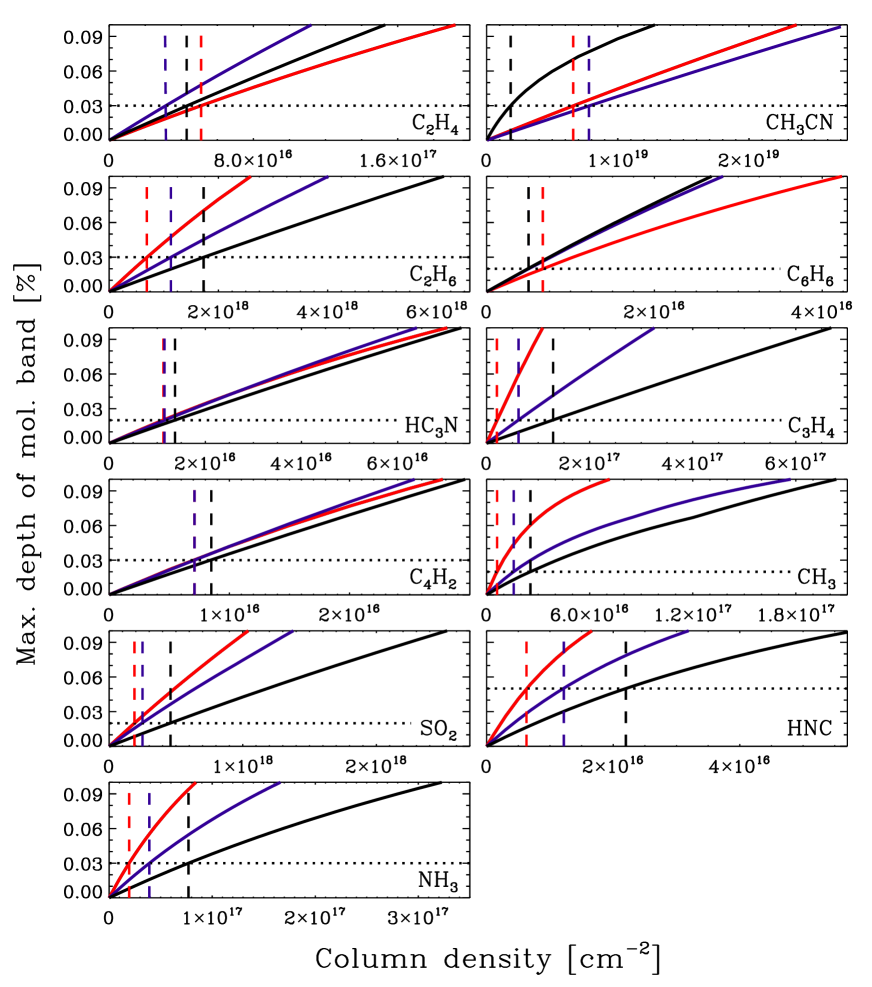
The depth of a molecular feature depends on the column density, the temperature and the adopted Doppler parameter . In general, the features become stronger with increasing column density and decreasing temperature. For high column densities, the transitions become optically thick and the corresponding absorption lines saturate. The absorption depth then no longer increases linearly with column depth, with the saturation being stronger for smaller values.
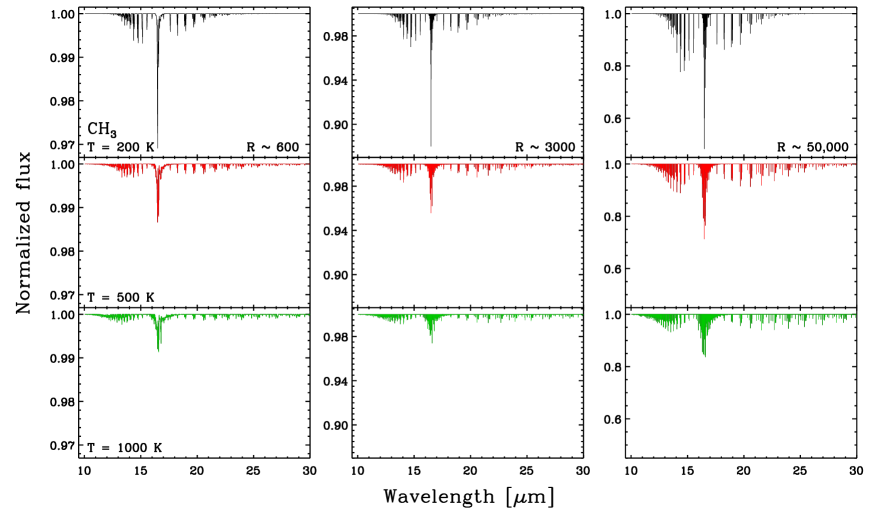
Fig. 5 shows how the relative intensity of the spectral features change with temperature and column density for each molecule at the Spitzer resolution and km s-1 (we adopt a moderately low value for to illustrate the effects of saturation). The effect of saturation is clearly seen in some of the spectra, e.g. CH3 at 200 K, where the curves deviate from linear at higher column densities. For reference, Figures 9 – 22 in the Appendix present an overview of the simulated LTE spectra at for all molecules considered here at additional temperatures of 200 and 1000 K. Not all molecules follow the expected trend of depth versus column density and temperature. This can be explained when looking in detail at the different spectra. For example, HNC follows the expected trend of decreasing depth with increasing temperature (Fig. 12), but not C6H6 (Fig. 19). The latter behavior is due to the low spectral resolving power which does not resolve the intrinsically narrow branch of this heavy molecule. At higher resolving power, however, the strength of -branch does in fact decrease with higher temperature as expected.
Fig. 5 includes the 3 absorption depth limits for IRS 46 as dotted lines and the corresponding upper limits on the column densities for 200, 500 and 1000 K as dashed lines. Saturation is not significant for any of the molecules so we can adopt these upper limits for IRS 46 and GV Tau to compare with C2H2 and HCN derived with km s-1. The derived 3 upper limits on the column densities are presented in Table 3 and 4.
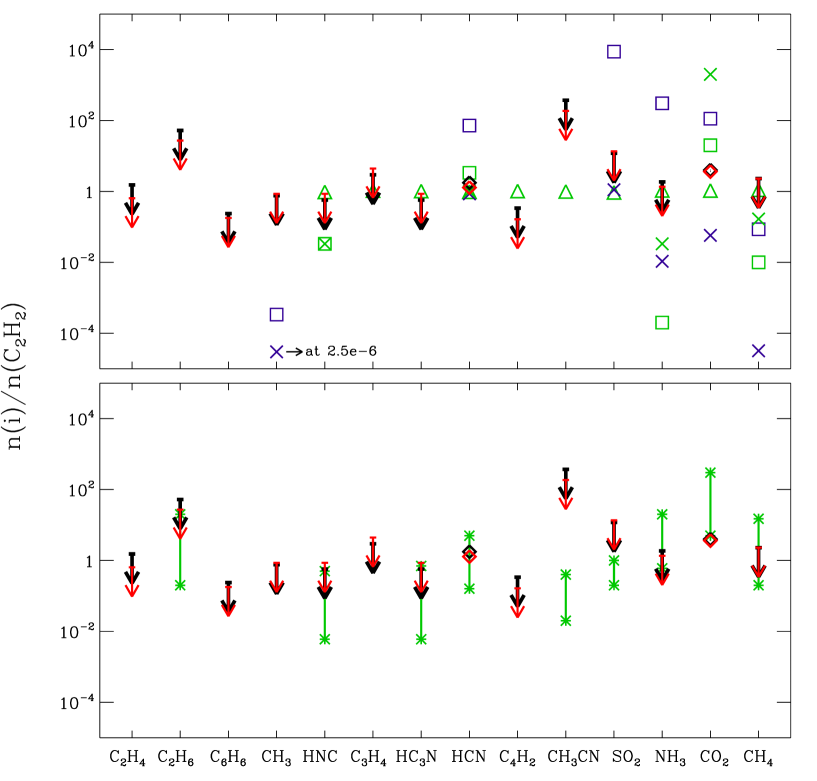
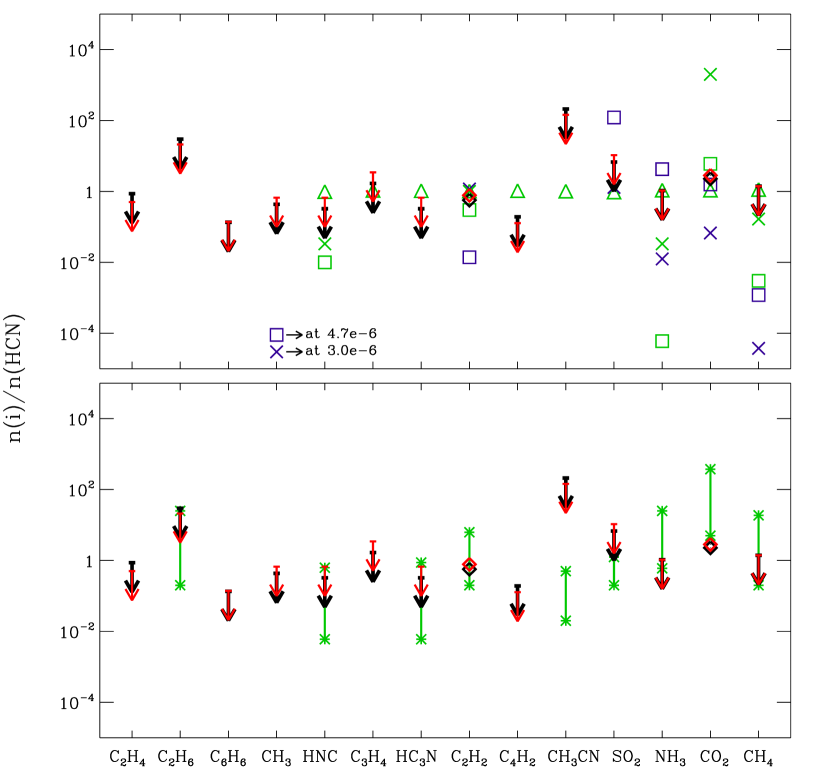
Tables 5 and 6 present the upper limits on the column densities relative to C2H2 and HCN, respectively, for both IRS 46 and GV Tau. Abundance ratios relative to C2H2 and HCN are typically of order unity, except for CH3CN and C2H6 which have particularly low band strengths (see Table 1). The most stringent ratios of are obtained for C4H2 and C6H6. The ratios are also graphically displayed in Figures 6 and 7 where they are compared with model results. These results will be further discussed in §4.
3.4 High resolution spectra
Figures 9, 10 and 11 in the Appendix present C2H2, HCN and CO2 absorption spectra at higher spectral resolution for , as appropriate for the JWST-MIRI instrument, and at , as typical for future mid-infrared spectrometers on an Extremely Large Telescope (ELT). The latter spectrum is also characteristic (within a factor of 2) of the spectral resolution of of EXES on SOFIA (Richter et al. 2006) or a potential high resolution spectrometer on the SPICA mission (Goicoechea & Nakagawa 2011). As expected, the central branch becomes deeper with higher spectral resolution and the and -branches become readily detectable, allowing a more accurate model fit to the data. The inferred column density from such data should not change beyond the error bars derived from the low resolution data, however.
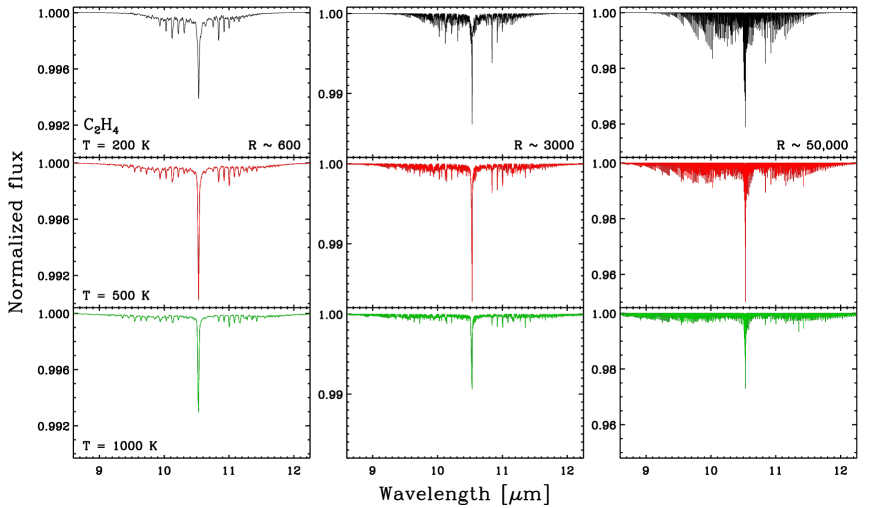
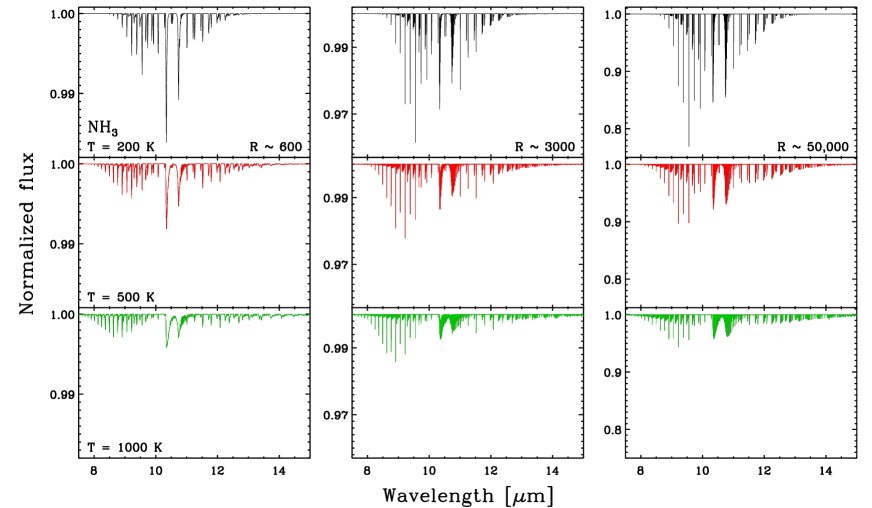
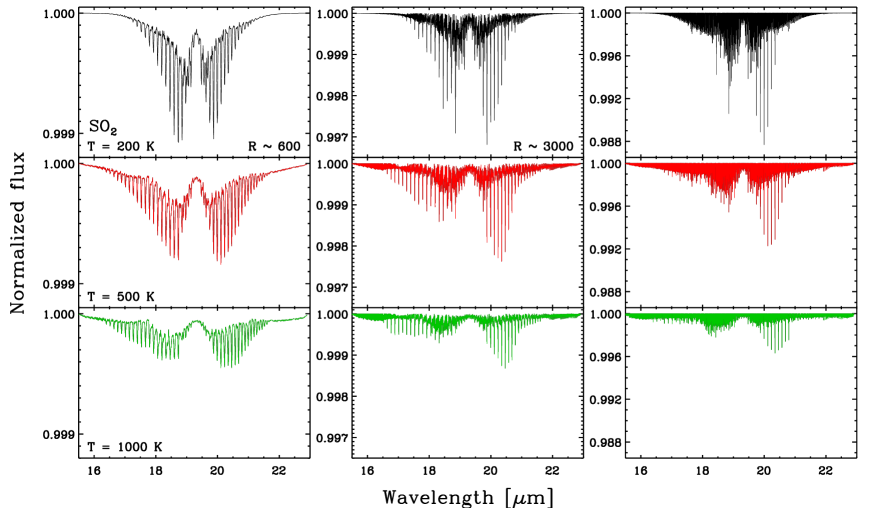
Figures 12 – 20 present the higher resolution spectra of all other molecules at =3000 and 50,000 at and 1000 K using km s-1 and a column density of 1.1016 cm-2. The improved detectability of the molecules at higher spectral resolution is obvious. To illustrate the improvements compared with the current Spitzer-IRS observations, the upper limits for the high resolution cases are included in Table 3 for IRS 46 assuming the same S/N values. For GV Tau, the limits at higher resolution scale similarly. The column density limits are lower by factors of 2–10. They do not decrease linearly with increasing resolving power, however, because the strong branches used to set the limits are blends of many lines at low resolution which become separated at higher resolving power. In some cases (C2H6, CH3CN), the gain is very small because the molecule absorbs less than 0.1% of the continuum for the adopted column density, which remains undetectable at =100 even at high spectral resolution.
Tables 5 and 6 include the column density ratios with respect to C2H2 and HCN at higher resolving power. Since the C2H2 and HCN column densities remain the same, the abundance ratio limits are now up to an order of magnitude lower, thus bringing the limits in a more interesting regime where they provide more stringent tests of chemical models. To push the abundance ratios even lower, a higher than 100 on the continuum is needed.
Note that these limits do not take the transmission of the Earth’s atmosphere into account but assume that the strong -branches can be observed unobscured. For ground-based instruments and to a lesser extent SOFIA, this is often not the case and detectability depends both on the transmission and on the radial velocity shifts of the sources with respect to atmospheric lines (Lacy et al. 1989). For JWST, the better stability of a space-based platform as well as the large mirror and the absence of telluric absorption bring significantly higher S/N ratios than 100 within reach once the instrument performance is well characterized in orbit.
| C2H4 | C2H6 | C6H6 | CH3 | HNC | C3H4 | |
| =600, 200 K | 5.1 | 69 | 0.7 | 0.6 | 0.6 | 2.0 |
| 500 K | 3.2 | 110 | 0.5 | 1.6 | 1.2 | 6.2 |
| 1000 K | 4.3 | 170 | 0.5 | 2.6 | 2.2 | 13 |
| =3000, 500 K444Upper limits at spectral resolving powers of and 50,000 at K adopting , similar to the current Spitzer-IRS data at lower spectral resolution. | 1.8 | 50 | 0.2 | 0.4 | 0.9 | 3.1 |
| =50,000, 500 Ka | 0.6 | 29 | 0.09 | 0.06 | 0.09 | 1.8 |
| 3 [%]555The 3 limit in % absorption at the location of the molecular band as measured in the Spitzer-IRS data. | 3 | 3 | 2 | 2 | 5 | 2 |
| HC3N | C4H2 | CH3CN | SO2 | NH3 | ||
| =600, 200 K | 1.1 | 0.7 | 660 | 19 | 2.0 | |
| 500 K | 1.2 | 0.7 | 780 | 25 | 3.9 | |
| 1000 K | 1.4 | 0.9 | 180 | 46 | 7.7 | |
| R = 3000, 500 K | 0.4 | 0.3 | 310 | 8.5 | 1.4 | |
| R = 50,000, 500 K | 0.3 | 0.2 | 46 | 2.6 | 0.3 | |
| 3 [%] | 2 | 3 | 3 | 2 | 3 |
| C2H4 | C2H6 | C6H6 | CH3 | HNC | C3H4 | |
| 200 K | 1.2 | 23 | 0.3 | 0.4 | 0.6 | 2.0 |
| 500 K | 0.9 | 38 | 0.3 | 1.2 | 1.2 | 6.2 |
| 1000 K | 0.9 | 57 | 0.3 | 1.8 | 2.2 | 13 |
| 3 [%] 666The actual 3 limit in % absorption at the location of the molecular band. | 1 | 1 | 1 | 1.5 | 5 | 2 |
| HC3N | C4H2 | CH3CN | SO2 | NH3 | ||
| 200 K | 1.1 | 0.2 | 230 | 14 | 0.9 | |
| 500 K | 1.2 | 0.2 | 260 | 19 | 1.9 | |
| 1000 K | 1.4 | 0.3 | 50 | 34 | 3.7 | |
| 3 [%] | 2 | 1 | 1 | 1.5 | 1.5 |
| Ratio rel to C2H2 | C2H4 | C2H6 | C6H6 | CH3 | HNC | C3H4 | HC3N | CH4 |
| IRS 46 | 1.5 | 52 | 0.2 | 0.8 | 0.6 | 3.0 | 0.6 | - |
| GV Tau | 0.6 | 27 | 0.2 | 0.9 | 0.9 | 4.4 | 0.9 | - |
| DR Tau | - | - | - | - | - | - | - | 2.3777From 3 m emission data (Mandell et al. 2012). |
| 888The =3000 and 50,000 values refer to the 3 limits on the abundance ratios that can be obtained toward IRS 46 if observed at higher spectral resolution at a similar S/N. | 0.9 | 24 | 0.08 | 0.2 | 0.4 | 1.5 | 0.2 | - |
| 0.3 | 14 | 0.04 | 0.03 | 0.04 | 0.9 | 0.1 | - | |
| Markwick et al. (2002) 1 AU | - | - | - | 1.0 | 1.0 | 1.0 | 1.0 | 1.1 |
| Markwick et al. (2002) 5 AU | - | - | - | - | 1.0 | 1.0 | 1.0 | 1.1 |
| Najita et al. (2011) ref | - | - | - | 4.0E-4 | - | - | - | 0.09 |
| Najita et al. (2011) O/C = 1.0 | - | - | - | 2.5E-6 | - | - | - | 3.2E-5 |
| Agúndez et al. (2008) 1 AU | - | - | - | - | 0.03 | - | - | 0.01 |
| Agúndez et al. (2008) 3 AU | - | - | - | - | 0.03 | - | - | 0.2 |
| Mumma & Charnley (2011) | - | 0.2–20 | - | - | 0.01–0.5 | - | 0.01–0.7 | 0.2–15 |
| Ratio rel to C2H2 | HCN | C4H2 | CH3CN | SO2 | NH3 | CO2 | ||
| IRS 46 | 1.8 | 0.3 | 370 | 11.9 | 1.9 | 4.0 | ||
| GV Tau | 1.3 | 0.2 | 190 | 13.6 | 1.4 | 3.6 | ||
| DR Tau | - | - | - | - | - | - | ||
| - | 0.1 | 150 | 4.0 | 0.7 | - | |||
| - | 0.1 | 22 | 1.2 | 0.1 | - | |||
| Markwick et al. (2002) 1 AU | 1.0 | 1.0 | 1.0 | 0.9 | 1.0 | 1.0 | ||
| Markwick et al. (2002) 5 AU | 1.0 | 1.0 | 1.0 | 0.9 | 1.1 | 1.1 | ||
| Najita et al. (2011) ref | 70 | - | - | 8700 | 310 | 110 | ||
| Najita et al. (2011) O/C = 1.0 | 0.9 | - | - | 1.1 | 0.01 | 0.06 | ||
| Agúndez et al. (2008) 1 AU | 3.0 | - | - | - | 2.0E-4 | 20 | ||
| Agúndez et al. (2008) 3 AU | 1.0 | - | - | - | 0.03 | 2000 | ||
| Mumma & Charnley (2011) | 0.2–5.0 | - | 0.02–0.4 | 0.2–1.0 | 0.6–20 | 5.0–300 |
| Obs/models | HNC | HC3N | CH3CN | NH3 | CH3CN/NH3 |
|---|---|---|---|---|---|
| IRS 46 | 0.3 | 0.3 | 210 | 1.1 | 200 |
| GV Tau | 0.7 | 0.7 | 140 | 1.1 | 140 |
| AS 205 | - | - | - | 2.7999From 3 m emission (Mandell et al. 2012). | - |
| 101010The =3000 and 50,000 values refer to the 3 limits on the abundance ratios that can be obtained toward IRS 46 if observed at higher spectral resolution at a similar S/N. | 0.2 | 0.1 | 84 | 0.4 | - |
| 0.03 | 0.08 | 12 | 0.08 | - | |
| Markwick et al. (2002) at 1 AU | 1.0 | 1.0 | 1.0 | 1.0 | 1.0 |
| Markwick et al. (2002) at 5 AU | 1.0 | 1.0 | 1.0 | 1.1 | 0.9 |
| Najita et al. (2011) ref | - | - | 4.0 | - | - |
| Najita et al. (2011) O/C = 1.0 | - | - | 0.01 | - | - |
| Agúndez et al. (2008) 1 AU | 0.01 | - | - | 6.0e-5 | - |
| Agúndez et al. (2008) 3 AU | 0.03 | - | - | 0.03 | - |
| Mumma & Charnley (2011) | 0.01–0.6 | 0.01–0.9 | 0.02–0.5 | 0.6–25 | 0.01–0.1 |
| Garrod et al. (2008) M | - | - | - | 890 | 7.5E-5 |
4 Discussion
Tables 5 and 6 and Figures 6 and 7 compare our limits with a variety of chemical models. There are two distinct routes towards molecular complexity in regions of star- and planet formation. First, at elevated temperatures such as found in the inner disks, various reactions with activation barriers open up. If atomic carbon can be liberated from CO and atomic nitrogen from N2, high abundances of CH4, C2H2 and HCN can be produced. The second route starts in the pre-stellar cores where ices are formed through grain surface reactions. At a later stage, these ices can be transported into the disk and evaporate so that a chemistry rich in hydrogenated molecules can ensue. We review each of these classes of models and then discuss our observations in the light of these models and in comparison with cometary and other data.
4.1 Warm chemistry
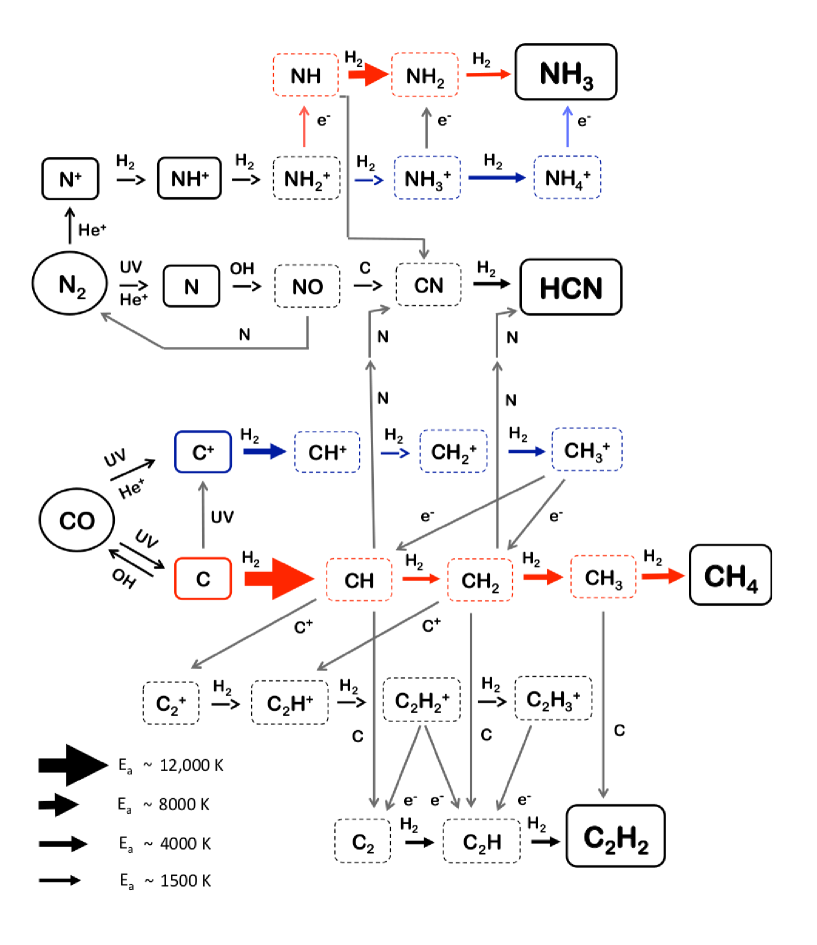
The warm gas chemistry in the photospheres of disks follows a similar chemical scheme as that in other interstellar regions with high temperature gas such as the inner envelopes of massive protostars (e.g., Lahuis & van Dishoeck 2000; Doty et al. 2002; Rodgers & Charnley 2003; Stäuber et al. 2005), high density photodissociation regions (PDRs) (e.g., Sternberg & Dalgarno 1995) and shocks (e.g., Mitchell 1984; Pineau des Forêts et al. 1987; Viti et al. 2011). The chemical scheme starts with separating C or C+ from CO and N from N2, see Fig. 8 (adapted from Agúndez et al. 2008). This can be done either by UV photons, cosmic rays or X-rays. A UV-dominated region will produce comparable amounts of C+ and C, whereas cosmic rays and X-rays produce He+ which will react with CO to produce primarily C+.
For carbon-bearing species, the rate limiting steps of this scheme are the reactions of C and C+ with H2 which have activation barriers of 12,000 and 4,000 K, respectively. At temperatures of a few hundred K, the C+ channel leads to CH4 and C2H2 while at high temperatures (800 K), the C-channel becomes active. Reactions of C2 with H2 have activation barriers of 1500 K and form another route to produce C2H and subsequently C2H2. For nitrogen-bearing species, the reactions of NH with H2 ( K) to form NH3 and of CN with H2 ( K) to form HCN also require high temperatures. At low temperatures K, the above reactions are closed and C+, C and N will be driven back to CO and N2 through reactions involving OH. Hence, the higher the temperature the more C2H2, CH4 and HCN will be produced. Since the temperature decreases with disk radius, the abundances of C2H2, CH4 and HCN show a strong radial dependence with a steep decrease beyond 1 AU (Agúndez et al. 2008).
Similar arguments apply to the more complex hydrocarbons studied here. In fact, high temperature, high density chemistry starting with high abundances of C2H2 and HCN resembles the chemistry of the atmospheres of carbon-rich evolved stars, which has been studied for decades (e.g., Cherchneff & Glassgold 1993; Millar & Herbst 1994). For example, C2H2 reacts with CH3 produce C3H4, with C2H to C4H2, and with NH3 to CH3CN. If C2H is sufficiently abundant (due to photodissociation of C2H2, for example), subsequent reactions may lead to large unsaturated carbon chains. More saturated molecules such as C2H4 and C2H6 need CH4 as their starting point. Finally, nitrogen-containing species are produced by reactions of HCN or N with hydrocarbons. For example, C2H2 and C2H react with HCN to form HC3N. It is now well established that many of these neutral-neutral reactions actually have substantial rates even at low temperatures (100 K) (Smith 2011). Thus, the bottleneck in producing the more complex organic molecules is the formation of the chemical precursors C2H2, HCN and CH4. The more complex molecules are thus also expected to show a strong dependence on disk radius.
Benzene is the most complex molecule probed here and is a precursor for building larger PAHs. One route to form benzene is through the reaction of C3H4 and its ion, found to be important in the inner disk chemistry in some models (Woods & Willacy 2007). Alternatively, the destruction of PAHs by high temperature gas-phase reactions inside the ‘soot line’ can lead to the production of small hydrocarbons, including C2H2 and perhaps C6H6 (Kress et al. 2010).
CO2 is the product of the reaction of OH with CO. Models show that all atomic O is driven into H2O at temperatures above 230 K if there are no rapid H2O destruction routes (e.g., Draine et al. 1983; Charnley 1997). The formation of OH also needs elevated temperatures, but peaks in the 100–200 K range because of the rapid reactions of OH with H2 to form H2O at higher temperatures. In warm gas, the CO2 abundance follows that of OH and also peaks at 100–200 K, with a strong decrease toward higher temperatures. Thus, in contrast with C2H2 and HCN, the abundance of CO2 increases somewhat beyond 1 AU in disk models, until the temperature falls below 100 K (Agúndez et al. 2008).
Another parameter that can affect the chemistry is the O/C ratio in the gas. There have been suggestions that this ratio changes with disk radius due to migration of icy planetesimals containing a large fraction of the oxygen (Ciesla & Cuzzi 2006). Hydrocarbon abundances are very sensitive to the O/C ratio (Langer & Graedel 1989; Bettens et al. 1995; Najita et al. 2011). As expected, oxygen-bearing species such as H2O and O2 decrease dramatically in abundance when O/C is less than 1 because all volatile oxygen (rather than all carbon) is locked up in CO. Pure carbon species such as C2H2 increase in abundance by orders of magnitude while nitrogen species only change appreciably when they contain C (e.g., HCN). Since both IRS 46 and GV Tau show large columns of gaseous CO2, the lines of sight through the disks probed by the mid-infrared data must pass through gas with O/C.
Finally, the overall gas/dust ratio can play a role (e.g., Najita et al. 2011; Bruderer et al. 2012). However, comparison of the CO column density with the extinction measured from the silicate optical depth shows that this ratio is close to the interstellar value for both IRS 46 and GV Tau, indicating no significant grain growth and settling along the lines of sight through these disks (Kruger et al. 2011).
In §A in the Appendix, more detailed descriptions of a few specific protoplanetary disk models are given, focussing on the simpler species which can be compared with observations.
4.2 Surface chemistry
The more complex organic molecules such as dimethyl ether seen toward protostars are the product of an active gas-grain interaction (see Tielens & Charnley 1997; Herbst & van Dishoeck 2009, for reviews). Recent models produce these species on the grains rather than in hot gas-phase chemistry, either through direct grain surface chemistry or through mild photolysis of simple ice species resulting in radicals which then react with each other to form more complex species (Garrod et al. 2008; Öberg et al. 2009). These types of grain chemistry – either direct surface reactions or photolysis – will not result in high abundances of C2H2 and HCN because these species will be readily hydrogenated by H. On grain surfaces, N is quickly converted to NH3, while in the gas phase, N flows through NO to N2 with a slight detour to HCN. Grain surface reactions lead to very high abundances of NH3, especially in relation to HCN. Observations and comparisons with model predictions show that also CH4 formation is very efficient on dust grains (Öberg et al. 2008).
4.3 Comparison of models with observations
Table 5 and Figures 6 and 7 show that warm chemistry can explain the observed abundance ratios of HCN, C2H2 and CO2 as well as most limits. In the Markwick et al. (2002) models, all abundance ratios are close to unity, but these ratios refer to the entire disk rather than just the surface layers. It is therefore not possible to properly test these models. The models of Agúndez et al. (2008) and Najita et al. (2011) provide column densities for just the warm surface layers probed by the mid-infrared data, but tabulate only a limited number of species see §A for details.
The inner disk models of Agúndez et al. (2008) provide the correct range of column densities and abundance ratios in the surface layers around 1 AU. At 3 AU, the C2H2 column has dropped dramatically due to the lower temperature and the model overproduces the CO2/C2H2 ratio by a factor 100. The lower excitation temperatures observed for CO2 in our data compared with C2H2 and HCN provide indirect evidence for the radial dependence of the chemistry, with CO2 peaking at larger distances (see § 4.1). The pure XDR model results given by Najita et al. (2011), for the reference case of a disk at 1 AU, agree less well with the observations than the PDR model results at 1 AU. For example the SO2, NH3 and CO2 model ratios relative to C2H2 are several orders of magnitude higher than our observed upper limits and detections. This can be largely explained by the fact that the Najita et al. (2011) models do not contain photodissociation reactions in the surface layers which limit their abundances. Lowering the O/C ratio to 1 instead of 2.5 decreases the difference between the observations and the pure X-ray models but now underproduces CO2. As shown by Walsh et al. (2012) in combined UV + X-ray models, the inclusion of UV-induced processes is generally more important than those due to X-rays.
The importance of gas-grain interaction for the composition of the inner regions of the disk may well be revealed by NH3 and CH4 searches. As mentioned in section 4.2, high abundances of CH4 and NH3 relative to HCN and C2H2 could indicate that the chemistry in the inner part of disks has been reset due to evaporation of ices from dust grains. Table 6 includes the results from model M of Garrod et al. (2008). The efficiency to form NH3 on dust grains is the main reason why NH3/HCN and CH3CN/NH3 are so different in the grain surface models of Garrod et al. (2008) compared with the warm chemistry models developed by Najita et al. (2011) and Agúndez et al. (2008). Currently no observational limit can be set on the CH3CN/NH3 ratio. However, our observed limit on NH3/HCN clearly favors a low ratio for the abundances of these species, inconsistent with a significant contribution from pure ice chemistry.
The observed upper limits on the other species investigated here are in general higher or comparable to what the chemical models predict. Thus, a firm conclusion from our data is that the molecular abundance ratios cannot be higher than what is predicted in the current models. However they can be lower and future higher resolution observations with for example JWST or ELTs that go an order of magnitude (or more) deeper may be able to directly test the chemical models (see Table 5). Specifically, deep searches for HNC, HC3N, C6H6, SO2 and NH3 should be able to distinguish between some of the models, especially if the ratio of the data can be pushed to values significantly higher than 100.
4.4 Comparison with protostars, other disks and comets
The abundance ratios of the detected molecules —HCN, C2H2 and CO2— are remarkably close (within factors of two) to those observed toward high-mass protostars (Lahuis & van Dishoeck 2000), which have been interpreted with high temperature gas-phase chemistry models (Doty et al. 2002). Since our NH3/HCN limits of 1.1 are close to the detected NH3/HCN ratio of 1.2 toward one high-mass protostar (Knez et al. 2009), this suggests that deeper high resolution searches for NH3 may be fruitful.
It is also interesting to compare the two observed C2H2/HCN abundance ratios of 0.6 and 0.8 for IRS 46 and GV Tau respectively with the one order of magnitude lower values presented in Carr & Najita (2011) for 5 protoplanetary disks in Taurus. Those ratios have been inferred from emission lines, whereas ours come from absorption data and may probe a different part of the disk ( AU vs up to a few AU). This could imply that the C2H2/HCN abundance ratios probed through our edge-on disks presented are more similar to the hot cores and comets in Fig. 12 of Carr & Najita (2011) than to their protoplanetary disks. However, Salyk et al. (2011) and Mandell et al. (2012) present C2H2/HCN abundance ratios of 1 for several protoplanetary disks, illustrating that different analysis methods of the emission data can lead to an order of magnitude different abundance ratios. The latter values are about the same as the abundance ratios found in the hot core observations and in our disk absorption data.
It is interesting to further compare our inferred molecular ratios to those observed in comets, see Table 5 and Figures 6 and 7. The ratios tabulated for comets are presented as ranges between the highest and lowest observed ratios (Mumma & Charnley 2011), and are all within our observed upper limits and detections. This comparison suggests that some of the HCN and C2H2 produced by warm chemistry in the inner disk may be incorporated into cold comets. However, the presence of complex organics such as dimethyl ether in high abundances in comets (see Bockelée-Morvan 2011, for a recent review) suggests that the ice chemistry route is also important for their organic inventory. The detection of additional species in the inner disk such as CH4, HNC and HC3N will further constrain their relative importance.
In summary, our observed ratios suggest that warm chemistry models with O/C1 are most relevant for explaining the observed abundance patterns in disks. Future higher resolution observations of these molecules with JWST-MIRI and other facilities can help in answering the question to what extent warm chemistry and surface chemistry contribute to the chemical composition of the gas in the planet- and comet-forming zones of disks.
5 Conclusions
In this paper, mid-infrared spectra of HCN, C2H2 and CO2 have been analyzed for two edge-on disks, IRS 46 and GV Tau. The high data have also been used to put upper limits on the abundances of other molecules predicted to be abundant in the inner disk. The main conclusions are:
-
The two disks have similar column densities and similar abundance ratios of warm HCN, C2H2 and CO2. The first two molecules probe gas with excitation temperatures K, whereas CO2 probes somewhat cooler gas. These results are similar to those found toward massive protostars.
-
The observed abundance ratios for these three molecules are consistent with high temperature inner disk chemistry models with O/C1 in which the abundances of HCN and C2H2 rapidly drop with radius beyond 1 AU due to the decrease in temperature but that of CO2 peaks at larger radius.
-
No other absorption features are detected above 3 in either source, providing upper limits on a variety of hydrocarbon molecules, NH3 and SO2 that are of order unity or less with respect to C2H2 or HCN.
-
The upper limits relative to C2H2 and HCN are either higher or close to values given by high temperature chemistry models of protoplanetary disks. The observed NH3/HCN limit is much lower than would be expected if the chemistry in disks would have been reset due to evaporation of icy mantles on dust grains.
-
Hot chemistry disk models including both UV radiation and X-rays produce abundance ratios in better agreement with our observations than pure X-ray models.
-
The observed abundance ratios in comets are within the same range as our observed ratios or upper limits. The composition of comets could therefore be partly build up from gas in the inner regions of protoplanetary disks mixed outward to the comet-forming zone.
-
Future observations using higher resolution instruments on JWST, ELT, SPICA and SOFIA will be able to detect column densities which are an order of magnitude or more lower than the upper limits extracted from the Spitzer-IRS data, especially if ratios much higher than 100 can be obtained. Such data would provide much better constraints of the hot gas phase chemical models of the inner disk. Edge-on systems such as IRS 46 and GV Tau remain uniquely suited for this purpose.
Acknowledgements.
The authors are grateful to Catherine Walsh for further information on inner disk models. JEB is supported by grant 614.000.605 from Netherlands Organization of Scientific Research (NWO). EvD and FL acknowledge support from a NWO Spinoza Grant, from the Netherlands Research School for Astronomy (NOVA) and from A-ERC grant 291141-CHEMPLAN.References
- Agúndez et al. (2008) Agúndez, M., Cernicharo, J., & Goicoechea, J. R. 2008, A&A, 483, 831
- Aikawa et al. (1999) Aikawa, Y., Umebayashi, T., Nakano, T., & Miyama, S. M. 1999, ApJ, 519, 705
- Aresu et al. (2011) Aresu, G., Kamp, I., Meijerink, R., Woitke, P., Thi, W.-F., & Spaans, M. 2011, A&A, 526, A163
- Bast et al. (2011) Bast, J. E., Brown, J. M., Herczeg, G. J., van Dishoeck, E. F., & Pontoppidan, K. M. 2011, A&A, 527, A119
- Bergin (2011) Bergin, E. A. 2011, in ’Physical Processes in Circumstellar Disks Around Young Stars’, ed. P. Garcia, (University of Chicago Press: Chicago), p. 55
- Bettens et al. (1995) Bettens, R. P. A., Lee, H.-H., Herbst, E. 1995, ApJ, 443, 664
- Blake & Boogert (2004) Blake, G. A., & Boogert, A. C. A. 2004, ApJ, 606, L73
- Bockelée-Morvan (2011) Bockelée-Morvan, D. 2011, in ‘The Molecular Universe’, IAU Symposium 280, ed. J. Cernicharo & R. Bachiller (Cambridge University Press), p. 261
- Boonman et al. (2003) Boonman, A. M. S., van Dishoeck, E. F., Lahuis, F., & Doty, S. D. 2003, A&A, 399, 1063
- Brittain et al. (2003) Brittain, S. D., Rettig, T. W., Simon, T., Kulesa, C., DiSanti, M. A., & Dello Russo, N. 2003, ApJ, 588, 535
- Brittain et al. (2007) Brittain, S. D., Simon, T., Najita, J. R., & Rettig, T. W. 2007, ApJ, 659, 685
- Brittain et al. (2009) Brittain, S. D., Najita, J. R., & Carr, J. S. 2009, ApJ, 702, 85
- Brown et al. (subm.) Brown, J., Pontoppidan, K.M., van Dishoeck, E.F., & Herczeg, G. 2012, ApJ submitted
- Bruderer et al. (2012) Bruderer, S., van Dishoeck, E. F., Doty, S. D., & Herczeg, G. J. 2012, A&A, 541, A91
- Carr et al. (2004) Carr, J. S., Tokunaga, A. T., & Najita, J. 2004, ApJ, 603, 213
- Carr & Najita (2008) Carr, J. S., & Najita, J. R. 2008, Science, 319, 1504
- Carr & Najita (2011) Carr, J. S., & Najita, J. R. 2011, ApJ, 733, 102
- Charnley (1997) Charnley, S. B. 1997, ApJ, 481, 396
- Cherchneff & Glassgold (1993) Cherchneff, I., Glassgold, A.E. 1993, ApJ, 419, L41
- Ciesla & Cuzzi (2006) Ciesla, F. J., Cuzzi, J. N. 2006, Icarus, 181, 178
- Crapsi et al. (2008) Crapsi, A., van Dishoeck, E. F., Hogerheijde, M. R., Pontoppidan, K. M., & Dullemond, C. P. 2008, A&A, 486, 245
- Decin et al. (2004) Decin, L., Morris, P. W., Appleton, P. N., et al. 2004, ApJS, 154, 408
- Doppmann et al. (2008) Doppmann, G. W., Najita, J. R., & Carr, J. S. 2008, ApJ, 685, 298
- Doty et al. (2002) Doty, S. D., van Dishoeck, E. F., van der Tak, F. F. S., & Boonman, A. M. S. 2002, A&A, 389, 446
- Draine et al. (1983) Draine, B. T., Roberge, W. G., Dalgarno, A. 1983, ApJ, 264, 485
- Dutrey et al. (1997) Dutrey, A., Guilloteau, S., & Guelin, M. 1997, A&A, 317, L55
- Ehrenfreund & Charnley (2000) Ehrenfreund, P., & Charnley, S. B. 2000, ARA&A, 38, 427
- Evans et al. (1991) Evans, N. J., II, Lacy, J. H., & Carr, J. S. 1991, ApJ, 383, 674
- Evans et al. (2003) Evans, N.J. et al. 2003, PASP, 115, 965
- Fedele et al. (2011) Fedele, D., Pascucci, I., Brittain, S., Kamp, I., Woitke, P., Williams, J. P., Dent, W. R. F., & Thi, W.-F. 2011, ApJ, 732, 106
- Fuente et al. (2010) Fuente, A., Cernicharo, J., Agúndez, M., Berné, O., Goicoechea, J. R., Alonso-Albi, T., & Marcelino, N. 2010, A&A, 524, A19
- Fuente et al. (2012) Fuente, A., Cernicharo, J., & Agúndez, M. 2012, ApJ, 754, L6
- Garrod et al. (2008) Garrod, R. T., Weaver, S. L. W., & Herbst, E. 2008, ApJ, 682, 283
- Geers et al. (2006) Geers, V. C., et al. 2006, A&A, 459, 545
- Gibb et al. (2007) Gibb, E. L., Van Brunt, K. A., Brittain, S. D., & Rettig, T. W. 2007, ApJ, 660, 1572
- Gibb & Troutman (2011) Gibb, E. & Troutman, M., 2011, IAU Symposium 280, Poster 31
- Glassgold et al. (2009) Glassgold, A. E., Meijerink, R., & Najita, J. R. 2009, ApJ, 701, 142
- Goicoechea & Nakagawa (2011) Goicoechea, J. R., & Nakagawa, T. 2011, in ‘Conditions and impact of star formation’, EAS series, vol. 52, ed. M. Röllig et al. (EDP Sciences), p. 253
- Gorti & Hollenbach (2008) Gorti, U., & Hollenbach, D. 2008, ApJ, 683, 287
- Gorti et al. (2011) Gorti, U., Hollenbach, D., Najita, J., & Pascucci, I. 2011, ApJ, 735, 90
- Heinzeller et al. (2011) Heinzeller, D., Nomura, H., Walsh, C., & Millar, T. J. 2011, ApJ, 731, 115
- Helmich (1996) Helmich, F. P. 1996, PhD thesis, Leiden Observatory, Leiden University
- Henning et al. (2010) Henning, T., et al. 2010, ApJ, 714, 1511
- Herbst & van Dishoeck (2009) Herbst, E., & van Dishoeck, E. F. 2009, ARA&A, 47, 427
- Hogerheijde et al. (2011) Hogerheijde, M., et al. 2011, Science, 334, 338
- Jacquinet-Husson et al. (2011) Jacquinet-Husson, N., Crepeau, L., Armante, R. et al. 2011 JQSRT, 112, 2395
- Kamp et al. (2010) Kamp, I., Tilling, I., Woitke, P., Thi, W.-F., & Hogerheijde, M. 2010, A&A, 510, A18
- Kastner et al. (1997) Kastner, J. H., Zuckerman, B., Weintraub, D. A., & Forveille, T. 1997, Science, 277, 67
- Kessler-Silacci et al. (2006) Kessler-Silacci, J., Augereau, J.-C., Dullemond, C. P., et al. 2006, ApJ, 639, 275
- Knez et al. (2009) Knez, C., Lacy, J. H., Evans, N. J., II, van Dishoeck, E. F., & Richter, M. J. 2009, ApJ, 696, 471
- Koresko et al. (1999) Koresko, C. D., Blake, G. A., Brown, M. E., Sargent, A. I., & Koerner, D. W. 1999, ApJ, 525, L49
- Kress et al. (2010) Kress, M. E., Tielens, A. G. G. M. & Frenklach, M. 2010, Advances in Space Research, 46, 44
- Kruger et al. (2011) Kruger, A. J., Richter, M. J., Carr, J. S., et al. 2011, ApJ, 729, 145
- Lacy et al. (1989) Lacy, J. H., Evans, N. J., II; Achtermann, J. M., Bruce, D. E., Arens, J. F., & Carr, J. S. 1989, ApJ, 342, L43
- Lahuis & van Dishoeck (2000) Lahuis, F., & van Dishoeck, E. F. 2000, A&A, 355, 699
- Lahuis & Boogert (2003) Lahuis, F., & Boogert, A. 2003, SFChem 2002: Chemistry as a Diagnostic of Star Formation, ed. C. L. Curry & M. Fich (NRC Press, Ottawa, Canada), p. 335
- Lahuis et al. (2006) Lahuis, F., et al. 2006, ApJ, 636, L145
- Lahuis et al. (2006b) Lahuis, F., et al. 2006b, c2d Spectroscopy Explanatory Suppl. (Pasadena: Spitzer Science Center)
- Lahuis et al. (2007) Lahuis, F., van Dishoeck, E. F., Blake, G. A., et al. 2007, ApJ, 665, 492
- Lahuis et al. (2011) Lahuis, F., Kamp, I., Thi, W. F., van Dishoeck, E. F. & Woitke, P. 2011, IAU Symposium 280, Poster 44
- Langer & Graedel (1989) Langer, W. D.; Graedel, T. E. 1989, ApJS, 69, 241
- Leinert et al. (2001) Leinert, C., Beck, T. L., Ligori, S., Simon, M., Woitas, J., & Howell, R. R. 2001, A&A, 369, 215
- Loinard et al. (2008) Loinard, L., Torres, R. M., Mioduszewski, A. J., & Rodríguez, L. F. 2008, ApJ, 675, L29
- Mandell et al. (2008) Mandell, A. M., Mumma, M. J., Blake, G. A., Bonev, B. P., Villanueva, G. L., & Salyk, C. 2008, ApJ, 681, L25
- Mandell et al. (2012) Mandell, A. M., Bast, J., van Dishoeck, E. F., et al. 2012, ApJ, 747, 92
- Markwick et al. (2002) Markwick, A. J., Ilgner, M., Millar, T. J., & Henning, T. 2002, A&A, 385, 632
- Markwick & Charnley (2004) Markwick, A. J., & Charnley, S. B. 2004, Astrobiology: Future Perspectives, 305, 33
- Millar & Herbst (1994) Millar, T. J., & Herbst, E. 1994, A&A, 288, 561
- Mitchell (1984) Mitchell, G. F. 1984, ApJS, 54, 81
- Mumma & Charnley (2011) Mumma, M. J., et al. 2011, ApJ, 734, L7
- Najita et al. (2003) Najita, J., Carr, J. S., & Mathieu, R. D. 2003, ApJ, 589, 931
- Najita et al. (2010) Najita, J. R., Carr, J. S., Strom, S. E., Watson, D. M., Pascucci, I., Hollenbach, D., Gorti, U., & Keller, L. 2010, ApJ, 712, 274
- Najita et al. (2011) Najita, J. R., Ádámkovics, M., & Glassgold, A. E. 2011, ApJ, 743, 147
- Nomura et al. (2007) Nomura, H., Aikawa, Y., Tsujimoto, M., Nakagawa, Y., & Millar, T. J. 2007, ApJ, 661, 334
- Nomura et al. (2009) Nomura, H., Aikawa, Y., Nakagawa, Y., & Millar, T. J. 2009, A&A, 495, 183
- Öberg et al. (2008) Öberg, K. I., Boogert, A. C. A., Pontoppidan, K. M., et al. 2008, ApJ, 678, 1032
- Öberg et al. (2009) Öberg, K. I., Garrod, R. T., van Dishoeck, E. F., & Linnartz, H. 2009, A&A, 504, 891
- Öberg et al. (2011) Öberg, K. I., et al. 2011, ApJ, 734, 98
- Oliveira et al. (2010) Oliveira, I., et al. 2010, ApJ, 714, 778
- Pascucci et al. (2009) Pascucci, I., Apai, D., Luhman, K., Henning, T., Bouwman, J., Meyer, M. R., Lahuis, F., & Natta, A. 2009, ApJ, 696, 143
- Pineau des Forêts et al. (1987) Pineau des Forêts, G., Flower, D. R., Hartquist, T. W., Millar, T. J. 1987, MNRAS, 227, 993
- Pontoppidan et al. (2008) Pontoppidan, K. M., Blake, G. A., van Dishoeck, E. F., Smette, A., Ireland, M. J., & Brown, J. 2008, ApJ, 684, 1323
- Pontoppidan et al. (2010) Pontoppidan, K. M., Salyk, C., Blake, G. A., Meijerink, R., Carr, J. S., & Najita, J. 2010, ApJ, 720, 887
- Pontoppidan et al. (2011) Pontoppidan, K. M., Blake, G. A., & Smette, A. 2011, ApJ, 733, 84
- Prinn (1993) Prinn, R. G. 1993, Protostars and Planets III, ed. E. Levy & J. I. Lunine (Tucson: University of Arizona Press), 1005
- Przygodda (2004) Przygodda, F. 2004, Ph.D. Thesis, Max-Planck Institute of Astronomy, Heidelberg
- Richter et al. (2006) Richter, M. J., Lacy, J. H., Jaffe, D. T., Mar, D. J., Goertz, J., Moller, W. M., Strong, S., Greathouse, T. K. 2006, SPIE, 6269, 62691H
- Roccatagliata et al. (2011) Roccatagliata, V., Ratzka, T., Henning, T., et al. 2011, A&A, 534, A33
- Rodgers & Charnley (2003) Rodgers, S. D., & Charnley, S. B. 2003, ApJ, 585, 355
- Rothman et al. (2009) Rothman, L. S., Gordon, I. E., Barbe, A. et al. 2009, JQSRT, 110, 533
- Salyk et al. (2008) Salyk, C., Pontoppidan, K. M., Blake, G. A., Lahuis, F., van Dishoeck, E. F., & Evans, N. J., II 2008, ApJ, 676, L49
- Salyk et al. (2009) Salyk, C., Blake, G. A., Boogert, A. C. A., & Brown, J. M. 2009, ApJ, 699, 330
- Salyk et al. (2011) Salyk, C., Pontoppidan, K. M., Blake, G. A., Najita, J. R., & Carr, J. S. 2011, ApJ, 731, 130
- Salyk et al. (2011b) Salyk, C., Blake, G. A., Boogert, A. C. A., & Brown, J. M. 2011, ApJ, 743, 112
- Smith et al. (2009) Smith, R. L., Pontoppidan, K. M., Young, E. D., Morris, M. R., & van Dishoeck, E. F. 2009, ApJ, 701, 163
- Smith (2011) Smith, I.W.M. 2011, ARA&A, 49, 29
- Stäuber et al. (2005) Stäuber, P., Doty, S. D., van Dishoeck, E. F., & Benz, A. O. 2005, A&A, 440, 949
- Sternberg & Dalgarno (1995) Sternberg, A., & Dalgarno, A. 1995, ApJS, 99, 565
- Thi et al. (2004) Thi, W.-F., van Zadelhoff, G.-J., & van Dishoeck, E. F. 2004, A&A, 425, 955
- Tielens & Charnley (1997) Tielens, A. G. G. M., Charnley, S. B. 1997, Origin of Life, 27, p.23
- Vasyunin et al. (2011) Vasyunin, A. I., Wiebe, D. S., Birnstiel, T., Zhukovska, S., Henning, T., & Dullemond, C. P. 2011, ApJ, 727, 76
- Viti et al. (2011) Viti, S., Jimenez-Serra, I., Yates, J. A., Codella, C., Vasta, M., Caselli, P., Lefloch, B., Ceccarelli, C. 2011, ApJ, 740, L3
- Walsh et al. (2010) Walsh, C., Millar, T. J., & Nomura, H. 2010, ApJ, 722, 1607
- Walsh et al. (2012) Walsh, C., Nomura, H., Millar, T. J., & Aikawa, Y. 2012, ApJ, 747, 114
- Willacy et al. (1998) Willacy, K., Klahr, H. H., Millar, T. J., & Henning, T. 1998, A&A, 338, 995
- Willacy & Woods (2009) Willacy, K., & Woods, P. M. 2009, ApJ, 703, 479
- Woitke et al. (2009) Woitke, P., Kamp, I., & Thi, W.-F. 2009, A&A, 501, 383
- Woods & Willacy (2007) Woods, P. M., Willacy, K. 2007, ApJ, 655, L49
Appendix A Discussion of specific disk models
In this section, we provide more details of the specific disk models to which our observational results are compared.
A.1 X-ray dominated region (XDR) surface layers
Najita et al. (2011) have analyzed the chemistry of the inner (0.25–20 AU) portions of protoplanetary disks exposed to X rays. The physical structure derives from the thermochemical model developed by Glassgold et al. (2009). The thermal structure is evaluated separately for dust and gas and the surface gas temperature significantly exceeds that of the dust in the upper layers. In their model, gas and dust temperatures are decoupled for column densities less than 1022 cm-2. If only the disk surface is considered ( 3.1021 cm-2), gas temperatures of 300 K are reached out to radial distances of 4 AU.
The formation of hydrocarbons in this model is triggered by X-rays which produce He+ which liberates the C+ from CO and N from N2. Acetylene is subsequently produced by C and C+ insertion reactions with small hydrocarbon radicals (Fig. 8). Hence, the C2H2 abundance is sensitive to the X-ray ionization rate. Radicals such as OH are also sensitive to X-rays. At low temperature, OH results from the recombination of H3O+ produced by ion-molecule reactions and its abundance scales directly with the ionization rate. The formation rate of daughter species of OH such as NO, SO, SO2 and CO2 is similarly increased by X-ray ionization. However, if their destruction is also dominated by He+, their abundances are not sensitive to the X-ray ionization flux. This is the case for CO2, for example. Note that the models of Najita et al. (2011) do not include UV photodissociation and may thus underestimate the amount of OH that could be produced from H2O in the upper layers.
The transformation of N back to N2 is mediated by neutral reactions and is accompanied by significant column densities of warm nitrogen-bearing molecules such as HCN and NH3 in these models. Specifically, HCN is influenced by X-rays in its formation route both because it liberates N from N2 and then N reacts with OH to form NO, with NO subsequently reacting with C to form CN. HCN is then formed through reactions of CN with H2. Because of lack of photodissociation in the model, HCN is destroyed by He+ and hence destruction is also sensitive to the X-ray. In the end, the HCN decreases slightly with X-ray luminosity in the models by Najita et al. (2011).
A.2 Photodissociation region (PDR) surface layers
Various recent models have analyzed the gas phase chemistry of hot inner regions of protoplanetary disks including UV radiation for the chemistry and heating of the gas (Agúndez et al. 2008; Woitke et al. 2009; Willacy & Woods 2009; Vasyunin et al. 2011; Walsh et al. 2012). The Agúndez et al. (2008) study is particularly instructive because they present models for just the photosphere of the disk, down to H2 column densities of cm-2 to which the UV penetrates. In their models, FUV photons and cosmic rays produce C, C+ and N. Atomic N is then channeled to HCN through a similar reaction routine as that described in Fig. 8. The C+ leads to a rich hydrocarbon radical chemistry. However, the formation of high abundances of C2H2 and CH4 requires the reaction of atomic C with H2 to proceed which has a very high activation barrier. This reaction only proceeds in very warm gas ( 500 K) forming CH. This is reflected in the radial dependence of the C2H2 and CH4 columns, which reach values of 1016 cm-2 out to radii of 1 AU, but then drop by orders of magnitude in the colder gas. This rapid drop with disk radius is also seen in models by other authors. In contrast, the CO2 column increases with radius in the inner 1 AU since it favors somewhat colder gas.
Walsh et al. (2012) present a combined UV + X-ray model which shows that a correct treatment of the photodissociation is generally more important than including X-rays. For the important species considered here —C2H2, HCN, CO2, CH4 and NH3— the column densities in the inner disk do not change measurably when X-rays are added to the UV model.
Appendix B Auxilliary figures
This appendix presents simulations of the spectra of all molecules considered here at higher spectral resolving power of and , appropriate for future instruments. In addition, spectra at the Spitzer resolving power of are included. All spectra are computed for , 500 and 1000 K, km s-1 and a column density of 1.1016 cm-2.