The neutron-proton charge-exchange amplitudes measured in the reaction
Abstract
The unpolarised differential cross section and the two deuteron tensor analysing powers and of the charge-exchange reaction have been measured with the ANKE spectrometer at the COSY storage ring. Using deuteron beams with energies 1.2, 1.6, 1.8, and 2.27 GeV, data were obtained for small momentum transfers to a system with low excitation energy. The results at the three lower energies are consistent with impulse approximation predictions based upon the current knowledge of the neutron-proton amplitudes. However, at 2.27 GeV, where these amplitudes are far more uncertain, agreement requires a reduction in the overall double-spin-flip contribution, with an especially significant effect in the longitudinal direction. These conclusions are supported by measurements of the deuteron-proton spin-correlation parameters and that were carried out in the reaction at 1.2 and 2.27 GeV. The values obtained for the proton analysing power also suggest the need for a radical re-evaluation of the neutron-proton elastic scattering amplitudes at the higher energy. It is therefore clear that such measurements can provide a valuable addition to the neutron-proton database in the charge-exchange region.
pacs:
13.75.-nHadron-induced low- and intermediate-energy reactions and scattering (energy GeV) and 25.45.DeDeuteron breakup and 25.45.KkCharge-exchange reactions1 Introduction
An understanding of the nucleon-nucleon () interaction is fundamental for the whole of nuclear and hadronic physics. The SAID database and analysis program ARN2000 have proved to be truly invaluable tools over many years for researchers working in this area. The general procedure adopted here is to take all the elastic scattering data in the literature in order to perform a phase shift analysis up to a certain orbital angular momentum and use a theoretical model for higher . When significant new experimental data become available, the value of can be increased. By assuming that the phase shifts vary smoothly with beam energy, predictions can be made for observables at a particular energy and it is in this way that the SAID program is most commonly used.
Clearly any amplitude analysis can only be as good as the data used in its implementation. Though lots of proton-proton observables have been measured up to high energies, there are significant gaps in our knowledge for beam energies GeV, especially at small angles. The situation is even more serious for neutron-proton scattering where there are major holes in the experimental database above about 1 GeV and data that do exist are not necessarily very well reproduced by the SAID program. For example, the only differential cross section data for large angle scattering BIZ1975 , in the so-called charge-exchange region, seem to be consistently over-predicted in the SAID analysis.
Extra information in the sector can be found by performing experiments with a deuteron beam or a deuterium target. The simplest of these involves measuring the ratio of the forward charge-exchange cross section of a neutron on a deuterium target to that on hydrogen,
| (1.1) |
where is the square of the four-momentum transfer between the initial neutron and final proton. Due to the Pauli principle, when the two final neutrons are in a relative -wave their spins must be antiparallel and the system is in the state. Under such circumstances the reaction involves a spin flip from the of the deuteron to the of the dineutron. In impulse approximation the ratio determines
| (1.2) |
where () is the forward charge-exchange differential cross section with (without) a spin-flip DEA1972 .
Extensive measurements of have been reported and these have recently been extended up to 2 GeV at Dubna SHA2009 . Although impulse approximation predictions for on the basis of the current SAID amplitudes reproduce well these observations from 300 MeV up to about 800 MeV, there are serious discrepancies above 1 GeV LEH2010 . In terms of Eq. (1.2), it seems that the SAID solution overestimates the contribution of the spin-flip amplitudes to the forward charge-exchange cross section.
More detailed information on the charge-exchange amplitudes can be derived by using a polarised deuteron beam or target and studying the reaction BUG1987 . To achieve maximum sensitivity, the excitation energy in the final system must be very low so that the final diproton is in the configuration. Experiments from a few hundred MeV up to 2 GeV ELL1987 ; KOX1993 have generally borne out well predictions based upon the impulse approximation BUG1987 .
In order to constrain the amplitudes using this approach, the ANKE collaboration has embarked on a systematic programme to measure the observables up to the maximum COSY deuteron energy of GeV KAC2005 . The proof of principle of the method was the experiment carried out at a deuteron energy of 1.17 GeV where, because of the wealth of neutron-proton data, the SAID amplitudes used as input in the calculations should be quite reliable. The measured values of the unpolarised cross section and the two deuteron Cartesian tensor analysing powers and were then quantitatively reproduced in impulse approximation CHI2009 . Dilutions of the signals due to higher partial waves in the final system were taken into account in the calculations CAR1991 .
The results of similar measurements are presented here at deuteron beam energies of 1.2, 1.6, 1.8, and 2.27 GeV. Whereas the unpolarised differential cross section is correctly predicted in impulse approximation at the three lower energies, this gives a result that is about 15% too high at 2.27 GeV. Such a factor is in fact consistent with the discrepancy between the SAID predictions and the data in the charge-exchange region BIZ1975 , taking into account the SAID overestimation of the spin-flip contributions, as measured in the inclusive experiment SHA2009 ; LEH2010 .
The situation is rather similar for and , where impulse approximation reproduces the measurements very well at 1.8 GeV and below but gives a much poorer description at 2.27 GeV. Agreement can be restored if the spin-longitudinal amplitude is reduced by % compared to the SAID values. This is not entirely unexpected because the deuteron tensor analysing power in the forward direction is closely linked to the longitudinal and transverse spin-transfer coefficients in charge exchange. Since there are no measurements of these parameters at small angles in the GeV region, the SAID amplitudes are fixed here mainly by the assumptions in the model.
Some confirmation of the renormalisation of the spin-longitudinal amplitude is offered by the values of the two deuteron-proton spin-correlation parameters and that were measured at 1.2 and 2.27 GeV by replacing the hydrogen cluster target with a specially designed cell that can be filled with polarised gas GRI2007 . In the limit these parameters depend upon interferences between the spin-spin amplitudes and, although the SAID input reproduces well the 1.2 GeV data, at 2.27 GeV a 25% reduction in the spin-longitudinal term leads to a much better description.
The polarised hydrogen target MIK2012 also allowed us to measure the proton analysing power in the reaction and the conclusions to be drawn here are broadly similar. Despite the signal being quite small over the ANKE angular range, it is reproduced quantitatively in the impulse approximation calculations at 1.2 GeV, though these fail badly at 2.27 GeV. This observable depends upon the interference of a spin-orbit amplitude with a spin-spin term and it would seem that the current SAID analysis ARN2000 grossly underestimates the imaginary part of the spin-orbit amplitude at the higher energy.
We have described the phenomenology of the deuteron charge-exchange reaction at some length in earlier publications CHI2009 ; CHI2006a ; CHI2006b but, in order to make the current paper more self-contained, some of this material is repeated in sect. 2. The experimental set-up for measuring with the hydrogen cluster-jet target is identical to that used in our earlier work CHI2009 and so most of the emphasis in sect. 3 is on the polarised hydrogen gas cell used in the spin-correlation measurements. The measurements of the luminosity through the observation of the quasi-free reaction are reported in sect. 4, where the results for the unpolarised differential cross sections are compared with impulse approximation calculations.
The polarisation of the deuteron beam was established at 1.2 GeV and, since there are no depolarising resonances for the deuteron in the COSY energy range, the analysing powers for the reaction could be measured at various energies and the results are presented in sect. 5. The polarisation measurements with the gas cell have no parallel in our earlier work. The method used here relies on the data taken with the polarised deuterium target and the measurement of the analysing power of quasi-free . Taken together with the measurement of the vector polarisation of the deuteron beam, this allowed us to extract the spin-correlation and proton analysing power results given in sect. 6. Our conclusions regarding the usefulness of charge exchange on the deuteron in the study of neutron-proton elastic scattering amplitudes are drawn in sect. 7.
2 Deuteron charge exchange in impulse approximation
The cross section and spin observables for the reaction have been extensively discussed in the literature BUG1987 ; CAR1991 and only essential formulae are collected here. In impulse approximation the deuteron charge exchange amplitude is proportional to a neutron-proton charge exchange amplitude times a form factor that reflects the overlap between the initial deuteron wave function and that of the outgoing diproton system.
The elementary amplitude may be written in terms of five scalar amplitudes in the cm system as
| (2.1) | |||||
where is the three-momentum transfer and the Pauli matrices are sandwiched between neutron and proton spinors. Here is the spin-independent amplitude between the initial neutron and final proton, is a spin-orbit contribution, and , , and are three spin-spin terms.
The orthogonal unit vectors used in Eq. (2.1) are defined in terms of the initial neutron () and final proton () cm momenta;
| (2.2) |
The amplitudes are normalised such that the differential cross section has the form
| (2.3) |
In the limit of very low , where is the relative momentum, the deuteron charge exchange necessarily involves a spin flip from the of the deuteron to the of the diproton. In this case the contribution from the spin-independent amplitude drops out and one is left with only the spin-flip cross sections, as in the sum rule of Eq. (1.2). The observables involving only the initial spins that are accessible at ANKE are linked to the amplitudes through CAR1991 ; BAR1989 :
| (2.4) |
where the spin-flip intensity
| (2.5) |
The function
| (2.6) |
is the ratio of two transition form factors that involve the - and -states of the deuteron wave function. In the forward direction .
Since vanishes in the forward direction, the contributions of to the cross section and the Cartesian tensor analysing powers and in Eq. (2.4) are almost negligible under the conditions of the ANKE experiment. Measurements of the unpolarised cross section and the two transverse analysing powers can therefore determine separately the values of , , and at fixed momentum transfer . The two deuteron-proton spin correlations that are measurable at ANKE, and , fix two of the relative phases. The proton analysing power gives mainly information on the spin-orbit amplitude .
Although the formulae given here describe the general features of our data, detailed comparisons with theory are made using a program that takes higher final waves into account. These can, in particular, dilute the polarisation signals CAR1991 .
3 The experimental facility
The experiments reported here were carried out over three different time periods using the ANKE magnetic spectrometer BAR2001 that is placed at an internal target position of the COoler SYnchrotron (COSY) MAI1997 of the Forschungszentrum Jülich. Initially a polarised deuteron beam was used in conjunction with an unpolarised hydrogen cluster target KHO1999 . In 2005 the reaction was studied at deuteron beam energies , 1.6 and 1.8 GeV. The following year, the beam energy was increased to 2.27 GeV, with 1.2 GeV being repeated for polarimetry purposes. The equipment used was described in our earlier publications CHI2009 ; CHI2006a ; CHI2006b . However, for the study of the spin-correlation parameters in 2009 KAC2007 , a newly developed polarised internal target GRI2007 ; MIK2012 was installed at ANKE and this was employed in experiments at 1.2 and 2.27 GeV.
3.1 The polarised deuteron beam at COSY
The polarised deuterium ion source at COSY provides beams with different spin configuration CHI2006b . It uses radio frequency transition units and quadrupole magnets to exchange the occupation numbers of the hyperfine states in the atom. The source was set up to provide a variety of states with different tensor and vector polarisations but, as listed in Table 1, the selections differed for the experiments with cluster or polarised cell target.
The COSY cycles were configured to provide beam first at 1.2 GeV and then, without additional injection, accelerate the deuterons to one of the higher energies. This procedure allows the use of the polarisation export method MCH2011 , which is crucial in the measurement of spin observables at higher energies. This technique involves undertaking the polarimetry measurements at the lowest GeV flat top energy, where the analysing powers are precisely known, and assuming that the beam polarisation is unchanged at the higher energy. This procedure is viable because there are no depolarising resonances for deuterons in the COSY energy range. This was checked at the 4% level by repeating the measurement of the analysing powers after deceleration MCH2011 .
| Experiment | State | |||
|---|---|---|---|---|
| unpolarised target | 1 | 1 | ||
| 2 | 1 | |||
| 3 | 1 | |||
| 4 | 1 | |||
| 5 | 1 | |||
| 6 | ||||
| 7 | ||||
| 8 | ||||
| 9 | ||||
| polarised target | 1 | 1 | ||
| 3 | 1 | |||
| 8 |
3.2 The polarised hydrogen cell target at ANKE
The ANKE polarised internal gas target MIK2012 ; ENG2008 uses an Atomic Beam Source (ABS) that is capable of producing both polarised hydrogen and deuterium beams RAT2003 . The first tests with the hydrogen atoms gave polarisations of and for spin-up and spin-down, respectively MIK2012 ; MIK2011 .
The polarised atomic beam could be used directly from the source as a jet target. During the commissioning runs, the ABS demonstrated an integral jet-target thickness of about cm-2, which is consistent with the predicted value MIK2011 . However, much higher target densities can be achieved if one uses a storage cell fed by the ABS. In order to achieve the maximum density, it is important to minimise the dimensions of the storage-cell tube. But, on the other hand, this limits the number of particles stored because of the beam heating and the consequent losses on the cell walls. A maximum target density of about cm-2 was achieved with the cell during the commissioning runs and this resulted in luminosities of up to cm-2s-1, depending upon the beam intensity ENG2008 .
During the 2009 beam time a cell made of m thick aluminium foil (99.95% Al) was used GRI2007 . In order to minimise depolarisation on the cell surface, its inner walls were coated with Teflon. The cell had dimensions mm3, where is measured along the beam direction with and referring to the horizontal and vertical transverse directions, respectively.
A dedicated beam development was required to ensure that the COSY beam passed successfully through the cell. Electron cooling STE2003 and stacking injection KAM2004 were employed, with hundreds of injections per cycle to increase the number of stored deuterons in the beam. In order to avoid excessive background coming from the interactions of the beam halo particles with the cell wall, scrapers were installed upstream of the target region.
In the hydrogen case, the ABS was configured to produce two polarised states with equal gas densities. The polarisation of the hydrogen target was flipped between spin-up () and spin-down () every five seconds throughout the whole COSY cycle, which lasted for one hour. Such a procedure simplifies the later analyses by obviating the need to consider the luminosities while calculating the asymmetries between these states. In order to have a possibility to measure the target spin-up and spin-down polarisations separately, runs with an unpolarised hydrogen cell-target were also undertaken.
3.3 The ANKE detection system
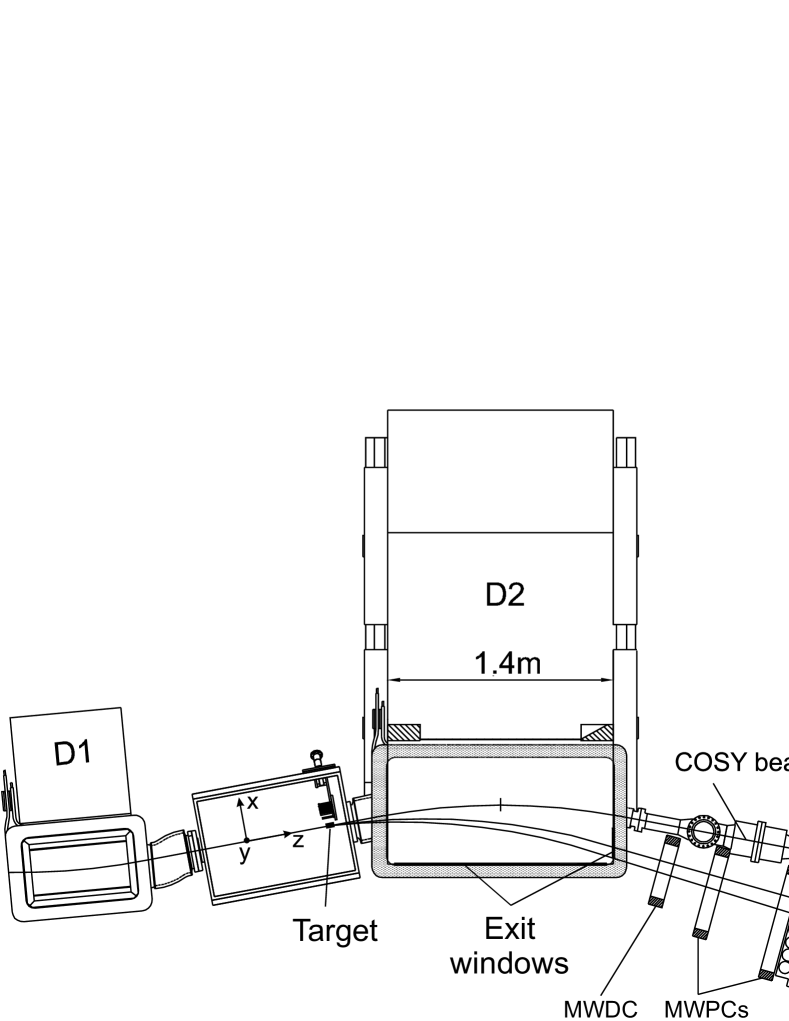
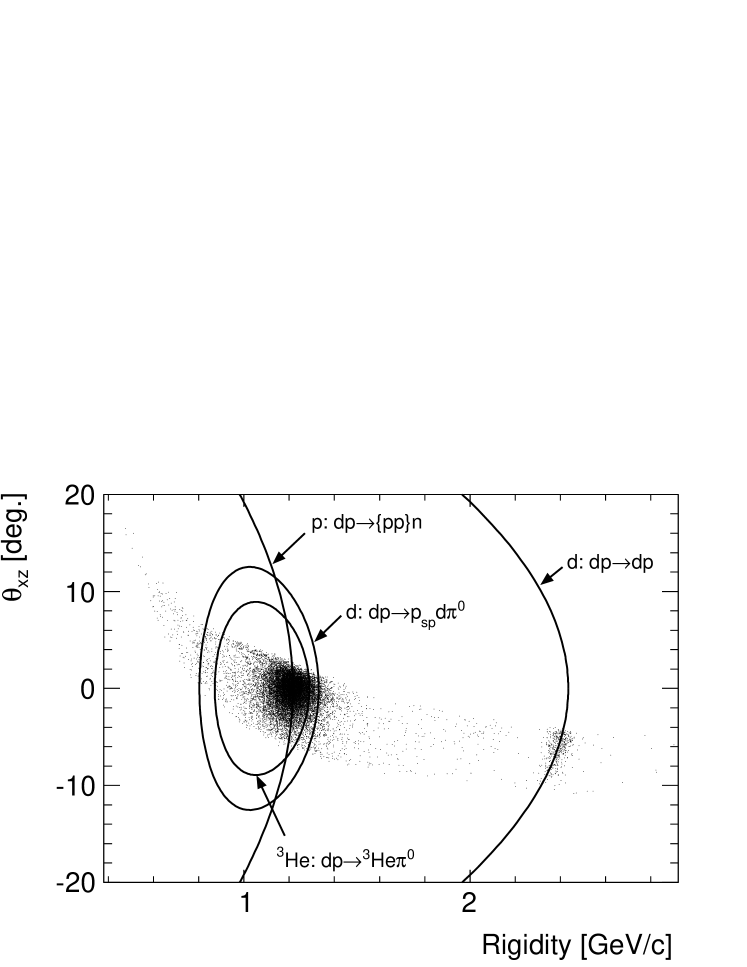
The forward detector system (FD) of the ANKE magnetic spectrometer, illustrated in Fig. 1, is used for the deuteron charge-exchange studies. The multiwire chambers in the FD serve for track reconstruction and the three layers of the scintillation hodoscope permit the measurements of the arrival time and energy-loss that are required for particle identification DYM2004 . The main trigger used in the experiments consisted of a coincidence between the different layers in the hodoscope of the FD. Figure 2 shows the experimental yield of ANKE for single charged particles at GeV in terms of the laboratory production angle in the horizontal plane and the magnetic rigidity. The kinematic curves for some of the possible nuclear reactions are also illustrated.
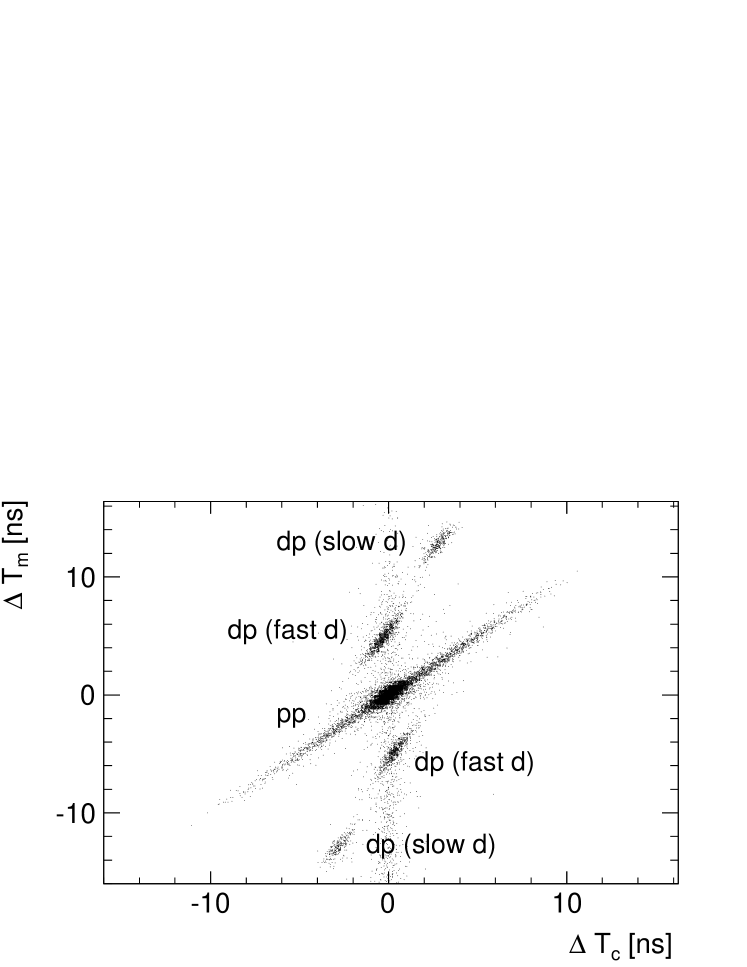
Among the reactions observed, there are two that are of particular interest, namely the deuteron charge-exchange and the quasi-free , where the proton, , has about half the beam momentum. The latter reaction is used to measure both the vector polarisation of the deuteron beam or hydrogen target and also the luminosity. After recording two charged particles, deuteron-proton pairs are separated from the remaining two-track events (mainly proton pairs) in the subsequent analysis by using the time information from the hodoscope. As demonstrated in Fig. 3, if one assumes that both detected particles in the pair are protons, the calculated () time of flight difference from the target does not match with the measured one () for other pairs. After recognising the two charged particles, the missing-mass distribution allows one to identify the reaction.
4 The cross section determination
The cross section for a given physical process is given in terms of the corresponding counting rate and the luminosity through:
| (4.1) |
The luminosity, which is the product of the target density and beam intensity, can be measured in various ways. In the current analysis we relied on the measurement in parallel of the rate for a process with a well-known and sizeable cross section. Once the luminosity is known, absolute values of cross sections for other reactions can be deduced from the count rates measured in the experiment.
4.1 The reaction
The reaction is used in the determination of the luminosity in this experiment. This is identified in the ANKE forward detector by detecting both charged particles (cf. Figs. 2 and 3). After recognising the -pairs, the reaction is finally isolated on the basis of the missing-mass distributions CHI2009 . There is an accidental background at very small that is randomly distributed in . This is caused by fast particles, mainly protons, that are produced in a different beam-target interaction. The contribution from such accidental events in the vicinity of the fast deuteron branch of the reaction increases rapidly with energy. It varies between % and % for GeV, whereas it is less then % at 1.2 GeV. The background is negligible at all energies for the slow deuteron branch.
The properties of background were studied using the data for which ns and ns. As can be seen from Fig. 3, no true coincidence two-track events are expected in this region. These data provided the shape of background in the distributions of the missing mass and the deuteron laboratory scattering angle in the reaction. The normalisation for the background was found by comparing the background missing-mass spectra with that for the identified pairs. The normalised background was then subtracted from the angular distributions.
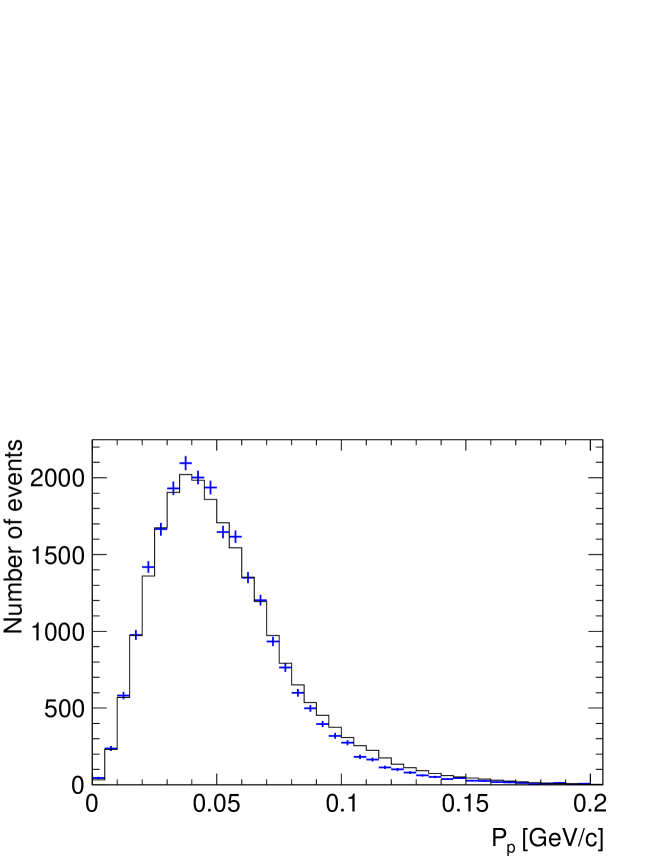
At intermediate energies, soft deuteron collisions are generally dominated by the interaction of one of the nucleons in the nucleus, the other nucleon being a spectator. When the proton acts as a spectator, , the reaction can be interpreted in terms of quasi-free pion production. To confirm the spectator hypothesis, a Monte Carlo simulation has been performed within PLUTO PLUTO using the Fermi momentum distribution from the Paris deuteron wave function LAC1981 . As is clear from Fig. 4, the data are consistent with quasi-free production on the neutron leading to a spectator proton. However, in order to reduce further possible contributions from multiple scattering and other mechanisms, only events below 60 MeV/ were retained for the luminosity evaluation.
The determination of the angles for the quasi-free reaction is complicated by the Fermi motion of the nucleons inside the deuteron. Due to this effect, the effective neutron beam energy, , is spread around half the deuteron beam energy with a width arising from the Fermi momentum. At a beam energy of MeV per nucleon, the FWHM is MeV for a MeV/ cut. Furthermore, the neutron direction is not precisely aligned along that of the beam, but is spread over some solid angle. Since this introduces an incident angle, which is several degrees in the laboratory system (depending on the beam energy), it has to be taken into account. These considerations apply to both the polar and azimuthal angles. In order to correct for this effect, the three-momentum of the incident neutron was reconstructed using the information from the spectator-proton momentum. The deuteron polar angle was measured from the neutron momentum instead of the beam direction. The azimuthal angle was defined between the normals to the COSY ring and deuteron scattering plane.
Isospin invariance requires the cross section for to be half of that for , for which there are numerous measurements ARN1993 . An additional advantage of using this reaction for normalisation is that the typical 5% shadowing effect in the deuteron (where one nucleon hides behind the other) should be broadly similar in the and reactions.
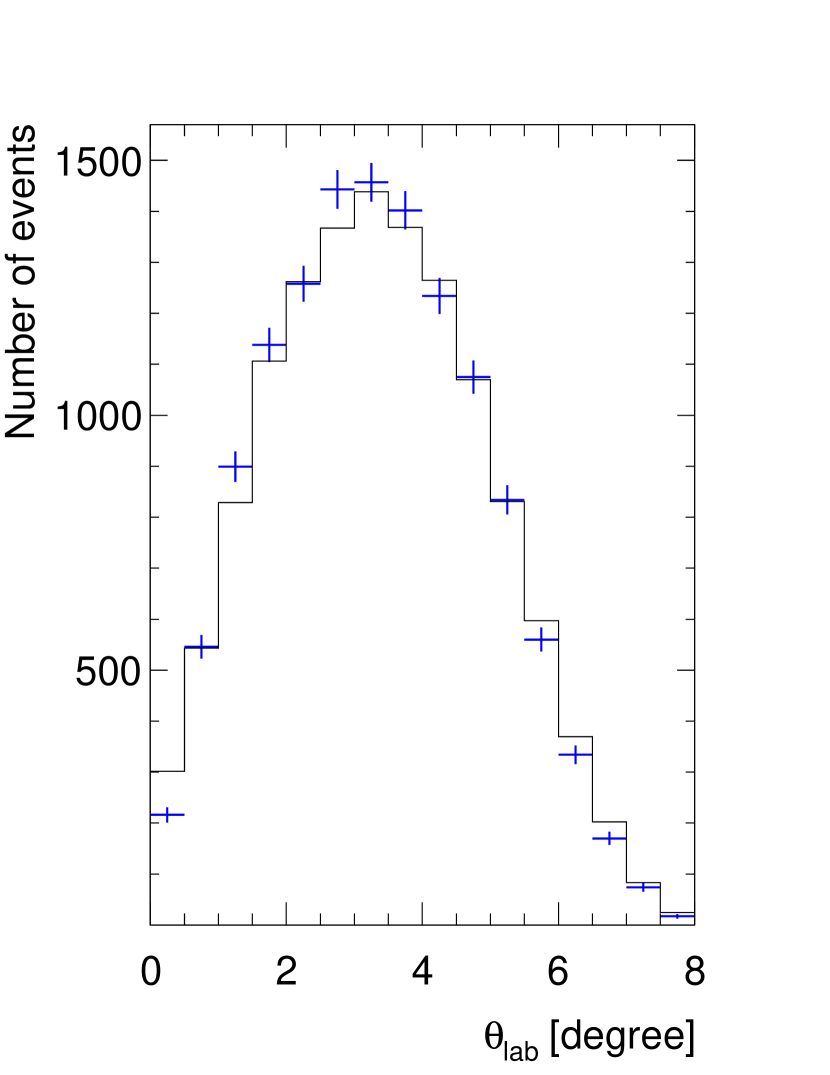
In order to investigate the acceptance of the ANKE forward detector for different reactions, a full simulation was performed based on GEANT software AGO2003 . The same track reconstruction algorithm was used in the simulation and the data analysis. In order to get as precise a description of the experiment as possible, the dispersion of the hits in the MWPC, the background hits produced by accidental coincidences, and the noise in the multiwire chambers readout electronics, as obtained from the experimental data, were also included in the simulation DYM2004 . The quality of the simulation may be judged from the distributions of the deuteron production angle in the laboratory system that are shown in Fig. 5.

4.2 Luminosity measurements
To determine the luminosity we use Eq. (4.1) and insert detailed expressions for and :
| (4.2) |
where is the count rate from the quasi-free reaction, corrected for the trigger dead time. is the number of counts in the simulation that pass all the criteria used in the experimental data processing and is the total number of simulated events. These are summed over the neutron kinetic energy, subject to the MeV/ cut, and over the given angular range. The differential cross section was taken from the database ARN1993 , where is the deuteron polar angle in the laboratory frame.
The FD detector acceptance changes rapidly with angle. In order to minimise systematic errors, the total angular range was binned and the luminosity evaluated separately for each bin. Data at the acceptance edges (the smallest and the largest angles) were less reliable, due to the greater uncertainty in the evaluation of the acceptance, and showed systematic shifts in luminosity. Such angular intervals were discarded and the average recomputed.
The values of the average luminosities determined from the reaction are given in Table 2. The errors quoted include statistical ones from the experimental counts and those introduced by the background subtraction procedure. Uncertainties coming from the SAID database ARN1993 , which were estimated by studying the experimental results in the relevant regions, are listed separately.
| Average luminosity | Measurement | SAID | |
| [GeV] | [cm-2s-1] | uncertainty | uncertainty |
| [%] | [%] | ||
4.3 The cross section
Having identified two fast protons in the final state and selected low events, the reaction was isolated on the basis of the missing-mass distributions, which are shown at three energies in Fig. 6. In addition to the dominant neutron peak, there are also many events for MeV/ that must correspond to pion production MCH2011a . However, very few of these leak into the neutron region and the background from this under the neutron peak is at most at the per cent level. This is also true for data in the individual momentum-transfer bins. Random background, which was studied using the timing information, was at the 1-3% level and could be easily subtracted.
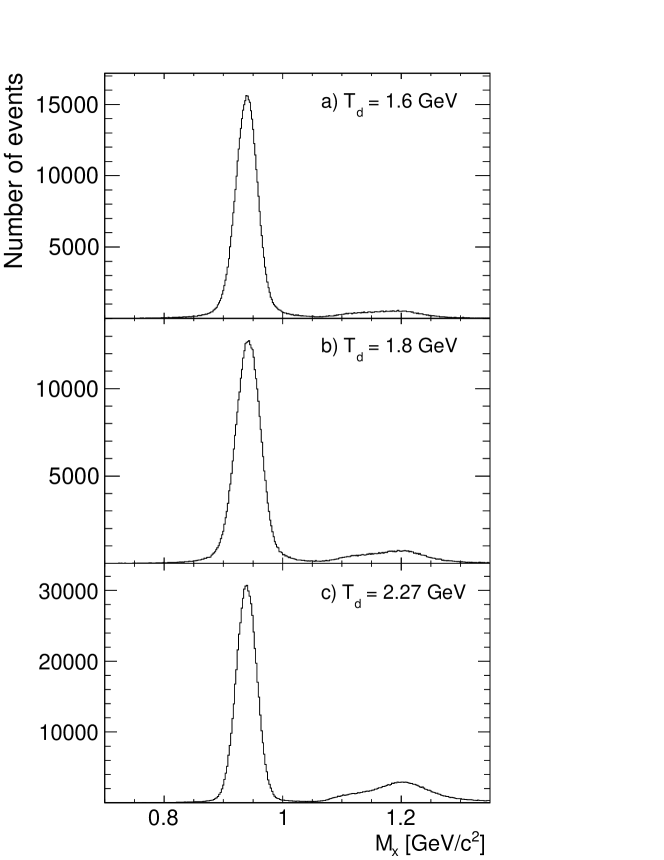
The cross section determination was performed in a similar manner to the luminosity evaluation that used the reaction. It involved the same technique for correcting the experimental count rates and estimating the detector acceptance. Since the reaction has a three-body final state, in principle the cross section is a function of five independent variables. However, within the impulse approximation, by far the most important of these are the excitation energy in the final diproton and the momentum transfer from the proton to the neutron. In accordance with Eq. (4.1), the two-dimensional differential cross section was evaluated in terms of the integrated luminosity from:
| (4.3) |
where is the corrected number of experimental events for given values of , measured in laboratory system, and . and are the total and accepted numbers of simulated events respectively. and correspond to bin widths in momentum transfer and excitation energy, respectively. The resolutions in and are about MeV/ and better than MeV, respectively.
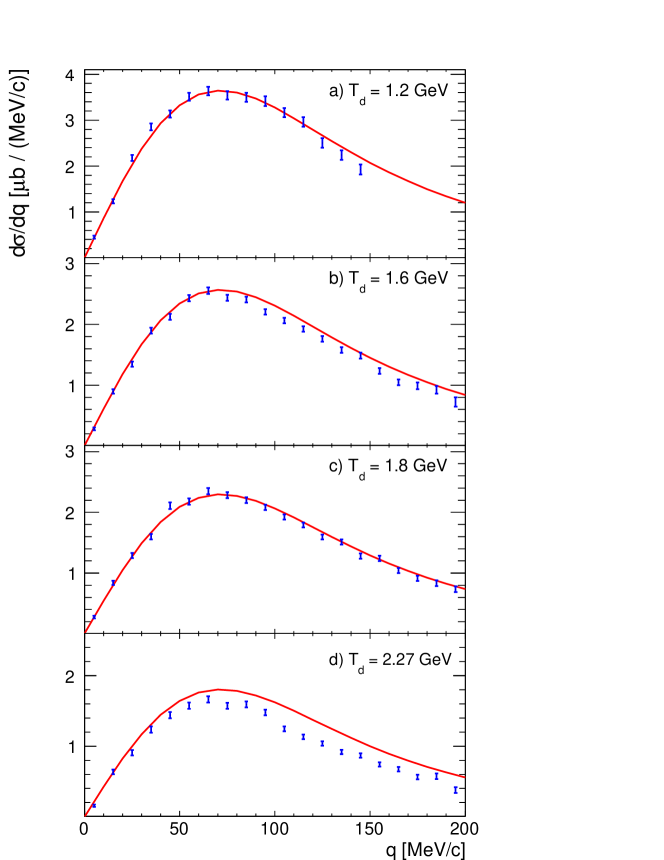
The cross sections were further integrated over MeV in order to provide the differential distribution presented in Fig. 7. This includes also the new results obtained at GeV. In addition to the statistical errors arising from the experimental count rates that are shown, there are also overall systematic uncertainties arising from the luminosity determinations, given in the Table 2. Within these uncertainties, the agreement with the theoretical impulse approximation predictions CAR1991 at , 1.6, and GeV is very encouraging and is in line with similar data analysed at 1.17 GeV CHI2009 . In contrast, the unpolarised differential cross section at GeV falls about 15% below the predictions based upon the current partial wave analysis ARN2000 . As we shall see later, similar discrepancies are found in the spin observables of the reaction but only at this highest energy.
5 Determination of deuteron analysing powers
In order to measure the deuteron analysing powers for the or other reaction, the first step has to be the identification of the polarisations of the various deuteron beams used in the experiment. With complete efficiencies in the transition units, the polarisations should approach the ideal values given in Table 1. However, this is never the case in practice and the beam polarisation must be determined separately for each of the beams used. In our earlier work at 1.17 GeV CHI2009 , a variety of nuclear reactions with known analysing powers were measured and these were used to establish values for the polarisations. These showed that the analysing powers for the reaction were well reproduced in the impulse approximation calculations CAR1991 . Since the deuteron charge-exchange reaction can be so well identified and measured at ANKE, we use this reaction itself to measure the beam tensor polarisation at the neighbouring energy of 1.2 GeV, the necessary analysing powers being taken from the impulse approximation estimates. Apart from the large counting rates, this approach has the advantage of being insensitive to the deuteron vector polarisation.
5.1 Tensor polarisation of the deuteron beam
The tensor polarisation of the deuteron beam was measured using the reaction at GeV. The circulating deuteron beam was polarised perpendicularly to the horizontal plane of the machine. As already mentioned, the beam vector () and tensor () polarisations are labeled conventionally in the reference frame of the source. In contrast, all the spin observables discussed later refer to the right-handed coordinate system of the reaction frame, where the beam defines the -direction while the stable spin axis of the beam points along the -direction, which is perpendicular to the COSY orbit.
No dependence is expected on the vector polarisation for small BUG1987 and this was checked in our earlier experiment CHI2009 . The numbers of diprotons produced at momentum transfer and azimuthal angle with respect to the -direction are given in terms of the beam polarisation by
| (5.1) |
where are the numbers for an unpolarised beam and is the relative luminosity of the polarised beam.
During the course of the polarised measurements, various configurations of the ion source were used and the beam polarisation had to be determined separately for each state. Several methods to fix the relative luminosities of a state with respect to the unpolarised mode are possible at ANKE MCH2011 . The one provided by the reaction is preferable because the number of single-track events is enormous for all beam energies. No dependence of the rates on the tensor polarisation of the deuteron beam was found for proton spectator momenta below MeV/.
The break-up data were divided into several bins of momentum transfer and distributions in were constructed for each bin and polarisation mode. The ratios to the unpolarised state were fitted using Eq. (5.1), the theoretical predictions for and being taken at mean values of in each bin. The validity of this approach was checked at GeV in the earlier experimental studies at ANKE CHI2006a . The beam polarisation in each state was taken as the weighted average over the different values of the momentum transfer.
The maximum values of were of the ideal values for the 2005 data. But, in the 2006 data, the maximum tensor polarisation dropped to of the ideal, with little change in the vector polarisation. The difference has been ascribed to the changed efficiencies of the units in the COSY deuterium ion source MCH2011 . For the high modes in Table 1, the estimated polarisation varied in range in the 2005 data and in the range in the 2006 data. The typical uncertainty in was .
The vector analysing power of the reaction is predicted to vanish in the limit BUG1987 and this was confirmed at 1.17 GeV in our earlier work CHI2009 . As a consequence, the vector polarisation of the beam is unimportant for the tensor analysing power studies carried out with the cluster target. This is no longer the case for the spin-correlation measurements with the polarised cell target. The determination of the vector polarisation of the deuteron beam in this case is described in sec. 6.
5.2 Deuteron tensor analysing powers
The deuteron Cartesian tensor analysing powers and were extracted using Eq. (5.1) in much the same way as for the polarimetry, with the beam tensor polarisation being determined at GeV. The ratios of the polarised to unpolarised corrected count rates were fitted in terms of the two free parameters and . The procedure was repeated for different polarisation states and results averaged over these source modes.
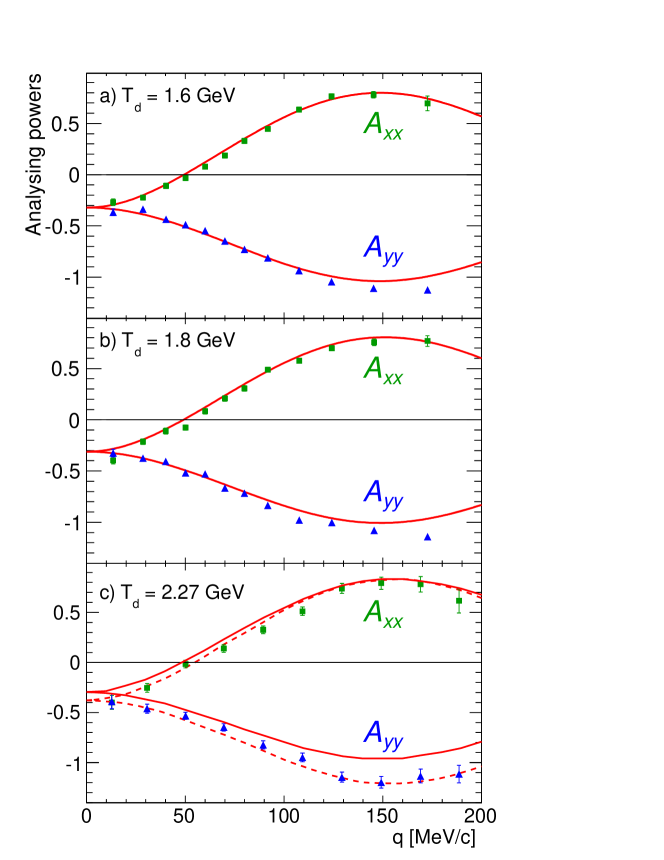
The results for the tensor analysing powers are shown in Fig. 8 at three beam energies as functions of the momentum transfer. The agreement between the experimental data and the impulse approximation predictions is very good at and 900 MeV. At these energies the SAID amplitudes ARN2000 used as input in the calculations are considered to be reliable but at 2.27 GeV, the maximum deuteron energy available at COSY, the agreement is much worse. Since there are also severe discrepancies in the unpolarised cross section at this energy, it is natural to question whether there might be deficiencies in the SAID analysis at this energy.
The experimental value of in the forward direction () is significantly more negative than the predictions using the SAID amplitudes at 1.135 GeV. However, it can be seen from Eq. (2.4) that a relative reduction in the amplitude might improve the predictions. To check this possibility, the predictions were recomputed with the amplitude being reduced uniformly by 25%. This gives the much better overall agreement with the data that is demonstrated by the dashed curves in the lower panel of Fig. 8. This therefore suggests that the current SAID amplitudes ARN2000 might overestimate the relative strength of the at small but further proof is required and this is furnished by the measurements of the spin correlations.
6 Determination of the deuteron-proton spin-correlation parameters
In experiments with the unpolarised cluster-jet target, the reaction is only sensitive to the tensor polarisation of the beam and the values of this could be established by using the reaction itself at the 1.2 GeV calibration energy, as described in sec. 5. In contrast, in order to determine the spin-correlation parameters and , one has first to determine the vector polarisation of the deuteron beam as well as the polarisation of the hydrogen in the target cell. The basis of both measurements is the quasi-free reaction which, at small spectator momenta, is insensitive to the deuteron tensor polarisation.
6.1 The beam and target polarimetry
The polarisation of the hydrogen target and the vector polarisation of the deuteron beam were both determined using the quasi-free reaction. Now it is well known that, if one integrates over all Fermi momenta inside the deuteron, the nucleon polarisation in the deuteron would be reduced from that of the deuteron by a factor
| (6.1) |
where is the deuteron -state probability. However, since the -state effects vanish like , the dilution of the polarisation signal by the deuteron -state is negligible if only data with MeV/ are used in the subsequent analyses. Such a cut preserves a large part of the statistics.
For an unpolarised deuteron beam incident on a polarised hydrogen target with spin-up ( and spin-down (), the asymmetry ratio between polarised and unpolarised yields has the form:
| (6.2) |
where and angles are polar and azimuthal angles, respectively, of the detected particle and is the target polarisation. Isospin invariance requires the analysing powers in the and reactions to be identical and there are numerous measurements of the proton analysing power of the latter in the 600 MeV region ARN1993 . Data in the centre-of-mass system were used in the analysis. The polar and azimuthal angles of the deuteron were determined according to the procedure described in sec. 4.1.
6.2 The reaction with the cell target
The cell introduces additional complications in the determination of the angles because of the spread of the interaction points along the cell axis. The reconstruction of the longitudinal vertex coordinate is therefore required for each event. For a two-track event, this can be done with the use of the arrival-time difference for two particles, measured in the scintillation hodoscope. In our kinematical conditions, where the deuteron is at least twice as slow as the proton, such a difference is a sensitive function of . The three-momenta of the two particles and the and coordinates of the vertex are found through an overall fit procedure that uses the information from both the wire chambers and the hodoscope.
Figure 9 shows the distribution of interaction points in the - plane. In addition to helping in the angular determination, the vertex reconstruction allows one to make cuts along the cell axis to minimise the background from the rest gas that is spread throughout the target chamber.
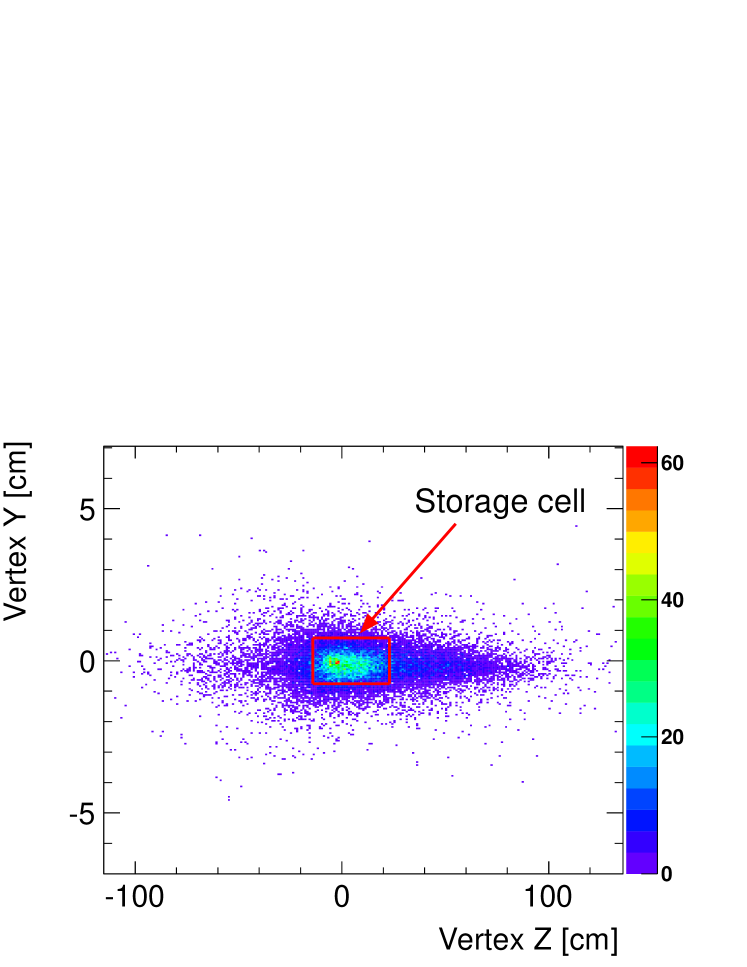
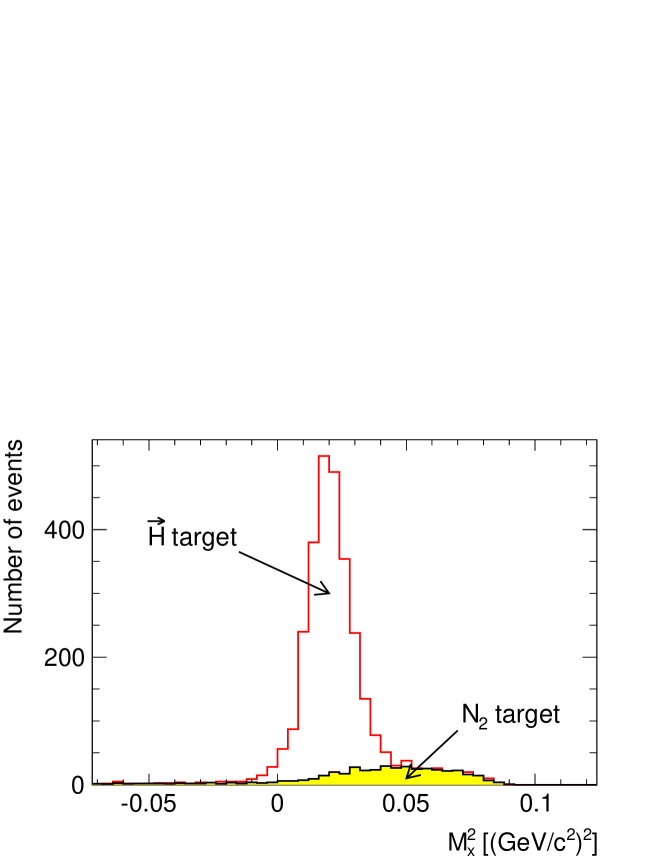
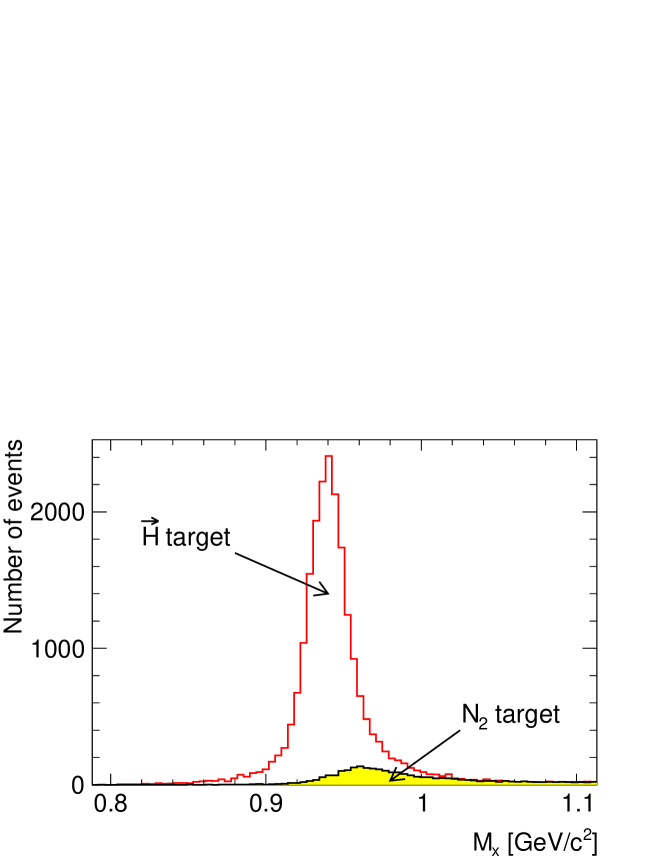
A second major complication arises from the scattering of the beam halo particles on the cell walls. This can produce additional background that would dilute the analysing power signal. As mentioned earlier, the dedicated beam development enabled the bulk of the beam to pass through the cell without hitting the walls. For this reason, recording data with an empty cell would take much more time to collect sufficient statistics to determine the background. Additional runs were therefore recorded where nitrogen gas was injected into the cell to simulate the shape of the background (see details in Ref. GRI2007 ). The background subtraction was performed for each polarisation state by using the missing-mass distributions for the hydrogen and nitrogen data. One such example is shown in Fig. 10.
6.3 The target and beam polarisation
The target polarisation was measured using data taken with an unpolarised deuteron beam at GeV. After vertex reconstruction, the data were binned in deuteron cm angles. The background subtraction was performed separately for each bin and distributions in built for both spin-up and spin-down modes. The weighted sum of the two data sets from different target polarisations was taken as the unpolarised mode. Weights were determined according to the relative asymmetries with respect to the unpolarised state. The ratios of the difference to the sum of the data for the two polarised modes were than fitted with a linear function in and the value of the product deduced. Taking the mean analysing power in each bin from the SAID database ARN1993 , this gave and .
Using the quasi-free reaction, in an analogous way to that for the target polarisation, the vector polarisation of the deuteron beam (state 3 in Table 1), was determined to be .
6.4 Measurement of the deuteron-proton spin-correlation parameters
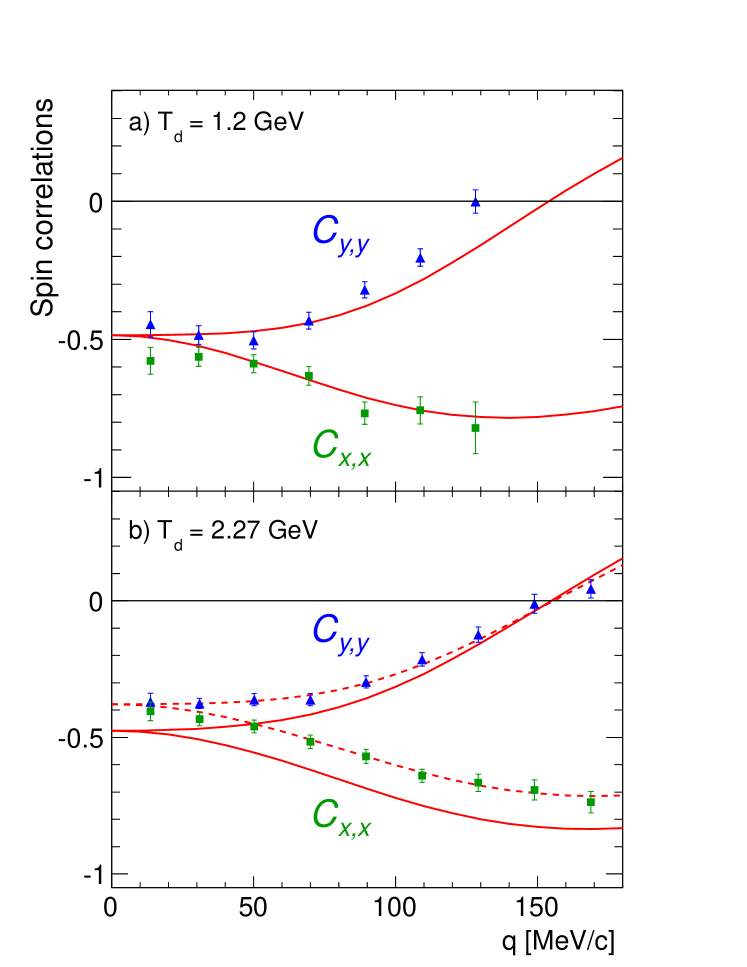
The double-polarised experimental data from the 2009 beam time offers an excellent opportunity for studies of the spin-correlation parameters and to determine the relative phases of the spin-spin amplitudes KAC2007 . Furthermore, it is of interest to see whether the suspected deficiencies in the SAID amplitudes at highest beam energy are reflected also in the spin correlations.
The background subtraction was carried out in the same way as for the reaction, with the nitrogen gas data simulating the shape of the background, as illustrated in Fig. 11.
In order to extract the spin-correlation parameters from the reaction, no tensor polarised deuteron beam modes were used (see Table 1). In this case the ratio of the polarised to unpolarised yields has the form OHL1972 :
| (6.3) |
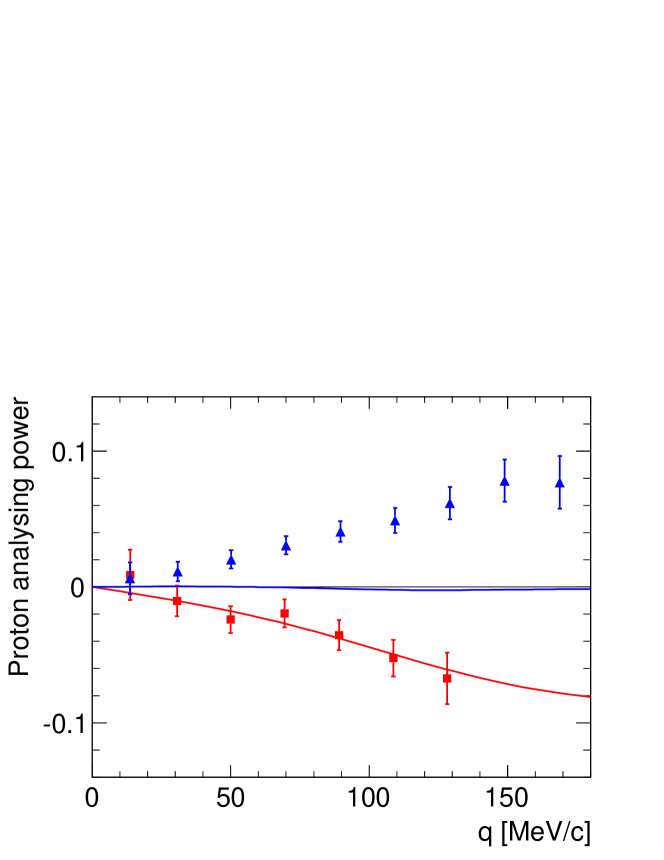
Although the experiment was designed for the study of spin correlations, by analysing first the polarised target yields for an unpolarised deuteron beam, we could obtain the dependence of the target analysing power on that is presented in Fig. 12 at 1.2 and 2.27 GeV. This is predicted very well in impulse approximation at the lower energy but at 2.27 GeV the corresponding prediction can hardly be distinguished from the -axis on this scale. Equation (2.4) then suggests that there must be a serious problem also with the SAID determination of the spin-orbit amplitude at 1.135 GeV.
In impulse approximation vanishes BUG1987 , which is consistent with our measurements at 1.17 GeV CHI2009 , and this simplifies the determination of and using data with polarised beam and polarised target. After binning the normalised counts in intervals in , the dependence in Eq. (6.3) allowed us to extract the and coefficients separately. Note, that the resolutions in both and in the cell-target data are similar to those achieved with the cluster target.
The spin-correlation data for an MeV cut are compared with theoretical predictions in Fig. 13. The good agreement with the experimental points at GeV shows that the two relative phases between the spin-spin amplitudes are well predicted by the SAID program at this energy. It can, however, not come as a complete surprise to find that there are serious discrepancies at GeV but, as shown by the dashed line, these largely disappear if the SAID amplitude is scaled uniformly by a factor of 0.75, i.e., by the same factor that brought agreement for the and observables!
7 Conclusions and Outlook
We have measured the unpolarised differential cross section and the Cartesian tensor analysing powers in the reaction for small momentum transfers between the proton and neutron by using a hydrogen cluster target in combination with a tensor polarised deuteron beam. The cross section data at 1.2, 1.6, and 1.8 GeV are very well described in impulse approximation using the current SAID solution for the amplitudes. These amplitudes suffer from much bigger ambiguities at higher energies and the corresponding cross section prediction is about 15% too high compared to our results at 2.27 GeV, though one must bear in mind the 6% uncertainty in the overall normalisation of the data at this energy. The suspicion must fall on the SAID solution, which predicts an unpolarised cross section that may be up to 10% too large BIZ1975 , of which the spin-dependent contribution is also about 10% too large SHA2009 .
The description of and is also very good at the three lower energies but much poorer at 2.27 GeV. Since one would expect the impulse approximation to become better as the energy is raised, attention is once again focussed on the SAID amplitudes. The strength of in charge exchange relative to is determined by the spin-transfer parameters and , but there are no measurements of these quantities in the relevant angular and energy region. This limits severely the SAID predictive power for the deuteron tensor analysing powers. To fit our data, we have reduced the SAID prediction for uniformly by 25% and this reproduces the results much better. Although this might be improved further by introducing a -dependence in this factor, the present data do not justify such a refinement.
By replacing the unpolarised hydrogen cluster-jet target by a polarised hydrogen gas cell, it was possible to measure the spin-correlation coefficients and in the reaction with a vector polarised deuteron beam, but only at 1.2 and 2.27 GeV. The behaviour seen here is similar to that for the other observables, with a good description being achieved at 1.2 GeV whereas at 2.27 GeV a reduction of the order of 25% seems to be required in the input.
As a by-product of the polarised cell experiment, we were also able to measure the proton analysing power in the reaction. As with the other observables, impulse approximation reproduces well the small signal at 1.2 GeV but fails completely at 2.27 GeV. This suggests that the SAID solution for the -amplitude is also unreliable at the higher energy.
In summary, the fact that the impulse approximation with the current SAID input reproduces well all our data below 1 GeV per nucleon gives us confidence that the charge-exchange methodology works well. However, the discrepancies seen at the higher energy can only be resolved by reducing the strength of the spin-spin amplitudes, especially in the longitudinal direction, while increasing the spin-orbit contribution. It is therefore evident that the charge exchange on the deuteron contains valuable information on the neutron-proton amplitudes. The challenge is to get this used inside the SAID program.
The experiments reported here were carried out up to the maximum deuteron energy available at COSY. To go higher in energy at this facility, an experiment would have to be undertaken in inverse kinematics with a polarised proton incident on a polarised deuterium gas cell GRI2007 , with the two slow protons being detected in the Silicon Tracking Telescopes SCH2003 . This will allow the studies reported here to be continued up to 2.9 GeV per nucleon KAC2005 ; CHI2012 .
Acknowledgements.
We are grateful to the accelerator crew for the reliable operation of COSY and the deuteron polarimeters. We would like to thank I. I. Strakovsky for many useful discussions and for providing us with values of the current SAID neutron-proton amplitudes. The work was supported by the COSY FFE programme and the Shota Rustaveli National Science Foundation Grant 09-1024-4-200.References
-
(1)
R. A. Arndt, I. I. Strakovsky, R. L. Workman,
Phys. Rev. C 62, 034005 (2000);
http://gwdac.phys.gwu.edu. - (2) G. Bizard et al., Nucl. Phys. B 85, 14 (1975).
- (3) N. W. Dean, Phys. Rev. D 5, 1661 (1972); N. W. Dean, Phys. Rev. D 5, 2832 (1972).
- (4) V. I. Sharov et al., Eur. Phys. J. A 39, 267 (2009).
- (5) F. Lehar, C. Wilkin, Phys. Part. Nuclei Lett. 7, 235 (2010).
- (6) D. V. Bugg, C. Wilkin, Nucl. Phys. A 467, 575 (1987).
- (7) C. Ellegaard et al., Phys. Rev. Lett. 59, 974 (1987).
- (8) S. Kox et al., Nucl. Phys. A 556, 621 (1993).
- (9) A. Kacharava, F. Rathmann, C. Wilkin, Spin Physics from COSY to FAIR, COSY proposal 152 (2005), arXiv:nucl-ex/0511028.
- (10) D. Chiladze et al., Eur. Phys. J. A 40, 23 (2009).
- (11) J. Carbonell, M. B. Barbaro, C. Wilkin, Nucl. Phys. A 529, 653 (1991).
- (12) K. Grigoryev et al., AIP Conf. Proc. 915, 979 (2007).
- (13) M. Mikirtychyants et al., submitted to Rev. Sci. Instr.; arXiv:1212.1840 [physics.ins-det].
- (14) D. Chiladze et al., Phys. Lett. B 637, 170 (2006).
- (15) D. Chiladze et al., Phys. Rev. ST Accel. Beams 9, 050101 (2006).
- (16) M. B. Barbaro, C. Wilkin, J. Phys. G 15, L69 (1989).
- (17) S. Barsov et al., Nucl. Instrum. Methods A 462, 364 (2001).
- (18) R. Maier et al., Nucl. Instrum. Methods A 390, 1 (1997).
- (19) A. Khoukaz et al., Eur. Phys. J. D 5, 275 (1999).
-
(20)
A. Kacharava et al., Measurement
of the charge-exchange
reaction with polarised beam and target; COSY proposal 172 (2007);
www2.fz-juelich.de/ikp/anke/en/proposal/ - (21) D. Mchedlishvili et al., J. Phys.: Conf. Ser. 295, 012099 (2011).
- (22) R. Engels et al., AIP Conf. Proc. 980, 255 (2008).
- (23) F. Rathmann et al., AIP Conf. Proc. 675, 553 (2003).
- (24) M. Mikirtychyants et al., J. Phys.: Conf. Ser. 295, 012148 (2011).
- (25) R. Engels et al., Rev. Sci. Instrum. 74, 4607 (2003).
-
(26)
H. J. Stein et al., Atomic Energy
94, 24 (2003); H. J. Stein et al., Proc. 18th
Conf. Charged Particle Accelerators (RUPAC 2002), ed. I. N. Meshkov
(NRCRF, Obninsk, 2004) Vol. 1, p. 220,
arxiv.org/abs/1101.5963/. - (27) V. Kamerdzhiev et al., Nucl. Instrum. Methods A 532, 285 (2004).
- (28) S. Dymov et al., Part. Nucl. Lett. 1, 40 (2004).
-
(29)
Pluto WEB page:
http://www-hades.gsi.de/computing/pluto/html/PlutoIndex.html. - (30) M. Lacombe et al., Phys. Lett. 101B, 139 (1981).
- (31) R. A. Arndt, I. I. Strakovsky, R. L. Workman, D. V. Bugg, Phys. Rev. C 48, 1926 (1993).
-
(32)
S. Agostinelli et al., Nucl. Instrum. Methods A 506, 250 (2003);
http://geant4.web.cern.ch/geant4/. -
(33)
D. Mchedlishvili, PoS (STORI’11), 040 (2011),
http://pos.sissa.it/ - (34) G. G. Ohlsen, Rep. Prog. Phys. 35, 717 (1972).
- (35) R. Schleichert et al., IEEE Trans. Nucl. Sci. 50, 301 (2003).
-
(36)
D. Chiladze, A. Kacharava, and C. Wilkin,
COSY proposal 212 (2012);
www2.fz-juelich.de/ikp/anke/en/proposal/.