Testing Diagnostics of Nuclear Activity and Star Formation in Galaxies at **affiliation: Based on observations with the NASA/ESA Hubble Space Telescope, obtained at the Space Telescope Science Institute, which is operated by AURA Inc, under NASA contract NAS 5-26555. Also based on data obtained at the W. M. Keck Observatory, made possible by the generous financial support of the W. M. Keck Foundation and operated as a scientific partnership among Caltech, the University of California, and NASA.
Abstract
We present some of the first science data with the new Keck/MOSFIRE instrument to test the effectiveness of different AGN/SF diagnostics at . MOSFIRE spectra were obtained in three -band multi-slit masks in the GOODS-S field, resulting in two hour exposures of 36 emission-line galaxies. We compare X-ray data with the traditional emission-line ratio diagnostics and the alternative mass-excitation and color-excitation diagrams, combining new MOSFIRE infrared data with previous HST/WFC3 infrared spectra (from the 3D-HST survey) and multiwavelength photometry. We demonstrate that a high ratio is insufficient as an AGN indicator at . For the four X-ray detected galaxies, the classic diagnostics ( vs. and ) remain consistent with X-ray AGN/SF classification. The X-ray data also suggest that “composite” galaxies (with intermediate AGN/SF classification) host bona-fide AGNs. Nearly 2/3 of the emission-line galaxies have nuclear activity detected by either X-rays or the classic diagnostics. Compared to the X-ray and line ratio classifications, the mass-excitation method remains effective at , but we show that the color-excitation method requires a new calibration to successfully identify AGNs at these redshifts.
Subject headings:
galaxies: active — galaxies: nuclei — galaxies: Seyfert — galaxies: fundamental parameters1. Introduction
Every massive nearby galaxy hosts a supermassive black hole (SMBH), and the mass of the SMBH correlates with the mass of the host galaxy bulge (Magorrian et al., 1998). Theoretical simulations suggest this connection exists because past active galactic nucleus (AGN) phases of rapid SMBH growth were associated with periods of massive star formation (SF) in the host galaxy (e.g., Di Matteo, Springel, & Hernquist, 2005; Hopkins et al., 2006). Observations of AGN frequency, including both weak Seyferts and powerful quasars, in different host galaxy types over the cosmic time can be used to directly test models of coupled SMBH-galaxy growth.
Selection by blue optical color, X-ray emission, or infrared (IR) color can be used to select powerful quasars to very high redshifts, but these methods are less effective for finding obscured or moderately-accreting AGNs. Instead the most efficient way to find moderate-luminosity AGNs is by their unique emission line signature. Compared to typical star formation processes, the higher-ionization radiation of an AGN tends to increase the ratios between rest-frame optical collisionally excited “forbidden” lines and hydrogen recombination lines (Baldwin, Phillips & Terlevich, 1981; Kewley et al., 2006). In particular the line ratios , , and are typically used in the classic “BPT” and “VO87” diagnostics (Baldwin, Phillips & Terlevich, 1981; Veilleix & Osterbrock, 1987): the wavelength proximity of each line pair means the ratios are nearly insensitive to reddening. In the standard AGN unified model (Antonucci et al., 1993) these narrow emission lines can be detected even if the X-ray and ultraviolet (UV) ionizing radiation source is absorbed by anisotropic obscuration. The AGN line ratio signature also remains visible for SMBHs of moderately low accretion rates () which are otherwise dominated by their host galaxy starlight (e.g., Kauffmann & Heckman, 2009).
There has been great success in using line ratio diagnostics to select AGNs and characterize their hosts at (e.g., Kauffmann et al., 2003b; Heckman et al., 2004; Yan et al., 2006; Schawinski et al., 2007). But extending a similar AGN census to is difficult because the and ratios redshift to the IR, where ground-based spectroscopy has historically been expensive. A high ratio alone is degenerate between nuclear activity and metal-poor [Hii] regions, and the or line ratio is generally necessary to distinguish AGNs from inactive galaxies with low metallicity. Some authors have suggested combining with bluer emission line ratios, like (Lamareille et al., 2004) or (Trouille et al., 2011). However these bluer lines are typically weaker, making them difficult to apply to distant galaxies. Instead it is possible to exploit the correlation of metallicity with color and stellar mass (Tremonti et al., 2004) to altogether eliminate a second line ratio. These modified AGN/SF diagnostics use to measure excitation, but replace the ratio with rest-frame color (Yan et al., 2011) or stellar mass (Juneau et al., 2011). AGN selection using the“color-excitation (CEx)” and “mass-excitation (MEx)” methods agree well with the classic line ratio diagnostics at and X-ray selection at .
It is less clear if the BPT, VO87, CEx, and MEx AGN/SF diagnostics are directly applicable to higher redshift. Star formation processes at are generally different than in nearby galaxies, with higher gas and dust fractions, younger stellar populations, lower metallicities, and higher star formation rates (e.g., Papovich et al., 2005; Reddy et al., 2006; Tacconi et al., 2009; Shim et al., 2011). Some authors argue that the classical line ratio diagrams are unreliable at high redshift because local starburst galaxies with SF rates typical of galaxies tend to have similarly high and ratios (Liu et al., 2008; Brinchmann, Pettini & Charlot, 2008).
In this work we directly test the effectiveness of the classical line ratio, color-excitation, and mass-excitation diagnostics for identifying AGN at . We use observations of 36 galaxies at (mean ) with the new MOSFIRE multi-object spectrograph (McLean et al., 2010, 2012) on the Keck telescope. The new MOSFIRE data are coupled to X-ray observations, previous spectroscopy, and multiwavelength photometry for stellar masses and rest-frame colors.
2. Observational Data
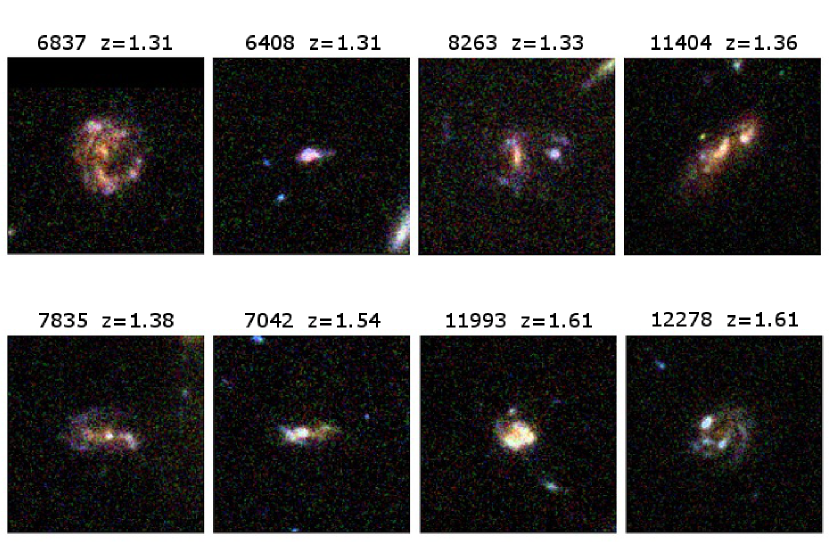
We study the emission line ratios, rest-frame colors, stellar masses, and X-ray properties of 36 galaxies in the Great Observatories Origins Deep Survey-South field (GOODS-S, Giavalisco et al., 2004). The targets were selected from Hubble Space Telescope (HST) Wide Field Camera 3 (WFC3) G141 grism observations as part of the 3D-HST survey (Brammer et al., 2012). The initial selection required and a detected [Oiii] emission line in the redshift range . The flux-limited sample includes a mix of star-forming, AGN, and composite galaxies. New Keck/MOSFIRE -band spectra were obtained for the and line ratios. The GOODS-S field also includes tremendously deep optical and IR photometry (Dahlen et al., 2010) and 4 Ms of X-ray coverage (Xue et al., 2011). Details on the WFC3 grism, MOSFIRE, and photometric data are provided below. Table 1 includes the full suite of line ratios, colors, and masses for the 36 galaxies. ACS color-composite images of eight representative galaxies are shown in Figure 1. In general the sample includes disk-dominated and clumpy morphologies without strong point sources, similar to the clumpy galaxies and AGN hosts of Bournaud et al. (2012).
2.1. Keck/MOSFIRE
MOSFIRE observations were performed Sept 14-15 and Oct 10 2012, with three -band masks in the GOODS-S field. All targets were observed in two dither positions within slits, with total on-target exposure times of two hours each. The resulting wavelength coverage is m with a spectral resolution of (5 per resolution element). Spectra were reduced, sky-subtracted, wavelength-calibrated, and 1D-extracted using the public MOSFIRE data reduction pipeline111http://code.google.com/p/mosfire/. The wavelength calibration was very accurate, with shifts of from previous spectroscopic redshifts. The spectra were not flux-calibrated: flux calibration is unnecessary for ratios of closely separated emission lines.
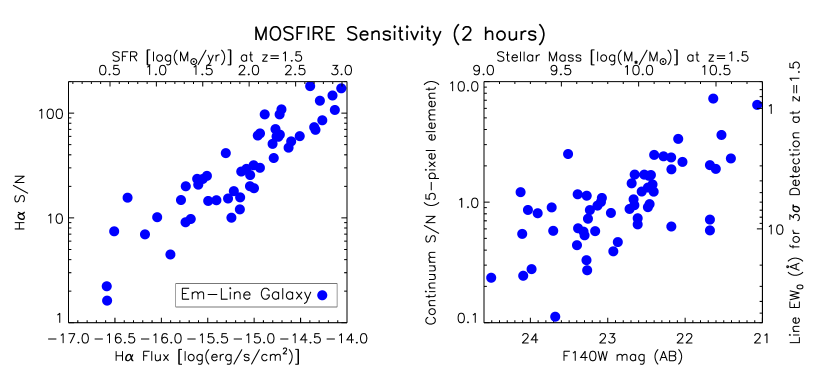
Figure 2 shows the sensitivity of MOSFIRE, for both emission lines and continuum measurements, in our two-hour exposures. The left panel shows the emission-line signal-to-noise (S/N) with line flux and star formation rate (SFR), using the Kennicutt (1998) relation to convert line flux at to SFR. The right panel shows the continuum S/N (measured over a resolution element of 5 pixels) with F140W magnitude from 3D-HST observations. Continuum S/N is translated to the minimum rest-frame equivalent width (EW0) for a 3 line detection at , and F140W magnitude is converted to stellar mass using the relation (derived using the stellar masses from SED fitting in Section 2.3). In general, our sensitivity measurements agree well with the estimates provided on the MOSFIRE website222http://irlab.astro.ucla.edu/mosfire/.
2.2. HST/WFC3 G141 Slitless Grism
The GOODS-S field contains publicly available HST/WFC3 G141 grism spectra to 2-orbit depth as part of the 3D-HST survey (Brammer et al., 2012). We reduced the data using the aXe software (Kümmel et al., 2009, available at http://axe.stsci.edu/axe/), producing 2D and 1D wavelength- and flux-calibrated spectra with a wavelength range of m. The grism resolution is for a point source (46.5Å/pixel) and somewhat worse for our extended galaxies. Spectra were inspected to identify contamination by neighboring objects: all of the objects studied here have H and [Oiii] emission lines unaffected by contamination.
2.3. Ancillary Photometry
The GOODS-S field has well-sampled spectral energy distributions (SEDs) from UV to IR wavelengths (Dahlen et al., 2010). The deep photometry, with high-confidence spectroscopic redshifts from MOSFIRE, allows for robust estimates of rest-frame colors and stellar masses for galaxies. These quantities are computed following the methods of the Rainbow database333https://rainbowx.fis.ucm.es/Rainbow_Database/ (Barro et al., 2011). First, the observed photometry is transformed to the rest-frame using the spectroscopic redshift. The rest-frame SED is then fitted to a grid of Bruzual & Charlot (2003) models characterized by exponentially declining star-formation histories, a Chabrier (2003) initial mass function, and a Calzetti (2001) extinction law. Stellar mass and rest-frame photometry are measured from the best-fit template. The well-sampled SED guarantees that the rest-frame color is interpolated rather than extrapolated.
The GOODS-S field also contains the deepest X-ray data in the sky, with 4 Ms of Chandra observations (Xue et al., 2011). Four of the 36 galaxies in this study are X-ray detected: three of these are hard sources with erg/s and are classified as AGNs by Xue et al. (2011), while one has soft X-ray emission consistent with star formation. While the relation indicates that can also produce erg/s (Lehmer et al., 2010; Mineo et al., 2012), such SFRs represent the extreme upper end of our sample (Figure 2). Indeed, all three of the sources classified as AGNs have X-ray luminosities at least 1.5 dex higher than expected by their H-derived SFRs. The X-ray sources are marked in Table 1, and we use the three X-ray AGNs as “truth” for testing the line ratio AGN/SF diagnostics in Section 4.
3. AGN/SF Diagnostics
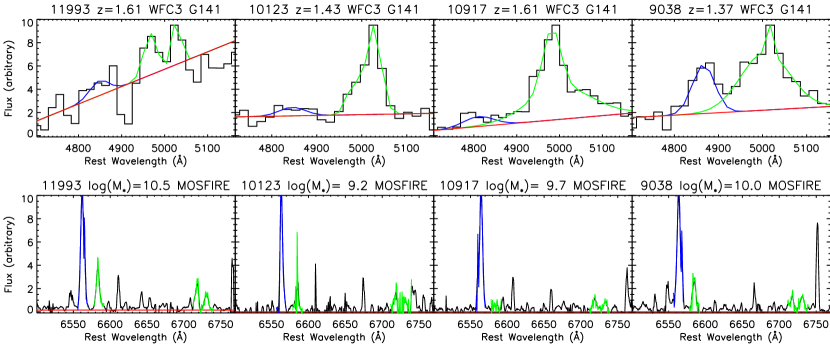
We compare the classical line ratio with the color-excitation and mass-excitation AGN/SF diagnostics, using emission line ratios measured from the spectra and photometry-derived rest-frame colors and stellar masses. The MOSFIRE -band spectra provide [Nii], [Sii], and H fluxes, while H and [Oiii] are measured from the WFC3 grism spectra. Examples of the emission-line fitting are shown in Figure 3.
For the high-resolution MOSFIRE spectra, a continuum is fit across the emission line regions by splining the 50-pixel smoothed continuum. The emission line intensities are then computed simply as the sum of the continuum-subtracted flux in each of the wavelength regions (H), ([Nii]), and (both [Sii] lines).
Line flux measurements in the low-resolution WFC3 grism spectra are more difficult because the H and [Oiii] lines are blended. For the grism spectra we subtract a linear continuum over the wavelength region and then fit three Gaussians, each of which are restricted to be within (1200 km s-1) of the line centers (, , and ). The [Oiii]5007 flux is computed as of the sum of the blended [Oiii] Gaussians (Storey & Zeippen, 2000).
Errors in line fluxes and ratios are calculated by bootstrapping 10 000 realizations of the resampled data. These errors accurately quantify the difficulty in line fitting when there is significant contamination by sky lines in MOSFIRE or nearby objects in the WFC3 grism. We use upper limits for undetected emission lines.
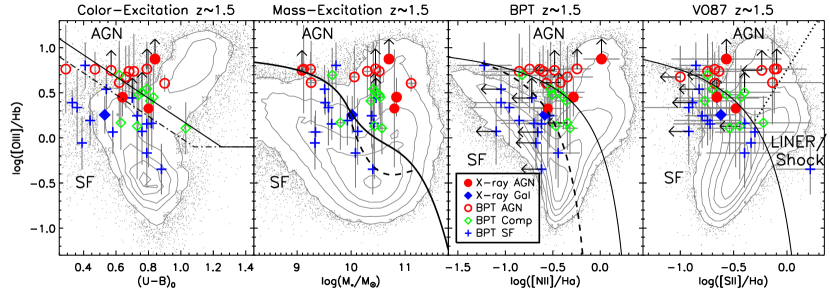
Figure 4 presents the color-excitation and mass-excitation diagrams along with the traditional BPT ( vs. and vs. ) AGN/SF diagnostics for the galaxies. The solid lines give the AGN/SF separation line defined for each diagram (CEx: Yan et al. 2011; MEx: Juneau et al. 2011, BPT and VO87: Kewley et al. 2006), with AGNs having above this line and star-forming galaxies lying below. Each panel also includes a comparison sample of galaxies from the Sloan Digital Sky Survey (SDSS, York et al., 2000) MPA-JHU value-added DR7 catalog444http://www.mpa-garching.mpg.de/SDSS/. These galaxies have emission line and stellar mass measurements described by Tremonti et al. (2004) and Kauffmann et al. (2003a), with rest-frame magnitudes calculated using the kcorrect IDL software (Blanton & Roweis, 2007). The galaxies are color-coded according to their Kewley et al. (2006) AGN/SF classification as follows:
None of the galaxies meet the LINER/Shock criteria, although the elevated ratios of several galaxies classified as star-forming (by their and ratios) support the conclusion of Yan & Blanton (2012) that such systems are excited by shocks rather than AGN ionization.
Galaxies at have typically higher ratios than galaxies, in agreement with previous studies (e.g., Liu et al., 2008; Wright et al., 2010; Trump et al., 2011). However this is not necessarily because galaxies are more likely to be AGNs: low-metallicity star-forming galaxies (in the upper left of each panel in Figure 4) are also more likely at . An elevated ratio is insufficient for AGN identification at .
4. AGN Identification at
Determining the effectiveness of each AGN/SF diagnostic requires knowledge of the “true” AGN population. The X-ray data provide an independent AGN/SF classification method. For the four X-ray detected galaxies, the X-ray classifications of Xue et al. (2011) generally agree with the Kewley et al. (2006) classifications: the three X-ray AGNs have emission line ratios indicative of either AGNs or composite AGN+SF systems, while the X-ray galaxy has star-forming emission-line ratios. The classic AGN/SF line ratio classifications remain accurate for the four X-ray detected galaxies at .
The X-ray detection of galaxies in or near the “composite” region, with line ratios intermediate between AGN and SF, implies that these objects do in fact host accreting AGNs. These data are in contrast with Liu et al. (2008) and Brinchmann, Pettini & Charlot (2008), who argued that AGN/SF composite galaxies at are starbursts with unusual gas properties and no significant AGN. Galaxies in the composite region may host starbursts, but the X-ray data imply that they also host genuine AGNs. Indeed, many studies suggest a connection between star formation activity and AGN accretion (e.g., Kauffmann et al., 2003b; Trump et al., 2012). The analyses of Wright et al. (2010) and Trump et al. (2011), with spatially-resolved emission line ratio gradients, provide additional evidence that AGN/SF composite galaxies host nuclear activity.
The lack of an X-ray detection in the other 32 galaxies does not mean that they lack AGNs. X-rays surveys are less sensitive to moderate-luminosity AGNs in galaxies of lower stellar masses (Aird et al., 2012), and all three X-ray detected AGNs have the highest stellar masses in our sample (). X-ray surveys are also insensitive to heavily obscured AGNs. Because the Kewley et al. (2006) classifications match the X-ray data for the high-mass X-ray detected galaxies, we conclude that these classifications are robust for galaxies. Of the 32 X-ray undetected galaxies, those identified as AGNs by their line ratios are presumably undetected because they have low stellar masses or are X-ray obscured.
The total number of AGNs from the combined X-ray and line ratio classifications is 11/36, with an additional 10/36 AGN/SF composite galaxies. Thus about 1/3 of our emission-line galaxies are AGN-dominated, and nearly 2/3 have some AGN component. This is significantly higher than the 15% AGN and composite fraction at (Kauffmann et al., 2003b), although this may be partly driven by our emission-line selection.
The mass-excitation method remains generally consistent with the BPT/VO87 and X-ray classifications at . Juneau et al. (2011) emphasize that a probabilistic approach is more meaningful with the MEx method than simply classifying individual galaxies by the AGN/SF dividing line. Following Juneau et al. (2011), the MEx probability analysis indicates that 18/36 galaxies are AGNs, matching the high AGN fraction of the X-ray and BPT/VO87 classifications.
Meanwhile the color-excitation method, as calibrated at , identifies only 7 of the 12 AGNs classified by X-rays or line ratios. This is because a galaxy has significantly higher SFR and lower metallicity, and is consequently bluer, than a galaxy of the same mass (Erb et al., 2006; Mannucci et al., 2010). While the change in metallicity is apparent in the increasing ratio, the change in star formation rate is not. Shifting the original AGN/SF division of Yan et al. (2011) by 0.2 mags provides a much more effective separation between AGNs from SF galaxies at . Our data suggest the following recalibrated color-excitation AGN/SF demarcation at :
5. Summary
We use some of the first Keck/MOSFIRE data to test various diagnostics of AGN/SF activity in 36 emission-line galaxies at . Although only four sources are X-ray detected, their X-ray data suggest that the classic emission-line ratio diagnostic remains effective at , and that “composite” galaxies (of intermediate AGN/SF classification) do in fact host accreting AGNs. We find that nearly 2/3 of our emission-line galaxies have some AGN contribution detected by X-rays or line ratios. Among alternative AGN/SF diagnostics, the mass-excitation method remains consistent with X-ray and line ratio classification at , but the color-excitation method does not. We suggest a recalibration for AGN/SF classification with the color-excitation diagnostic at . A larger set of galaxies and emission line measurements will allow a more detailed calibration and estimation of the AGN fraction at .
| ID | RA | Dec | aaThe and line flux measurements come from the WFC3 grism data. | bbThe , , and emission line fluxes are measured from the MOSFIRE data. | bbThe , , and emission line fluxes are measured from the MOSFIRE data. | ccfootnotemark: | ccfootnotemark: | |
|---|---|---|---|---|---|---|---|---|
| - | (deg) | (J2000) | - | - | - | - | (mag) | |
| 8025 | 53.07059 | -27.75539 | 1.303 | 0.45 | 0.24 | 1.65 | 10.40 | 0.88 |
| 6837 | 53.12799 | -27.77140 | 1.306 | 5.82 | 0.57 | 0.80 | 10.45 | 0.79 |
| 9956 | 53.09090 | -27.73119 | 1.307 | 5.61 | 0.33 | 0.58 | 9.09 | 0.57 |
| 6408 | 53.13639 | -27.77499 | 1.308 | 1.16 | 0.22 | 0.50 | 9.34 | 0.58 |
| 11132 | 53.08729 | -27.71850 | 1.308 | 1.43 | 0.24 | 0.19 | 9.64 | 0.79 |
| 8263 | 53.02619 | -27.75230 | 1.327 | 1.47 | 0.45 | 0.60 | 9.80 | 0.63 |
| 11404ddX-ray detected and classified as an AGN by Xue et al. (2011). | 53.12480 | -27.71710 | 1.356 | 2.12 | 0.28 | 0.33 | 10.80 | 0.80 |
| 11730 | 53.14540 | -27.71260 | 1.361 | 4.10 | 0.38 | 0.73 | 9.26 | 0.62 |
| 9038eeX-ray detected, but in the soft band only and consistent with emission from a star-forming galaxy (Xue et al., 2011). | 53.07529 | -27.74259 | 1.374 | 1.80 | 0.26 | 0.24 | 10.02 | 0.53 |
| 7835 | 53.05199 | -27.75839 | 1.376 | 2.77 | 0.19 | 0.22 | 10.46 | 0.70 |
| 10123 | 53.12810 | -27.72929 | 1.426 | 5.77 | 0.23 | 0.21 | 9.25 | 0.47 |
| 11010 | 53.05690 | -27.72030 | 1.473 | 1.56 | 0.14 | 0.18 | 9.93 | 0.44 |
| 7042 | 53.06560 | -27.76790 | 1.539 | 2.57 | 0.44 | 0.17 | 10.36 | 0.81 |
| 9915 | 53.13259 | -27.73229 | 1.549 | 1.28 | 0.48 | 0.29 | 10.57 | 1.03 |
| 11349 | 53.10960 | -27.71719 | 1.552 | 5.79 | 0.18 | 0.76 | 9.12 | 0.29 |
| 12961 | 53.09719 | -27.69860 | 1.576 | 1.18 | 0.08 | 0.12 | 10.12 | 0.76 |
| 5745 | 53.07379 | -27.78420 | 1.607 | 2.46 | 0.09 | 0.13 | 9.52 | 0.33 |
| 11993 | 53.11220 | -27.71100 | 1.608 | 3.01 | 0.31 | 0.27 | 10.52 | 0.74 |
| 13252 | 53.09469 | -27.69459 | 1.608 | 5.47 | 0.25 | 0.23 | 10.30 | 0.68 |
| 10366 | 53.07300 | -27.72680 | 1.608 | 4.97 | 0.15 | 0.18 | 9.65 | 0.62 |
| 8753 | 53.10430 | -27.74650 | 1.609 | 2.82 | 0.41 | 0.37 | 10.54 | 0.83 |
| 10917 | 53.10910 | -27.72150 | 1.610 | 6.36 | 0.06 | 0.14 | 9.72 | 0.41 |
| 6842 | 53.07300 | -27.77050 | 1.610 | 1.76 | 0.29 | 0.16 | 10.38 | 0.73 |
| 12278 | 53.16040 | -27.70770 | 1.610 | 1.35 | 0.34 | 0.36 | 10.43 | 0.73 |
| 11534 | 53.12319 | -27.71559 | 1.610 | 3.49 | 0.30 | 0.20 | 10.41 | 0.79 |
| 9792 | 53.03450 | -27.73340 | 1.611 | 3.47 | 0.09 | 0.15 | 9.51 | 0.54 |
| 10817eeX-ray detected, but in the soft band only and consistent with emission from a star-forming galaxy (Xue et al., 2011). | 53.12279 | -27.72279 | 1.612 | 7.49 | 1.03 | 0.27 | 10.70 | 0.84 |
| 8803 | 53.13290 | -27.74580 | 1.612 | 1.45 | 0.20 | 0.40 | 10.42 | 0.82 |
| 8154 | 53.14730 | -27.75349 | 1.612 | 3.20 | 0.36 | 0.40 | 10.45 | 0.76 |
| 7371 | 53.08409 | -27.76370 | 1.612 | 2.17 | 0.11 | 0.12 | 9.58 | 0.36 |
| 12285 | 53.11000 | -27.70789 | 1.613 | 5.47 | 0.14 | 0.18 | 10.52 | 0.71 |
| 7989 | 53.10279 | -27.75609 | 1.613 | 4.74 | 0.45 | 0.10 | 10.06 | 0.66 |
| 12703 | 53.11370 | -27.70149 | 1.613 | 4.03 | 0.27 | 0.21 | 11.11 | 0.90 |
| 12522eeX-ray detected, but in the soft band only and consistent with emission from a star-forming galaxy (Xue et al., 2011). | 53.10490 | -27.70520 | 1.613 | 2.83 | 0.52 | 0.22 | 10.84 | 0.64 |
| 8414 | 53.15650 | -27.75079 | 1.614 | 0.88 | 0.21 | 0.46 | 9.33 | 0.39 |
| 7499 | 53.14110 | -27.76189 | 1.622 | 0.68 | 0.36 | 0.40 | 10.08 | 0.79 |
References
- Aird et al. (2012) Aird, J. et al. 2012, ApJ, 746, 90
- Antonucci et al. (1993) Antonucci, R. 1993, ARA&A, 31, 473
- Baldwin, Phillips & Terlevich (1981) Baldwin, J. A., Phillips, M. M. & Terlevich, R. 1981, PASP, 93, 5
- Barro et al. (2011) Barro, G., Perez-Gonzalez, P. G., Gallego, J., Ashby, M. L. N., Kajisawa, M., Miyazaki, S., Villar, V., Yamada, T. & Zamoano, J. 2011, ApJS, 193, 30
- Blanton & Roweis (2007) Blanton, M. R. & Roweis, S. 2007, AJ, 133, 734
- Bournaud et al. (2012) Bournaud, F., Juneau, S., Le Floc’h, E., Mullaney, J., Daddi, E., Dekel, A., Duc, P.-A., Elbaz, D., Salmi, F. & Dickinson, M. 2012 ApJ, 757, 81
- Brammer et al. (2012) Brammer, G. B. et al. 2012, ApJS, 200, 13
- Brinchmann, Pettini & Charlot (2008) Brinchmann, J., Pettini, M. & Charlot, S. 2008, MNRAS, 385, 769
- Bruzual & Charlot (2003) Bruzual, G. & Charlot, S. 2003, MNRAS, 344, 1000
- Calzetti (2001) Calzetti, D. 2001, PASP, 113, 1449
- Chabrier (2003) Chabrier, G. 2003, PASP, 115, 763
- Dahlen et al. (2010) Dahlen, T. et al. 2010, ApJ, 724, 425
- Di Matteo, Springel, & Hernquist (2005) Di Matteo, T., Springel, V., & Hernquist, L. 2005, Nature, 433, 604
- Erb et al. (2006) Erb, D. K., Shapley, A. E., Pettini, M., Steidel, C. C., Reddy, N. A. & Adelberger, K. L. 2006, ApJ, 644, 813
- Giavalisco et al. (2004) Giavalisco, M. et al. 2004, ApJ, 600, 93
- Heckman et al. (2004) Heckman, T. M., Kauffmann, G., Brinchmann, J., Charlot, S., Tremonti, C. & White, D. M. 2004, ApJ, 613, 1
- Hopkins et al. (2006) Hopkins, P. F., Hernquist, L., Cox, T. J., DiMatteo, T., Robertson, B. & Springel, V. 2008, ApJS, 175, 356
- Juneau et al. (2011) Juneau, S., Dickinson, M., Alexander, D. M. & Salim, S. 2011, ApJ, 736, 104
- Kauffmann et al. (2003a) Kauffmann, G. et al. 2003a, MNRAS, 341, 33
- Kauffmann et al. (2003b) Kauffmann, G. et al. 2003b, MNRAS, 346, 1055
- Kauffmann & Heckman (2009) Kauffmann, G. & Heckman, T. M. 2009, MNRAS, 397, 135
- Kennicutt (1998) Kennicutt, R. C., Jr. 1998, ARA&A, 36, 189
- Kewley et al. (2006) Kewley, L. J., Groves, B., Kauffmann, G. & Heckman, T. 2006, MNRAS, 372, 961
- Kümmel et al. (2009) Kümmel, M., Walsh, J. R., Pirzkal, N., Kuntschner, H. & Pasquali, A. 2009, PASP, 121, 59
- Lamareille et al. (2004) Lamareille, F., Mouhcine, M., Contini, T., Lewis, I. & Maddox, S. 2004, MNRAS, 350, 396
- Lehmer et al. (2010) Lehmer, B. D., Alexander, D. M., Bauer, F. E., Brandt, W. N., Goulding, A. D., Jenkins, L. P., Ptak, A. & Roberts, T. P. 2010, ApJ, 724, 559
- Liu et al. (2008) Liu, X., Shapley, A. E., Coil, A. L., Brinchmann, J. & Ma, C.-P. 2008, ApJ, 678, 758
- Magorrian et al. (1998) Magorrian, J. et al. 1998, AJ, 115, 2285
- Mannucci et al. (2010) Mannucci, F., Cresci, G., Maiolino, R., Marconi, A. & Gnerucci, A. 2010, MNRAS, 408, 2115
- McLean et al. (2010) McLean, I. S. et al. 2010, SPIE, 7735, 47
- McLean et al. (2012) McLean, I. S. et al. 2012, SPIE, 8446, 0
- Mineo et al. (2012) Mineo, S., Gilfanov, M. & Sunyaev, R. 2012, MNRAS submitted (arXiv:1207.2157)
- Papovich et al. (2005) Papovich, C., Dickinson, M., Giavalisco, M., Conselice, C. J., & Ferguson, H. C. 2005, ApJ, 631, 101
- Reddy et al. (2006) Reddy, N. A. et al. 2006, ApJ, 644, 792
- Schawinski et al. (2007) Schawinski, K. et al. 2007, MNRAS, 382, 1415
- Shim et al. (2011) Shim, H., Chary, R.-R., Dickinson, M., Lin, L., Spinrad, H., Stern, D., & Yan, C.-H. 2011, ApJ, 738, 69
- Storey & Zeippen (2000) Storey, P. J. & Zeippen, C. J. 2000, MNRAS, 312, 813
- Tacconi et al. (2009) Tacconi, L. J. et al. 2009, Nature, 463, 781
- Tremonti et al. (2004) Tremonti, C. A. et al. 2004, ApJ, 613, 898
- Trouille et al. (2011) Trouille, L., Barger, A. J. & Tremonti, C. 2011, ApJ, 742, 46
- Trump et al. (2011) Trump, J. R. et al. 2011, ApJ, 743, 144
- Trump et al. (2012) Trump, J. R. et al. 2012, ApJ submitted
- Veilleix & Osterbrock (1987) Veilleux, S. & Osterbrock, D. E. 1987, ApJS, 63, 295
- Wright et al. (2010) Wright, S. A., Larkin, J. E., Graham, J. R. & Ma, C.-P. 2010, ApJ, 711, 1291
- Xue et al. (2011) Xue, Y. Q. et al. 2011, ApJS, 195, 10
- Yan et al. (2006) Yan, R., Newman, J. A., Faber, S. M., Konidaris, N. P., Koo, D. C. & Davis, M. 2006, ApJ, 648, 281
- Yan et al. (2011) Yan, R. et al. 2011, ApJ, 728, 38
- Yan & Blanton (2012) Yan, R. & Blanton, M. R. 2012, ApJ, 747, 61
- York et al. (2000) York, D. G. et al. 2000, AJ, 120, 1579