Velocity measurements in the liquid metal flow driven by a two-phase inductor
Abstract
We present the results of velocity measurements obtained by ultrasonic Doppler velocimetry and local potential probes in the flow of GaInSn eutectic melt driven by a two-phase inductor in a cylindrical container. This type of flow is expected in a recent modification to the floating zone technique for the growth of small-diameter single intermetallic compound crystals. We show that the flow structure can be changed from the typical two toroidal vortices to a single vortex by increasing the phase shift between the currents in the two coils from to degrees. The latter configuration is thought to be favourable for the growth of single crystals. The flow is also computed numerically, and a reasonable agreement with the experimental results is found. The obtained results may be useful for the design of combined two-phase electromagnetic stirrers and induction heaters for metal or semiconductor melts.
1 Introduction
The present work is concerned with a physical modelling of the melt flow in a recent modification to the floating zone technique for the growth of small-diameter single intermetallic compound crystals Patent . The quality of crystals grown by this method depends on the growth conditions, particularly on the shape of the solidification front. The growth of single crystals usually requires a convex solidification front Rudolph-10 . The shape of this front can strongly be affected by the convective heat transport in the melt. A standard single-phase induction heater usually drives a radially inward jet of hot melt at the middle of the floating zone Hermann-etal-01 . At the centre of the floating zone, the radial jet splits into two nearly symmetric axial jets, which further stream towards both solid-liquid interfaces. The hot axial jet impinging at the centre of the growth interface renders it concave so promoting a polycrystalline growth. To overcome this adverse effect, we recently proposed a two-phase inductor, which is able to reverse the direction of the electromagnetically driven melt flow so that the solidification front becomes mostly convex Herm-etal05 .
The inductor consists of two coils that are fed by alternating currents of the same amplitude but a 90 degrees phase shift between them. In the original design for radio-frequency induction heating, the phase lag is achieved by short circuiting the secondary coil through a variable capacitor that is tuned so that the resonance frequency of the secondary circuit coincides with the frequency of the power supply PG . In this way, a component of the magnetic field is created that travels towards the coil with the phase lag so dragging the liquid metal along it. As a result, the outer layers of the hot melt are driven towards the periphery of the solidification front while the cooled down melt returns in the centre Rudolph-08 . A similar multiphase stirrer for low conductivity melts has been developed by Ernst et al. Ernst-etal-05a , who also used it for refining the grain size in gold alloys Ernst-etal-05b .
Until now, there have been no direct experimental observations of the effect of the phase shift in a two-coil inductor on the structure of ensuing fluid flow. In this paper, we present comprehensive results of velocity measurements in a model experiment using GaInSn eutectic alloy driven by a simple two-phase stirrer in a cylindrical container. The evolution of the flow pattern has been determined depending on the phase shift between the two coils which were connected to separate power supplies with externally controllable phase shifts. The experiments were also modelled numerically and numerical results compared with the measurements.
2 Experimental setup
(a) (b)
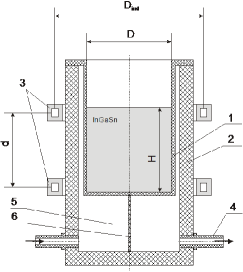
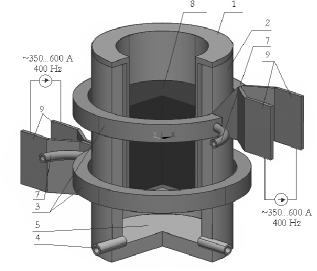
The main element of the experimental setup shown in Fig. 1 is an open top cylindrical container of in both the diameter and height (unity aspect ratio) made of a -thick Polycarbonate. The container was filled with GaInSn alloy at eutectic composition with Ga, In and Sn, and kept in a water jacket at temperature. The relevant physical properties of GaInSn are listed in Table 1. The top surface of the liquid metal was kept open for measurements. The Joule heat generated in the liquid metal was efficiently removed by passing the cooling water through a labyrinth of thin partitioning walls, which were uniformly distributed along the side wall of the container. The container was placed inside an inductor consisting of two circular copper coils of diameter axial separation and a rectangular cross-section with an inner cooling channel. To minimize the perturbation of the magnetic field by the coil terminals, the latter were made of a -thick copper strip welded into each copper winding with a gap, which was filled with Teflon. Thus the current in each coil was interrupted only over this small gap which constituted less than of the total coil circumference. To minimize the superposition of perturbations, the terminals of each coil were placed across the diameter of the container as shown in Fig. 1b.
| density | |
|---|---|
| electrical conductivity | |
| kinematic viscosity | |
| container diameter height | |
| diameter of coils | |
| distance between coils | |
| current amplitude | |
| AC frequency |
The coils were powered as follows. First, two source signals with preset amplitudes, frequencies and relative phases were generated digitally by a computer program and then converted into analogue form by a D/A converter. Second, the analogue signals were amplified by a two-channel power amplifier. Two toroidal transformers were used to match the output impedance of the amplifier with that of the inductor. This allowed us to reach the RMS current up to in each coil, which produced magnetic field with the amplitude of vertical component in the centre of inductor. As the phase shift between the currents in both coils was increased from to the amplitude decreased respectively to At the vertical components of the magnetic field produced by the opposite currents in both coils nearly compensated each other in the mid-plane of the inductor. The magnetic field in the liquid metal was further reduced by the electromagnetic skin effect with the characteristic thickness where is the vacuum permeability and is the circular AC frequency. For the AC frequency used in this experiment we had This value is close to the optimal one which produces maximal flow velocity at fixed current amplitude in this setup Moffatt-91 .
Typical melt velocity of corresponds to the Reynolds number which implies turbulent flow regime. Magnitude of the electromagnetic force is characterized by the dimensionless interaction parameter for
3 Measurement techniques
The velocity distribution in the liquid metal was measured by two methods: pulsed ultrasound Doppler velocimetry (UDV) and potential probe with local magnetic field, which both are briefly described below.
3.1 Ultrasound Doppler velocimetry
Ultrasound Doppler pulsed velocimetry (UDV) is a widely employed technique for measuring velocities in liquid metal flows Takeda-87 ; Takeda-02 ; Cramer-etal-05 . The method uses the phase shift of the ultrasonic wave scattered by microscopic particles in the liquid to determine the distance to the particles. By analysing the time correlation of the signals acquired at different instants of time the device reconstructs the velocity of particles along the ultrasonic beam. In this study we employed DOP2000 Velocimeter model 2125 (‘Signal Processing SA’, Switzerland) to measure the axial velocity profiles along the height of the container in the flow of GaInSn driven by a two-phase AC magnetic field. Measuring velocities of a few centimetres per second over a relatively small height of the container required the highest available ultrasound frequency of For the pulse repetition frequency of used in the experiment and the speed of sound in the liquid metal of the velocity was measured with the absolute error not exceeding
The ultrasound wave was introduced into the liquid metal directly through its free surface. A special care was taken to ensure a good wetting of the UDV transducer by the liquid metal, which was essential for the acoustic coupling. The vertical velocity profiles were measured at the following 9 radial positions: The radial size of the UDV probe precluded measurements at larger i.e., closer to the side wall. At each radial position, samples of axial velocity profiles were recorded during a interval with sampling rate and a spatial resolution in the axial direction. These data were used to find both the time average of the velocity and its standard deviation, i.e. the intensity of velocity pulsations, at each of spatial measurement points over the vertical cross-section of the container. Since the measurements at different were taken at different times, it was not possible to follow the temporal evolution of the flow over the whole cross-section.
3.2 Potential probe
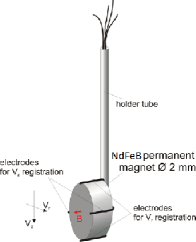
Potential probe, also known as the Vives probe Vives ; Cramer-etal-06 , is another commonly used technique for local velocity measurements in low-melting-point liquid metals. The probe shown in Fig. 2 consists of a small permanent magnet with two pairs of small electrodes. The liquid metal flow passing between the electrode pairs in the magnetic field of the probe induces a difference of the electric potential between the electrodes proportional to the velocity in the respective direction. Besides the low cost, the main advantage of the potential probe over a single-channel UDV is the possibility to measure simultaneously two components of local velocity with a high temporal sampling rate. However, there are also several disadvantages. First, very low voltages, typically about need to be measured. Second, quite long measurement times are required even at moderate spatial resolutions to acquire the velocity distribution over the whole cross-section of the container. Third, the temperature of the liquid metal has to be kept sufficiently uniform to avoid thermo-electrically induced potential perturbations. In the present experiment, the potential probe was used only for a few measurements to check the UDV results.
The probe used in this experiment to measure the axial and radial velocity components was made of a cylindrical NdFeB permanent magnet of in both diameter and height, which was hold by a stainless steel tube of in diameter. The probe was calibrated using an annular channel filled with GaInSn, which was rotated about its centre with a well-defined angular velocity. Since the sensitivity of the probe is nonlinear at low velocities (see Fig. 3), calibration was carried out for the whole range of the expected velocities. The calibration data were fitted with two mathematical expressions: a ‘sigmoid law’ for low velocities and a linear one for higher velocities. These expressions were further used in the acquisition software to convert the voltage measurements into velocities.

Measurements were taken at locations in the vertical cross-section of the container. At each locationm the axial and radial velocity components were recorded during a period of with a sampling rate using a high-resolution 24-bit ‘Data Translation’ DT9821 acquisition board. The internal pre-amplifier of the board with the gain of ensured a ‘noise-free’ resolution in voltage at about the same RMS value of the noise. Besides the instrumental noise, the accuracy of measurements was affected also by thermally induced zero drift of the acquisition board. This effect was minimized by keeping the acquisition board in a thermo-box, which limited the total uncertainty of the electric potential measurement to . For the sensitivity of the probe in the linear regime (Fig. 3), the uncertainty of the velocity measurements was about
4 Experimental results

(a) (b)
4.1 UDV measurements

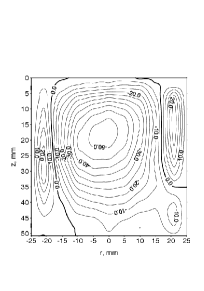
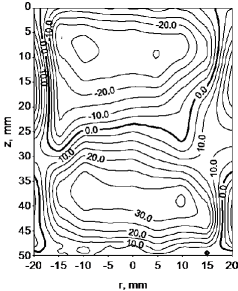
The basic effect of the phase shift between the currents in the top and bottom coils on the flow structure is illustrated by Fig. 4 which shows the isolines of the vertical velocity component for the magnetic field travelling upwards (a) and downwards (b). Note that the velocities are recorded as positive when the flow is directed away, that is downward from the UDV probe which is placed at the top of the liquid metal. Also, note that the velocity could be measured by the UDV only up to and is then extrapolated to the region near the side wall where it is supposed to obey the no-slip condition. In both cases, the currents in the top and bottom coils alternate with the same frequency of and have the same effective values equal to The only difference is that in the first case, the current in the upper coil lags in phase by while in the second case, it leads by the same amount relative to the current in the bottom coil. As the lagging current follows the leading one, the magnetic field effectively travels from the former to the latter. And as it does so, it drags the liquid metal near the side wall with it. Respectively, the magnetic field travelling upward gives rise to regions of negative axial velocity at the side walls, while there is a larger region of positive velocity in the central part of the container where a downward axial jet forms. The highest axial velocity is attained in the jet at the symmetry axis () somewhat downstream from the mid-height of the container. Switching the sign of the phase shift and thus the vertical direction in which the magnetic field travels swaps both the direction of the flow and its pattern about the mid-height of the container. The slight axial asymmetry of the flow pattern observable in both cases may be due to the magnetic field perturbations by the current connections.
Two series of measurements were performed using the UDV. In the first series, the effective current in both coils was increased simultaneously from to while the phase shift between them was kept fixed at The maximal axial velocity, which for this case is plotted in Fig. 5, is seen to increase with the current almost linearly from to Such a linearity, which results from the balance of electromagnetic and nonlinear inertial forces SneMof82 , is characteristic for turbulent AC-driven flows TabFau85 . In laminar but strongly nonlinear flow regime, velocity is expected to vary as Fautrelle-81 ; Sneyd-1993 .
Along with the velocity grow also its fluctuations which characterize the level of turbulence in the flow. The flow pattern remains basically similar to that shown in Fig. 4 (left panel) with a slight axial asymmetry.
(a) (b)
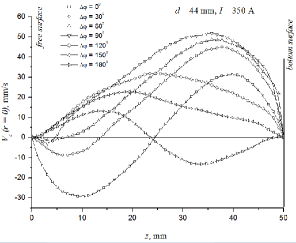
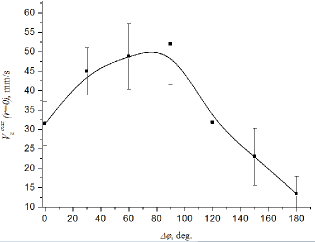
In the second series, the effective currents in both coils were kept fixed at while the phase shift between them was increased from to Figure 6 shows the isolines of the axial velocity component measured at four different phase shifts in addition to that of which is plotted in Fig. 4a. The first case with shown in Fig. 6a corresponds to a standard single-phase AC magnetic field. This field gives rise to a nearly compressing electromagnetic force with a maximum at the mid-height between the coils, where it drives the liquid metal radially inwards. As a result the typical two-vortex structure, which can be inferred from Fig. 6a, arises. As seen in Fig. 6b, a phase shift of is sufficient to break this two-vortex balance in favour of the bottom one which is enhanced by the arising upward axial force while the top vortex is suppressed by it. The axial flow keeps increasing with the phase shift up to where according to Fig. 7 it attains a maximum and then starts to decrease when the phase shift is increased further. The lowest axial velocity is attained at which again corresponds to a single-phase AC magnetic field. In contrast to the previous case, the currents in both coils now flowing in the opposite directions tend to cancel out each other’s magnetic field. Thus, the electromagnetic pinching force cancels out in the mid-plane between the coils where the liquid is now pushed by the pressure gradient radially outwards. This gives rise to a two-vortex structure shown in Fig. 6d, which is similar to that for seen in Fig. 6a except for the opposite flow direction and a twice lower velocity.
4.2 Potential probe measurements
(a) (b)
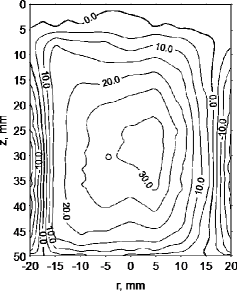
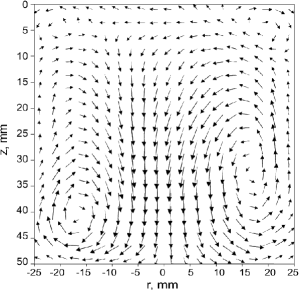
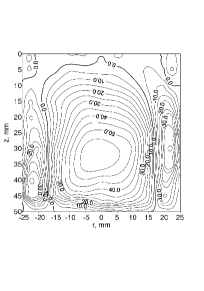
Potential probe was used only in one case for and which was then compared with the UDV measurements and numerical results. The measured velocity field and the isolines of axial velocity component are shown in Fig. 8. The latter is seen to agree well with the corresponding UDV measurements shown in Fig. 4a. Even the slight axial asymmetry is reproduced. This probe could reach the radial positions up to so approaching the side wall closer than the UDV well into the region of the ascending flow. The full flow pattern shown in Fig. 8 includes an extrapolation of the velocity distribution up to the side walls with no-slip boundary condition applied. As seen in Fig. 5, there is also a good agreement between the maximal values of axial velocities measured by the potential and UDV probes.
5 Comparison with numerical results
The problem was also modelled numerically using the finite element code ANSYS in axially symmetric approximation. First, the ANSYS Emag solver was used to solve the electromagnetic part of the problem. At this stage, the effect of liquid metal flow on the AC magnetic field was neglected following the inductionless approximation which is commonly used in the liquid metal magnetohydrodynamics. The cross-section of metal was discretized using a rectangular uniform grid with elements in radial and axial directions, respectively. The distribution of the magnetic field was computed in both the liquid metal and the surrounding areas for various coil currents and their phase shifts. From those data, the distribution of the electromagnetic force in the liquid metal was computed and then passed on as a body force to the FLOTRAN hydrodynamic solver of ANSYS. Using this solver with a standard - model of turbulence and no-slip boundary conditions at the container walls, the flow of liquid metal driven by AC magnetic field was computed using the same grid for the melt region.
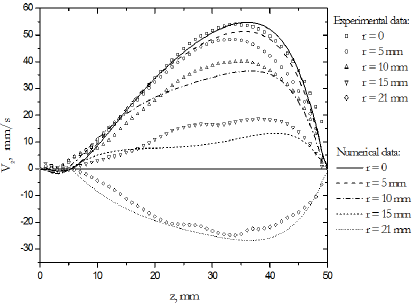
First, as seen in Fig. 5, the numerical results demonstrate a good agreement for the maximal values of the axial velocity measured by the UDV technique at various currents and a phase shift fixed to . There is also a reasonable agreement between the measured and computed profiles of the axial velocity along the height of the container at various radii, which are plotted for and in Fig. 9. The slight axial asymmetry in the measured velocity distribution, which may be due to the current connectors, was eliminated in the comparison by taking the mean value between positive and negative radii.
6 Conclusion
The velocity distribution in the flow of GaInSn eutectic alloy driven by a two-phase inductor in a cylindrical container was measured by ultrasonic Doppler velocimetry and local potential probes. The flow was also computed numerically, and a reasonable agreement with the experimental results was found. It was demonstrated that the flow structure can be modified from the typical two toroidal vortices into a single vortex when the currents in the two coils are made to alternate with a certain phase shift. The vortex is strongest for a given current amplitude when the phase shift between the currents in both coils is about The obtained results may be useful for the design of combined two-phase electromagnetic stirrers and induction heaters for metal or semiconductor melts in applications where a well-defined stirring is required.
References
- (1) Cramer A, Zhang C, Eckert S (2005) Local flow structures in liquid metals measured by ultrasonic Doppler velocimetry. Flow Meas Instrum 15: 145–153
- (2) Cramer A, Varshney K, Gundrum Th, Gerbeth G (2006) Experimental study on the sensitivity and accuracy of electric potential local flow measurements. Flow Meas Instrum 17: 1–11
- (3) Ernst R, Perrier D, Brun P, Lacombe J (2005) Multiphase electromagnetic stirring of low conducting liquids. COMPEL 24:334–343
- (4) Ernst R, Hamburger J, Garnier C, Mangelinck-Noël N, Ramoni P (2005) Grain size reduction by electromagnetic stirring inside gold alloys. Eur Phys J Appl Phys 30: 215–222
- (5) Fautrelle Y R (1982) Analytical and numerical aspects of the electromagnetic stirring induced by alternating magnetic fields. J Fluid Mech 102: 405–430
- (6) Hermann R, Priede J, Behr G, Gerbeth G, Schultz L (2001) Influence of growth parameters and melt convection on the solid-liquid interface during RF-floating zone crystal growth of intermetallic compounds. J Cryst Growth 223:577–587
- (7) Hermann R, Behr G, Gerbeth G, Priede J, Uhlemann H-J, Fischer F, Schultz L (2005) Magnetic field controlled FZ single crystal growth of intermetallic compounds. J Cryst Growth 275:1533–1538
- (8) Moffatt H K (1991) Electromagnetic stirring. Phys Fluids A 3: 1336–1343
- (9) Priede J, Gerbeth G (2013) Analysis of two-phase RF inductor for the floating-zone crystal growth, COMPEL (submitted)
- (10) Priede J, Gerbeth G, Hermann R, Behr G, Schultz L and Uhlemann H-J (2007) German Patent DE10328859B4
- (11) Ricou R, Vives C (1982) Local velocity and mass transfer measurements in molten metals using an incorporated probe. Int J Heat Mass Transfer 25: 1579–1588
- (12) Rudolph P (2008) Travelling magnetic fields applied to bulk crystal growth from the melt: The step from basic research to industrial scale. J Cryst Growth 310: 1298–1306
- (13) Rudolph P (2010) Defect formation during crystal growth from the melt. In: Dhanaraj G, Byrappa K, Prasad V, Dudley M. (eds) Springer Handbook of Crystal Growth, 1st edn, Springer, Berlin, pp 159–201
- (14) Sneyd A D, Moffatt H K (1982) Fluid dynamical aspects of the levitation melting. J Fluid Mech 117: 45–70
- (15) Sneyd A D (1993) Theory of electromagnetic stirring by AC fields. IMA J Math Appl Bus Indust 5: 87–113
- (16) Taberlet E, Fautrelle Y (1985) Turbulent stirring in an experimental induction furnace. J Fluid Mech 159: 409–431
- (17) Takeda Y (1987) Measurement of velocity profile of mercury flow by ultrasound Doppler shift method. Nucl Techn 79: 120–124
- (18) Takeda Y, Kikura H (2002) Flow mapping of the mercury flow, Exp. Fluids 32: 161–169