A Model for the Correlation of Hard X-ray Index with Eddington Ratio in Black Hole X-ray Binaries
Abstract
Observations show that there is a positive correlation between Eddington ratio and hard X-ray index for , and there is an anti-correlation between and for in black hole X-ray binaries (with ). In this work, we theoretically investigate the correlation between and within the framework of disk-corona model. We improve the model by taking into account all cooling processes including synchrotron and self-Compton radiations in the corona, Comptonization of the soft photons from the underlying accretion disk, and the Bremsstrahlung radiations. Presuming that the coronal flow above the disk can reach up to 0.1 Eddington rate at the outer region, we calculate the structure of the two-phase accretion flows and the emergent spectra for accretion rates from 0.003 to 0.1. It is found that at accretion rates larger than Eddington rate a fraction of coronal gas condenses into the disk and an inner disk can be sustained by condensation. In this case, the X-ray emission is dominated by the scattering the soft photon from the underlying disk in the corona. The emission from the inner disk and corona can produce the positive correlation between and . While at accretion rates lower than Eddington accretion rate, the inner disk vanishes completely by evaporation, the accretion is dominated by ADAF, in which the X-ray emission is produced by the Comptonization of the synchrotron and bremsstrahlung photons of ADAF itself. The emission from ADAF can produce the anti-correlation between and . We show that our model can roughly explain the observed evolution of with for the black hole X-ray transient H1743-322 in the decay of 2003 from thermal dominated state to low/hard state.
1 Introduction
A black hole X-ray binary (BHXBs) system is composed of a companion star and a black hole which accretes gases from the companion star. According to the spectral shape and luminosity in X-ray band, BHXBs are generally classified as five different spectral states. In order of increasing luminosity these are quiescent state, low/hard state, intermediate state, high/soft state and very high state (Esin et al. 1997; 1998). Typically, the high/soft state is dominated by a disk component around 1 and a weaker power-law tail with a softer photon index . The low/hard state is characterized by a power-law with a photon index in the range of and an exponential cutoff around 100 (see review by Remillard & McClintock 2006; Done et al. 2007; and the references therein). The intermediate state which is connected with the transition between the high/soft state and low/hard state exhibits complex spectral features (Ebisawa et al 1994; Belloni et al. 1996). The observed spectrum of this state is intermediate between high/soft state and low/hard state. With the advancement of the observational technique, the study on the quiescent state or the so-called ’off state’ with flux levels several order magnitude lower than that of the low/hard state becomes possible. The spectrum of quiescent state is clearly non-thermal, with a photon index a little softer than in the low/hard state (Esin et al. 1997, and the references therein). At the very high state, both the black-body component and the non-thermal tail become comparable (Van der Klis 1994; Gilfanov et al. 1993). The different spectral states imply the different accretion model, and the transition of the spectral state may mean the change of the accretion patterns. It is proposed that the different spectral states are primarily governed by the mass accretion rate (Esin et al. 1997, 1998; Gilfanov et al. 2010; Liu et al. 1999, 2002; Qiao & Liu 2009, 2010, 2011; Maccarone 2003; Meyer-Hofmeister et al. 2012). Homan et al. (2001) analyzed the data of the black hole X-ray transient XTE J1550-564, taken with the Rossi X-ray Timing Explorer between 1998 November 22 and 1999 May 20, during which the source went through different spectral state. It’s found that at least two physical parameters are necessary to explain the behavior of XTE J1550-564. One of the parameter is probably the mass accretion rate, and the other parameter is very likely the (relative) size of a Comptonization region (Homan et al. 2001), which is thought to be associated with the strength of relativistic jets (Fender et al. 2004, and the references therein).
Generally, the accretion at the high/soft state is dominantly via a standard thin disk extending to the innermost stable circular orbit (ISCO) with a weak corona above the disk (Pringle & Rees 1972; Shakura & Sunyaev 1973; Mitsuda et al. 1984; Frank et el. 2002); The ISCO is at (where is the Schwarzschild radius, is gravitational constant, is light speed, and is the central black hole mass). At the low/hard state, it is commonly believed that the accretion flows are geometrically thick, optically thin, hot advection dominated accretion flows (ADAF) within the region of a few ten or hundred Schwarzschild radii from the central black hole + outer geometrically thin, optically thick, cool accretion disk (Esin et al. 2001; McClintock et al. 2001). The accretion flow can account for the observed UV and X-ray emission, but it substantially underpredicts the radio emission. The accretion-jet model was proposed to fit the multi-wavelength observations of the black hole X-ray binary XTE J1118+480 (Yuan et al. 2005, 2007). The jet model was also proposed for the low/hard state, in which both the radio and X-ray emission originate from the synchrotron emission of the jet (Markoff et al. 2001). For the observed intermediate state, the accretion pattern is still not clear. The iron line, the reflection component and also the timing property might imply that the cool gas resides in the innermost region around the black hole (Meyer et al. 2007). At the quiescent state, with much lower accretion rate, the accretion flows have two distinctive zones (1) a standard thin disk at a radius larger than 3000 for the optical and UV radiation (2) an inner ADAF for the X-ray emission (Narayan et al. 1996). Recently, observations show that there is a positive correlation between Eddington ratio and hard X-ray index for (Sobolewska et al. 2011; Kalemci et al. 2006), and there is an anti-correlation between and for (, with being the bolometric luminosity, being the Eddington luminosity, being the central black hole mass scaled with solar mass ) (Wu & Gu 2008). It’s interesting that this correlation is also found in active galactic nuclei, i.e., when , the hard X-ray spectrum softens with Eddington ratio (Porquet et al. 2004; Shemmer et al. 2006; Saez et al. 2008; Sobolewska & Papadakis 2009; Cao 2009; Liu et al. 2012; Zhou et al. 2010; Veledina et al. 2011), but when the hard X-ray spectrum hardens with the Eddington ratio (Constantin et al. 2009; Gu & Cao 2009; Younes et al. 2011, 2012; Xu 2011). For the Comptonization models, it’s argued that the above correlations mean the ratio of Compton luminosity to seed photon luminosity, , changes with Eddington ratio, which is consistent with the scenario that the seed photons are from the synchrotron radiation at lower Eddington ratio and from the truncated thin disk at higher Eddington ratio (Sobolewska et al. 2011). Physically, the change from negative to positive correlations may imply a change of the accretion patterns (Esin et al. 1997, 1998; Yuan et al. 2007).
In this work, by considering the vertical structure of the ADAF, a disk evaporation/ condensation model is proposed to give a unified description to the two different correlations in the black hole X-ray binaries. We presume that the coronal flow above the disk can reach up to 0.1 Eddington accretion rate at the outer region. It is found that at mass accretion rates larger than a fraction of coronal gas condenses into the disk and an inner disk can be sustained by condensation rather than be swallowed by the black hole within the viscous time scale (Liu et al. 2007; Taam et al. 2008; Liu et al. 2011). The size of the inner remnant disk is governed by the accretion rate. The geometry of the accretion flows are described as an inner disk and corona + outer ADAF. During this phase, a positive correlation between and will be predicted. Compared with Meyer et al. (2006), Liu et al. (2006, 2007), Taam et al. (2008) and Qiao & Liu (2012), in this work, we self-consistently consider the cooling of the soft photons from the underlying accretion disk to the corona, and the bremsstrahlung cooling, synchrotron cooling and the corresponding self-Compton cooling of the corona itself. With decrease of the mass accretion rate, the size of the inner disk decreases, eventually the inner disk vanishes completely. The X-ray emission is dominated by the inner ADAF. In the ADAF model, X-ray emission is produced by Compton scattering of the bremsstrahlung and synchrotron photons of the ADAF itself. During this phase, an anti-correlation between and will be predicted (Esin et al. 1997, 1998).
In a word, we propose a self-consistent model which can quantitatively describe both the positive correlation in higher Eddington ratio and the anti-correlation in lower Eddington ratio in the black hole X-ray binaries. In section 2, we introduce the model. The numerical results are presented in section 3. Some Comparisons with observations are shown in section 4. Section 5 is the conclusion.
2 The model
2.1 Formation of the inner disk and corona
Recent investigations (Liu et al. 2006, 2007; Meyer et al. 2007) reveal that when the accretion rate is not far below the maximal evaporation rate an inner disk separated from the outer disk by a coronal region could also exist, leading to an intermediate state of black hole accretion. The onset of an intermediate state occurs as the accretion rate decreases just below the maximal evaporation rate. At this time, disk truncation by evaporation sets in near the region where the evaporation rate is maximal. A coronal gap appears and widens with a further decrease in the accretion rate with the inner cool disk reduced in extent. Because of diffusion, the inner disk can not survive for a time longer than a viscous time (which is only a few days in the inner disk of BHXBs) unless matter continuously condenses from the ADAF onto the cool inner disk. In the following we investigate the interaction between the disk and the corona/ADAF, showing the conditions under which matter condenses onto the inner disk, thereby maintaining a cool disk in the inner region.
For simplicity, we consider a hot ADAF-like corona described by the self-similar solution of Narayan & Yi (1995b) above a geometrically thin standard disk around a central black hole. In the corona, viscous dissipation leads to ion heating, which is partially transferred to the electrons by means of Coulomb collisions. This energy is partially radiative away by bremsstrahlung, synchrotron emission, the self-Compton emission and the Compton scattering of the soft photons from the underling disk, and partially transferred down to the transition layer between the disk and the corona. If the density in this transition layer is too low to efficiently radiate the energy, cool matter is heated up and evaporated into the corona. On the other hand, if the density in this layer is sufficiently high, the conductive flux is completely radiated away, the coronal mass is over-cooled, and condenses partially to the disk. The evaporation or the condensation goes on until an equilibrium density is established. The gas in the corona still retains angular momentum and with the role of viscosity will differentially rotate around the central object. By friction the gas looses angular momentum and drifts inward thus continuously drains mass from the corona towards the central object. Therefore, mass is accreted to the central object partially through the corona and partially through the disk. The pressure , the electron number density , viscous heating rate , and the sound speed of ADAF depend on black hole mass , mass accretion rate , the viscosity parameter , the parameter describing the magnetic fields in the accretion flows, (defined as the ratio of gas pressure to the total pressure), and the distance from the black hole , in the form (Narayan & Yi 1995b),
| (2) |
where is the coronal/ADAF mass accretion rate scaled with Eddington accretion rate (=), is the radius scaled with Schwarzschild radius , and
| (3) |
with the advection fraction. The heat flux transferred from the typical corona/ADAF to the transition layer is derived from energy balance in the corona, i.e.,
| (4) |
where refers to the flux transferred from the upper boundary of the corona to the interface of the transition layer. is the scaled height of the corona, given approximately by . is the energy transfer from ions to electrons (Stepney 1983), and can be approximately expressed for two-temperature advection-dominated hot flow as (Liu et al. 2002),
| (5) |
is the radiative cooling rate of the corona. With , and the bremsstrahlung cooling rate, synchrotron cooling rate and the corresponding self-Compton cooling rate respectively. , and are all the functions of electron number density and electron temperature (Narayan et al. 1995b; Manmoto et al, 1997). is the Compton cooling rate of the underling disk photons to the corona, given by
| (6) |
with the soft-photon energy density from the underling thin disk. is expressed in terms of the effective temperature in the local disk as (where is radiation constant). The conductive flux is given by the formula (Spitzer 1962). For simplicity, we assume that the conductive flux transferred from the upper boundary of the corona to the interface of the transition layer is as follows,
| (7) | |||||
where is the temperature of the electron at upper boundary and refers to the maximum temperature within a given column at a distance . is the coupling temperature at the transition layer, and is determined by assuming viscous heating rate and compressive heating rate balanced with the transfer of heat rate from the ions to the electrons , i.e., , where (Esin 1997; Meyer et al. 2007). The eq. (7) approximately holds for much less than one (Meyer et al. 2006; Meyer et al. 2007; Liu et al. 2007). As the temperature of electron at a given distance along vertical direction in the main body of the corona is approximately constant (Liu et al. 2002), in eqs. (5) and (6) the local temperature of the electron is replaced by throughout our calculations. Given the central black hole mass , mass accretion rate in the corona , the value of viscosity parameter , magnetic parameter , and the maximum effective temperature of the accretion disk , by combing equations (2), (4), (5), (6) and (7), the temperature and the heat flux transferred from the typical corona/ADAF to the transition layer are solved. If the flux at the maximum height of the corona/ADAF is assumed to be approximately zero, the flux arriving at the interface of the transition layer is .
Following the work of Liu et al. (2007), the energy balance in the transition layer is determined by the incoming conductive flux, bremsstrahlung radiation flux, and the enthalpy flux carried by the mass condensation flow,
| (8) |
This determines the condensation rate per unit area, which is given by (Meyer et al. 2007; Liu et al. 2007),
| (9) |
with
| (10) |
From eq. (10), for , a critical radius is derived, from which inwards part of the corona/ADAF matter condenses onto the disk, and a disk-corona system forms. is called as condensation radius in this paper. Combing eqs. (9) and (10), the integrated condensation rate in unit of Eddington rate from to any radius of the disk reads,
| (11) |
According to mass conservation, if the initial mass accretion rate in the corona is ( = ), the mass accretion rate in the corona is a function of distance,
| (12) |
The luminosity of the corona are derived by integrating the corona region,
| (13) |
If the irradiation of the corona to the disk is considered, the effective temperature of the accretion disk including both the accretion fed by the condensation and the irradiation of the corona is given by the following formula (see Liu et al. 2011; Qiao & Liu 2012 for details),
| (14) |
where is albedo which is defined as the energy ratio of reflected radiation from the surface of the thin disk to incident radiation upon it from the corona, the expression of is as follows,
| (15) |
refers to the maximum effective temperature from disk accretion which is reached at . The expression of is given as (Liu et al. 2007),
| (16) |
Given the black hole mass , the initial mass accretion rate in the corona ( = ), the viscosity parameter , magnetic parameter , and albedo , a maximum effective temperature of the accretion disk is assumed to calculate the condensation rate from eq. (11) and corona luminosity from eq. (13), with which a new effective temperature is derived from eqs. (15) and (16). An iteration is made till the presumed temperature is consistent with the derived value, so we find a self-consistent solution of the inner disk and corona, including the size of the inner disk , the condensation rate , the temperature of the corona and Compton scattering optical depth in radial direction. With the derived structure of the inner disk and corona, the emergent spectrum of the inner disk-corona system is calculated out (Qiao & Liu 2012).
2.2 The ADAF model
Outside the condensation radius of inner disk, the accretion flows are supposed to be in the form of advection dominated accretion flows (ADAF) or radiatively inefficient accretion flow (RIAF) (Rees et al. 1982; Narayan & Yi 1994; Narayan & McClintock 2008, and the references therein). The self-similar solution of ADAF is first proposed by (Narayan & Yi 1994; Narayan & Yi 1995b), with which the spectra of transient source A0620-00 and V404 Cyg with lower luminosity are well fitted (Narayan et al. 1996). Later, the global solution of ADAF are conducted by several authors (Narayan et al. 1997; Manmoto 1997, 2000; Yuan et al. 1999, 2000). All of them show that the self-similar solution is a good approximation at a radius far enough from the ISCO. For simplicity, in the present paper, the self-similar solution of ADAF, as in eq. (2), is adopted (Narayan & Yi 1995a,b). The structure of the ADAF can be derived by specifying the parameter , (), , and . All the radiative processes, including bremsstrahlung cooling , synchrotron cooling , and the corresponding self-Compton cooling are considered in the calculation of the self-similar solution. With the derived structure, emergent spectrum of ADAF is calculated (Qiao & Liu 2010).
Combing the contribution of the inner disk-corona system and the outer ADAF, we get the total spectrum of the black hole accreting system. For the inner disk-corona region, we calculate both scattering of the soft photons form the underlying disk, and scattering of the synchrotron and bremsstrahlung photons from the corona itself. Because we focus on the hard X-ray emission, throughout this study, we neglect the contribution of outer truncated disk to the total emergent spectrum.
3 Numerical results
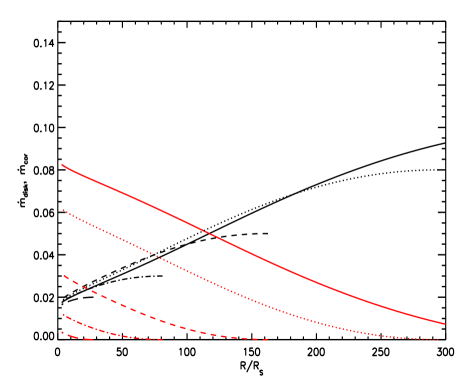
In the calculation, the black hole mass and are adopted. We fix as suggested by the simulations of turbulence driven by the magneto-rotational instability in a collisionless plasma (Sharma et al. 2006; Meyer et al. 2007). The albedo is often very low, (e.g., Magdziarz & Zdziarski 1995; Zdziarski et al. 1999), which means most of the incident photons from the corona are absorbed by the accretion disk, and reradiated as blackbody radiation. The effect of albedo to the structure of disk and corona, and the corresponding spectra was studied by Qiao & Liu (2012). Here, is adopted. It’s found that the accretion flows are in the form of inner disk and corona + outer ADAF if the mass accretion rates are in the range . The inner disk vanishes when and the accretion flows exist in the form of ADAF. We list the numerical results in Table 1. In order to show the mass distribution of the inner disk-corona system in the radial direction, we plot the mass accretion rate in the accretion disk and the mass accretion rate in the corona as a function of radius in Figure 1. It is clearly seen that, with increase of the mass accretion rate, more gases in the corona condense onto the disk, and the accretion rate in the disk increases.
The emergent spectra with mass accretion rate are plotted in Figure 2 for mass accretion rates , , , , , , , . The contribution of different components to the spectra for different mass accretion rate is shown in figure 3. The first plot in Figure 3 is for . The solid line is the total spectrum, the dashed line is the Compton spectrum produced by scattering the soft photon from the underlying disk in the corona, the dotted line is Compton spectrum produced by scattering the synchrotron and bremsstrahlung photons of corona itself in the corona. It’s clear that the emergent spectrum is completely dominated by the scattering the soft photons from the underlying disk in the corona for . This is because, for high mass accretion rate, due to the very strong Comptom cooling, most of the hot coronal gas condenses onto the underlying disk, the density of soft photons from the disk is much higher than that of the synchrotron and bremsstrahlung photons from the corona. In this case, the emission is dominated by the disk. With decrease of the mass accretion rate to , the condensation rate decreases, the relative strength of Compton scattering of the soft photons from the underlying disk to that from the synchrotron and bremsstrahlung photons of corona itself decreases, which can be seen from the second plot in Figure 3. With decrease of the mass accretion rate further, the relative strength of the corona decreases continuously, as shown in the third and forth plots for and as examples. The dot-dashed line in the third and the forth plots is the component from the outer ADAF. Ultimately, when , the inner disk vanishes completely, and emission is dominated by the ADAF, in which the soft photons are only from the synchrotron and bremsstrahlung of the ADAF itself.
From the emergent spectrum in Figure 2, it’s also found that, with decrease of mass accretion rate from 0.1 to 0.02, the hard X-ray photon index decreases from 2.8 to 1.81. Then increases up to when is down to . The evolution of with Eddington ratio is plotted in figure 5 with black line. We can see that there is a positive correlation between Eddington ratio and hard X-ray index in the range of , and there is an anti-correlation between and for . The turning point is at and . The above correlation can be understood as follows. At , because of the very strong Compton cooling, most of the coronal matter () condenses onto the disk. At this case, the emission is dominated by the disk, so a softer X-ray spectrum is predicted. With decrease of the mass accretion rate, both the size of the inner disk and the amount of the coronal matter condensed to the disk decrease. The decreased condensation rate means that the relative strength of the disk luminosity to the coronal luminosity decreases, which will make the spectrum harder. Meanwhile, an increased contribution of the outer ADAF to the spectrum will also make the spectrum harder. So, during this phase, a positive correlation between and is predicted with decreasing of mass accretion rate.
Decreasing the mass accretion rate further, the size of the inner disk decreases continually. Ultimately, the inner disk vanishes completely at some critical accretion rate, and the outer disk is suppressed at a very large radius. The X-ray emission is dominated by the inner ADAF. In this case, the Comptonization of the synchrotron and bremsstrahlung photons of ADAF itself is the dominated cooling mechanism. With decrease of the mass accretion rate, the temperature of the ADAF very weakly depends on the mass accretion rate, i.e. (Mahadevan 1997). However, the Thomson scattering optical depth goes down (Narayan & Yi 1995b)
| (17) |
where is mass accretion rate scaled with Eddington rate and . This results in a decrease of the Compton parameter with decrease of accretion rate. Consequently, the hard X-ray index increases. So, during this phase, an anti-correlation between and is predicted.
To check the effect of viscosity parameter , we plot the emergent spectra for , , , , , , respectively in Figure 4. With decrease of mass accretion rate from 0.1 to 0.02, the hard X-ray photon index decreases from 2.32 to 1.86, then increases up to when is down to . The evolution of with Eddington ratio is plotted in Figure 5 with red line. It’s clear that the V-shaped relation between and also holds for .
We point out that in our calculations the mass accretion rate is assumed to be all in the corona at the condensation radius . This is reasonable at low accretion rates because the disk gas is completely evaporated into corona outside . At accretion rate higher than the maximal evaporation rate (), this assumption is not valid any more. Only when there is hot gas accreted from outer boundary, can the corona accrete at an accretion rate larger than the maximal evaporation rate. We note that, with a higher viscosity parameter (), the maximal accretion rates can be raised as high as 0.1 (Qiao & Liu 2009). Nevertheless, the positive correlation between and from towards high accretion rate does not change, as seen from Figure 5.
4 Comparison with observations
H1743-322 is an X-ray transient, which was first discovered with the Ariel 5 (Kaluzienski & Holt 1977) and HEAO 1 (Doxsey et al. 1977) satellites in 1977 August and then by the X-ray observatories RXTE and INTEGRAl in the outburst 2003. The X-ray observations reveal that the source was going through different spectral states before fading at the end of 2003 (Markwardt & Swank 2003; Homan et al. 2003; Kretschmar et al. 2003; Grebenev et al. 2003; Tomsick & Kalemci 2003; Parmar et al. 2003; Joinet et al. 2005). Kalemci et al.(2006) investigated the decay of H1743-322 , i.e., the transition from thermal dominated state to low/hard state in 2003, and studied the evolution of the spectra in detail. Up to date, a wealth of observations indicate that the system is an accreting black hole with a central black hole mass of (Steiner et al. 2012), although the measurement of the central black hole mass is still uncertain. Using the observed proper motions of the X-ray jets, Corbel et al. (2005) inferred an upper limit to the source distance of . Steiner et al. (2012) derived a distance of by applying a simple and symmetric kinematic model to the trajectories of the two-sided jets.
Based on the observations of Kalemci et al. (2006), Wu et al. (2008) plotted the relation between and during the decay of H1743-322 in 2003 by taking the central black hole and distance respectively (see the black style in Figure 6). With , , and , the theoretical spectra are calculated and shown in figure 2 for different accretion rates, , , , , , , , . For comparison with observations, the model predicted relation between and calculated from the spectra is plotted in Figure 6. It can be seen that the model prediction is roughly in agreement with the observations for reasonable assumptions about the black hole mass and the distance to the source.
Nevertheless, the observational shows a steeper hardening at low Eddington ratios and then a sharper transition at high Eddington ratios than the theoretical prediction, as shown in Figure 6. This could be a combined effect of approximations and chosen parameters involved in the calculations. For example, the self-similar solution used in this work deviates from the global solution; The strength of magnetic field, the value of albedo and the direct heating to corona electrons could all depend on the accretion rates, thereby affect the slope of shown in Figure 6. Some additional physics is needed to precisely determine these parameters, which is beyond the present study.
5 Conclusion
We investigate the dependence of hard photon index on Eddington ratio within the framework of disk evaporation/condensation model. In the paper, we update the calculation of Meyer et al. (2006), Liu et al. (2007), Taam et al. (2008) and Qiao & Liu (2012), and self-consistently consider the cooling mechanisms including Compton scattering of the soft photons from the underlying accretion disk, and the bremsstrahlung, synchrotron and self-Compton radiations to calculate the structure of the disk and corona and the spectrum from the disk and corona. Our model can reproduce the positive correlation between and for , and the anti-correlation between and for observed in black hole X-ray binaries. We show, as an example, that the model can roughly explain the observed evolution of with for H1743-322 in the outburst and decay of 2003 from thermal dominated state to low/hard state.
We appreciate the referee for his/her very help suggestions and comments. We thank Qing-wen Wu for providing the observational data of black hole X-ray binaries. We also thank R. E. Taam and B. Czerny for comments and suggestions. ELQ appreciates the very useful discussions with Xin-lin Zhou. This work is supported by the the National Natural Science Foundation of China (grant 11033007 and 11173029), by the National Basic Research Program of China-973 Program 2009CB824800 and by the foundation for young researcher at National Astronomical Observatories, Chinese Academy of Sciences.
References
- (1) Belloni, T., Mendez, M., van der Klis, M et al. 1996, ApJ, 472, 107
- (2) Cao, X.-W. 2009, MNRAS, 394, 207
- (3) Constantin, Anca, Green, Paul, Aldcroft, Tom, Kim, Dong-Woo, Haggard, Daryl et al., 2009, ApJ, 705, 1336
- (4) Corbel, S., Kaaret, P., Fender, R. P., Tzioumis, A. K., Tomsick, J. A., &Orosz, J. A. 2005, ApJ, 632, 504
- (5) Done, C., Gierliski, Marek, & Kubota, Aya, 2007, A&A Rev., 15, 1
- (6) Doxsey, R., et al. 1977, IAU Circ., 3113, 1
- (7) Ebisawa, Ken, Ogawa, Mina, Aoki, Takashi et al, 1994, PASJ, 46, 375
- (8) Esin, A.A 1997, ApJ, 482, 400
- (9) Esin, A.A, McClintock J.E., & Narayan, R. 1997, ApJ, 489, 865
- (10) Esin, Ann A., Narayan, Ramesh, Cui, Wei, Grove, J. Eric, & Zhang, Shuang-Nan, 1998, ApJ, 505, 845
- (11) Esin, Ann A., McClintock, Jeffrey E., Drake, Jeremy J., Garcia, Michael R., Haswell, Carole A., Hynes, Robert I., & Muno, Michael P., 2001, ApJ, 555, 483
- (12) Fender, R. P., Belloni, T. M., & Gallo, E., 2004, MNRAS, 355, 1105
- (13) Homan, J., Miller, J. M., Wijnands, R., Steeghs, D., Belloni, T. , van der Klis, M., & Lewin, W. H. G. 2003, Astron. Tel., 162
- (14) Homan, Jeroen, Wijnands, Rudy, van der Klis, Michiel, Belloni, Tomaso, van Paradijs, Jan, 2001, ApJS, 132, 377
- (15) Frank, J., King, A., & Raine, D. 2002, Accretion Power in Astrophysics, Cambridge Univ. Press
- (16) Gilfanov, M., 2010, to appear in “The Jet Paradigm - From Microquasars to Quasars”, ed. T. Belloni, Lect. Notes Phys. 794
- (17) Gilfanov et al. 1993, A& AS, 97, 303
- (18) Grebenev, S. A., Lutovinov, A. A., & Sunyaev, R. A. 2003, Astron. Tel., 189
- (19) Gu, Minfeng, &Cao, Xinwu, 2009, MNRAS, 399, 349
- (20) Joinet, A., Jourdain, E., Malzac, J., Roques, J. P. , Scho nfelder, V., Ubertini, P. , & Capitanio, F. 2005, ApJ, 629, 1008
- (21) Kato, S. Fukue, J. & Mineshige, S. 2008, “Black-Hole Accretion Disks”, Kyoto University Press (Kyoto)
- (22) Kalemci, E., Tomsick, J. A., Rothschild, R. E., Pottschmidt, K., Corbel, S., & Kaaret, P., 2006, ApJ, 639, 340
- (23) Kaluzienski, L. J., & Holt, S. S. 1977, IAU Circ., 3106, 1
- (24) Kretschmar, P., Chenevez, J., Capitanio, F. , Orr, A., Palumbo, G., & Grebenev, S. 2003, Astron. Tel., 180
- (25) Liu, B. F., Yuan, W., Meyer, F., Meyer-Hofmeister, E., & Xie, G. Z. 1999, ApJ, 527, L17
- (26) Liu, B. F., Mineshige, S., Meyer, F., Meyer-Hofmeister, E., & Kawaguchi, T. ApJ, 2002, 575, 117
- (27) Liu, B. F., Meyer, F., & Meyer-Hofmeister, E. 2006, A&A, 454, L9
- (28) Liu, B. F., Taam, R. E., Meyer, F., & Meyer-Hofmeister, E. 2007, ApJ, 671, 695
- (29) Liu, B. F., Done, C., & Taam, Ronald E., 2011, ApJ, 726, 10L
- (30) Liu, J. Y., Liu, B. F., Qiao, E. L., & Mineshige, S., 2012, ApJ, 754, 81
- (31) Manmoto, T., & Kato, S. 2000, ApJ, 538, 295
- (32) Manmoto, T., Mineshige, S., & Kusunose, M. 1997, ApJ, 489, 791
- (33) Magdziarz, Pawel, & Zdziarski, Andrzej A. 1995, MNRAS, 273, 837
- (34) Maccarone, T. J. 2003, A&A, 409, 697
- (35) Mahadevan, Rohan 1997, MNRAS, 477, 585
- (36) Mitsuda, K., Inoue, H., Koyama, K., Makishima, K., Matsuoka, M., Ogawara, Y., Suzuki, K., Tanaka, Y., Shibazaki, N., & Hirano, T. 1984, PASJ, 36, 741
- (37) Markoff, S., Falcke, H., & Fender, R. 2001,A&A, 372, L25
- (38) Markwardt, C. B., & Swank, J. H. 2003, Astron. Tel., 133
- (39) McClintock, J. E. et al., 2001, ApJ, 555,477
- (40) Meyer-Hofmeister, Liu, B. F., & Meyer, F., 2012, A&A,, 544, 87
- (41) Meyer, F., Liu, B.F., & Meyer-Hofmeister, E. 2000a, A&A, 361, 175
- (42) Meyer, F., Liu, B.F., & Meyer-Hofmeister, E. 2000b, 354, L67
- (43) Meyer-Hofmeister, E., & Meyer, F. 2006, A&A, 449, 443
- (44) Meyer, F., Liu, B.F., & Meyer-Hofmeister, E. 2007, A&A, 463, 1
- (45) Narayan, R.,& Yi, I. 1994, ApJ, 428, L13
- (46) Narayan, R.,& Yi, I. 1995a, ApJ, 444, 231
- (47) Narayan, R., & Yi, I. 1995b, ApJ, 452, 710
- (48) Narayan, Ramesh, McClintock, Jeffrey E., & Yi, Insu, 1996, ApJ, 457, 821
- (49) Narayan, R. 2005, Ap&SS, 300, 177
- (50) Narayan, R., & McClintock, J. E. 2008, New Astron. Rev., 51, 733
- (51) Parmar, A. N., Kuulkers, E., Oosterbroek, T. , Barr, P., Much, R., Orr, A., Williams, O. R., & Wi nkler, C. 2003, A&A, 411, L421
- (52) Porquet D., Reeves J. N., O Brien P., Brinkmann W. 2004, A&A, 422, 85
- (53) Pozdniakov, L. A., Sobol, I. M., & Siuniaev, R. A. 1977, Soviet Astronomy, 21, 708
- (54) Pringle, J. E., & Rees, M. J. 1972, A&A, 21, 1
- (55) Qiao, Erlin, & Liu, B. F. 2009, PASJ, 61, 403
- (56) Qiao, Erlin, & Liu, B. F. 2010, PASJ, 62, 661
- (57) Qiao, Erlin, & Liu, B. F. 2012, ApJ, 744, 145
- (58) Rees, M. J., Belgman, M. C., Blandford, R. D., & Phinney, E. S. 1982, Nature, 295, 17
- (59) Remillard, R. A. & McClintock, J. E. 2006. Annu. Rev. Astron. Astrophys.
- (60) Saez C., Chartas G., Brandt W. N., Lehmer B. D., Bauer F. E., Dai X., & Garmire G. P. 2008, AJ, 135, 1505
- (61) Shakura, N.I., & Sunyaev, R. A. 1973, A&A, 24, 337
- (62) Sharma, P., Hammett, G. W., Quataert, E., & Stone, J. M. 2006, ApJ, 637, 952
- (63) Shemmer O., Brandt W. N., Netzer H., Maiolino R., Kaspi S. 2006, ApJ, 646, L29
- (64) Sobolewska M. A., &Papadakis I. E. 2009, MNRAS, 399, 1597
- (65) Sobolewska, M. A., Papadakis, I. E., Done, C., & Malzac, J. 2011, MNRAS, 417, 280s
- (66) Steiner, James F., McClintock, Jeffrey E., & Reid, Mark J. 2012, ApJ, 745, 7
- (67) Taam, R. E., Liu, B.F., Meyer, F., & Meyer-Hofmeister, E. 2008, ApJ, 688, 527
- (68) Tomsick, J. A., & Kalemci, E. 2003, Astron. Tel., 198
- (69) Van de Klis, M. 1994, ApJS, 92, 511
- (70) Veledina, Alexandra, Vurm, Indrek, & Poutanen, Juri, 2011, MNRAS, 414, 3330
- (71) Wu, Q., & Gu, M. 2008, ApJ, 682, 212
- (72) Xu, Ya-Di, 2011, ApJ, 729, 10
- (73) Younes, G., Porquet, D., Sabra, B., &Reeves, J. N., 2011, A&A, 530, 149
- (74) Younes, G., Porquet, D., Sabra, B., Reeves, J. N., & Grosso, N. 2012, A&A, 539, 104
- (75) Yuan, Feng 1999, ApJ, 521, 55
- (76) Yuan, Feng, Peng, Qiuhe, Lu, Ju-fu, & Wang, Jianmin 2000, ApJ, 537, 236
- (77) Yuan, Feng, Cui, Wei, & Narayan, Ramesh, 2005, 620, 905
- (78) Yuan, Feng, Taam, Ronald E., Misra, R., Wu, Xue-Bing, & Xue, Yongquan, 2007, ApJ, 658, 282
- (79) Zdziarski A. A., Lubinski P., & Smith D. A. 1999, MNRAS, 303, L11
- (80) Zhou, Xin-Lin, & Zhao, Yong-Heng, ApJ, 720, 206


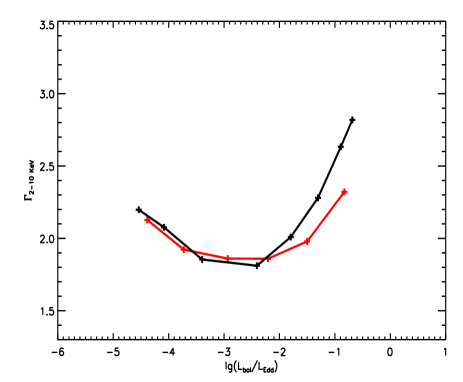
The dependence of hard X-ray photon index on Eddington ratio . The black line is for . The red line is for . All the calculation, , and are adopted.

Evolution of hard X-ray photon index with . The sign is the observed data of H1743-322 during the decay in 2003, and are adopted. The solid line is the theoretical relation by taking , , , and .
| / | |||||||
|---|---|---|---|---|---|---|---|
| 0.3 | 0.1 | 400 | 82% | 0.37 | 2.82 | ||
| 0.3 | 0.08 | 294 | 77% | 0.35 | 2.63 | ||
| 0.3 | 0.05 | 162 | 62% | 0.31 | 2.28 | ||
| 0.3 | 0.03 | 80 | 41% | 0.25 | 2.01 | ||
| 0.3 | 0.02 | 28 | 12% | 0.21 | 1.81 | ||
| 0.3 | 0.01 | 1.85 | |||||
| 0.3 | 0.005 | 2.07 | |||||
| 0.3 | 0.003 | 2.20 | |||||
| 0.4 | 0.1 | 266 | 65% | 0.38 | 2.32 | ||
| 0.4 | 0.05 | 106 | 38% | 0.29 | 1.98 | ||
| 0.4 | 0.03 | 42 | 17% | 0.22 | 1.86 | ||
| 0.4 | 0.02 | 14 | 5% | 0.15 | 1.86 | ||
| 0.4 | 0.01 | 1.92 | |||||
| 0.4 | 0.005 | 2.13 |
Note.— With black hole mass =, and , for different mass accretion rate , the size of the inner disk , condensation rate integrated from the condensation radius to , the ratio of condensation rate to the total accretion rate , the Eddington ratio , the maximum temperature of the inner disk and the hard X-ray photon index are listed. All the calculation, , and are adopted.