Stochastic processes Phase transitions: general studies Population dynamics and ecological pattern formation
Parasites on parasites: coupled fluctuations in stacked contact processes
Abstract
We present a model for host-parasite dynamics which incorporates both vertical and horizontal transmission as well as spatial structure. Our model consists of stacked contact processes (CP), where the dynamics of the host is a simple CP on a lattice while the dynamics of the parasite is a secondary CP which sits on top of the host-occupied sites. In the simplest case, where infection does not incur any cost, we uncover a novel effect: a nonmonotonic dependence of parasite prevalence on host turnover. Inspired by natural examples of hyperparasitism, we extend our model to multiple levels of parasites and identify a transition between the maintenance of a finite and infinite number of levels, which we conjecture is connected to a roughening transition in models of surface-growth.
pacs:
02.50.Eypacs:
05.70.Fhpacs:
87.23.Cc1 Introduction
The need to understand and control the dynamics of infections has motivated the development of a variety of statistical mechanical models. One of the most important of these is the contact process (CP) [1, 2, 3, 4], which describes the dynamics of an infection in a spatially structured population. In the contact process, each site on a lattice represents a host organism which can be infected or susceptible (uninfected). Infection is transmitted to neighbouring susceptible host sites at rate , and infected hosts recover (i.e. become susceptible) at rate . The contact process provides a baseline model for many problems in ecology and epidemiology. It is also of fundamental importance in statistical physics. This is because it exhibits a non-equilibrium phase transition between an infected and a non-infected phase at a critical value of [3, 2].
The standard CP model for an infected population assumes that the host population is of fixed size, without turnover, i.e. host births and deaths. This is valid if the timescale on which the infection is gained and lost is much shorter than the lifespan of an individual. Some infections, however, are carried by individuals for long times, and may be transmitted to offspring upon reproduction (vertical transmission), as well as being transmitted horizontally—i.e. upon physical contact between individuals. Examples include plasmids carried by bacteria [5], some microsporidian parasites of insects [6] and pathogens including HIV and several hepatitis viruses. Here, we investigate the interplay between vertical and horizontal transmission in such populations. Other authors have determined the conditions for parasite persistence in mean-field models that lack spatial structure, in which the parasite may affect host fitness [7, 8, 9], and have suggested that these conditions may be affected by spatial structure [10]. Here, we show that spatial structure can produce a qualitatively new effect: a coupling between the dynamics of the infection and of the underlying host population, even when the infection does not affect the fitness of the host.
We present a two level stacked contact process, in which the host population is represented by a CP on a lattice, and the parasite population is represented by a second CP which sits on top of the host CP. This model incorporates both vertical and horizontal transmission — if an infected host reproduces or dies, the parasite is reproduced or dies with it (vertical transmission), and a parasite-infected site can infect a neighbouring site if it is occupied by an uninfected host (horizontal transmission). We characterize the conditions for parasite persistence in the form of a phase diagram and discover an interesting phenomenon: although the steady-state properties of the host population depend only on the ratio of its birth and death rates, , the prevalence of the parasite can depend non-monotonically on the host population’s turnover rate. This phenomenon has its origins in the fluctuations of spatial clusters of host individuals, and cannot straightforwardly be captured by a mean-field theory.
Parasitic infections are not always limited to two levels. Hyperparasitism, in which an organism carrying a primary parasite is susceptible to a secondary parasite [11], can be harnessed as a biocontrol mechanism — examples include viral infections of the fungus Cryphonectria parasitica that causes chestnut blight [12], and cytoplasmic RNA elements that infect the fungus causing Dutch elm disease [13]. Inspired by these scenarios, we extend our model to a multilevel stacked contact process, in which individuals carrying a primary infection may be susceptible to secondary infections, and those carrying the secondary infection may be susceptible to tertiary infections, etc. This raises a number of questions: How does the dynamics of one parasite level couple to the next, and how many levels of parasites are sustainable in a population? We show that in our stacked contact process, there is a well-defined transition between maintenance of an infinite hierarchy of levels of parasites, and limitation to a finite number of levels. The transition between these two regimes appears to be connected to a roughening transition in certain surface growth processes [14, 15, 16]. This work presents new challenges to our understanding of contact processes, with potential implications for the dynamics of long-timescale infections.
2 Two-level stacked contact process
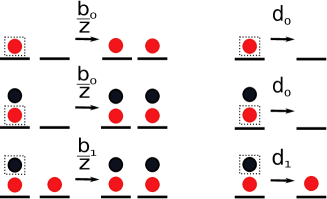
We begin by considering the dynamics of a host and a single parasite which can be transmitted vertically or horizontally — a two-level stacked CP — on a 2D square lattice. Lattice sites can be either empty or occupied by a host organism. Occupied lattice sites become empty at rate , due to death of hosts, and host organisms attempt to replicate into neighbouring empty sites at rate (the attempt rate in any direction is , being the coordination number of the lattice). Host organisms may also carry a parasite, which we assume to be neutral in the sense that organisms with and without the parasite have identical birth and death rates. Infected individuals pass the parasite to uninfected neighbours at rate , and the parasite is lost at a constant rate . We assume that the offspring of an infected organism is also infected (vertical transmission), and that when an infected host dies, the parasite dies with it. Thus the infection dynamics consists of a secondary CP, with parameters and , which sits on top of the host’s birth-death CP. Since the host population does not occupy the whole lattice, the secondary CP does not take place on a regular lattice but rather on the irregular network of occupied sites which changes stochastically due to the dynamics of the host population. The processes that occur in our model are illustrated in Figure 1. We simulate this model using a stochastic kinetic Monte Carlo algorithm, in which all events occur as Poisson processes [17], on a lattice with periodic boundary conditions. Averages are calculated after an initial transient to allow the steady state to be reached.
3 Host dynamics influences parasite persistence
In this model, the host population undergoes a simple CP, whose stationary properties are fully determined by the single parameter [1, 2, 3, 4]. If is less than a critical value, , the only steady state is an empty lattice and the population rapidly becomes extinct. If , a non-zero population can be maintained for long times, before eventually becoming extinct due to a rare fluctuation. The transition between these two regimes is second order; the values of and the associated critical exponents have been characterised in detail [3]. Defining or if site is empty or occupied respectively, the dynamics of the host population obeys
| (1) |
where the sum is over the neighbours of lattice site and the angle brackets denote averages over multiple realizations of the dynamics. The steady-state solution of Eq. (1) satisfies . Ignoring correlations between neighbouring sites by assuming that , we arrive at the mean-field result .
Considering now the dynamics of the parasite, we define if site contains an infected host and otherwise (i.e. if site is either unoccupied or contains a susceptible host). obeys
| (2) | |||||
The first term on the r.h.s. of Eq. (2) corresponds to vertical transmission: an empty site is filled by replication of an infected host. The second term represents horizontal transmission: a susceptible host, denoted by , is infected by a parasite-carrying neighbour. The final two terms correspond to death of an infected host and loss of the parasite. Eq. (2) can be rewritten as
| (3) | |||||
Comparing this with Eq. (1), we see that the cross-correlation perturbs the parasite dynamics from that of a standard CP. Interestingly, however, if (i.e. if the rates of horizontal and vertical transmission are equal), this term vanishes and the form of Eq. (3) becomes that of a standard CP with parameter . The parasite dynamics also has CP-like behaviour in the mean-field limit, where we neglect spatial correlations: setting and in Eq. (3), we obtain the steady-state solution .
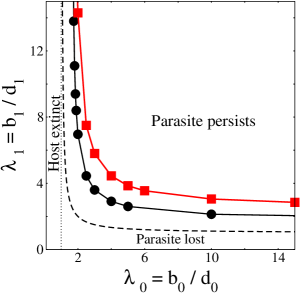
Figure 2 shows the phase diagram for our model, as a function of and . Three steady state scenarios are possible: (i) the host population is extinct, (ii) the host population is finite but the parasite is extinct, and (iii) the parasite persists within a finite host population. Since the dynamics of the host population is a standard CP, the host population is extinct (scenario (i)) if . For , the host population persists, with or without the parasite. The condition for parasite persistence (i.e. the boundary separating scenarios (ii) and (iii)) is predicted by the mean field theory to be (obtained by setting ) – shown by the dashed line in Figure 2. As one might expect, as decreases, the density of the host population decreases, and a higher rate of horizontal transmission () is needed to maintain the parasite.
The symbols in Figure 2 show the boundaries between parasite persistence and loss obtained from our kinetic Monte Carlo simulations, for two values of , the host death rate. The fact that these are shifted upwards and to the right of the mean-field prediction shows that spatial correlations make it harder to maintain the parasite. It is also interesting that we obtain different results for the two different values of . This shows that the parameters and do not fully determine the phase behaviour of the system. For fixed , a higher turnover rate of the host population (i.e. higher and ) apparently makes it harder to maintain the parasite.

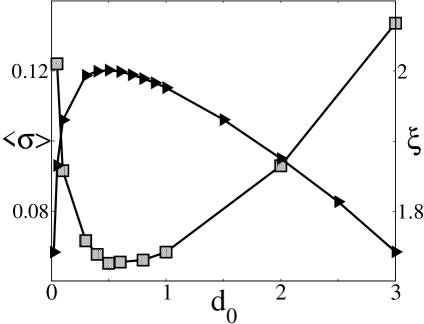
In fact the situation is more complex. Figure 3a shows a more comprehensive investigation of the steady-state parasite density as a function of the host turnover rate. In these simulations, we vary and keeping fixed. The steady-state density of the host population is constant, since it depends only on . Remarkably, for some parameter combinations, the density of the parasite actually depends non-monotonically on the host turnover rate. If the host dynamics is slow, increasing the turnover rate increases the parasite density, while if the host dynamics is fast, the parasite density decreases with the turnover rate.
This dependence of the parasite density on the host turnover rate is absent in the mean-field theory and must therefore be a consequence of spatial correlations. To investigate this, we measure in our simulations the spatial correlations of the parasite density via the function . Here, the first term is the conditional probability of finding a parasite at site given that there is one at site , while the second term ensures that as (where denotes the distance between sites and ). We then fit our data to the functional form to extract the spatial correlation length , which can be thought of as the parasite cluster size. This is shown in Figure 3b. Strikingly, the correlation length is minimal at the turnover rate where the parasite density is maximal. This makes intuitive sense: since horizontal transmission requires contact between infected and uninfected hosts, minimal spatial clustering of the parasite population results in maximal parasite density.
Why should the turnover rate of the host affect the spatial clustering of the parasite? At fast host turnover rates, we observe in our simulations that local patches of host organisms rapidly grow from a single seed and vanish by stochastic extinction, on a faster timescale than that of horizontal transmission. Because offspring are always of the same type as their parents, organisms in a single patch are either all infected or all uninfected. Thus the infected population is highly clustered, leading to low rates of horizontal transmission and low parasite density. By contrast, when the host population turnover is slow, the parasite dynamics constitutes a CP on the effectively frozen, disordered network of lattice sites that are occupied by host organisms. This network contains clusters of sites that may be disconnected, or poorly connected, from the rest of the host population; this creates the possibility of local, stochastic parasite extinctions. This is most obviously the case in the low regime where the host density is low, but it is still true for higher host densities. In this regime, an increase in the host turnover rate serves as a mixing mechanism, by more homogeneously distributing the host population and thereby providing greater opportunity for the parasite to spread.
Thus the nonmonotonic dependence of the parasite density on the host turnover rate arises from a coupling of the spatial fluctuations of the underlying host CP to the parasite dynamics, and can be viewed as a competition between the mixing effect of the host birth-death process at low turnover rates and the population segregation arising from parent-offspring clustering at high turnover rates.
4 Multi-level stacked contact processes
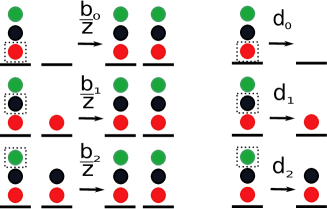
Motivated by natural examples of hyperparasitism, we now investigate a multi-level stacked CP, where individuals carrying a primary infection are susceptible to a secondary infection, and those with the secondary infection are susceptible to tertiary infections, and so on. In the -level stacked CP, a site is labelled if it is empty, if it contains an uninfected host, and if it contains a host infected with levels of parasites. For example, a site labelled 2 contains a host infected with only a primary infection (parasite) while a site labelled 3 contains a host which is infected with primary and secondary infections (a parasite and a hyperparasite). Note that the presence of an infection at level implies the presence of lower-level infections (e.g. one cannot have a secondary infection without a primary infection). Figure 4 illustrates the dynamical processes that can occur in this model. An empty site may be occupied at rate by reproduction of a neighbouring site of any label (top left), or a site labelled may be infected at rate by higher-level parasites from a neighbouring site with label ; its label is then promoted to (middle and bottom left). The host organism of a level site can die, at rate (top right), or experience loss of one of its parasites, at rate (where relates to the level of parasite that is lost). When the latter happens, all higher parasites are also lost and the site is demoted to level (middle and bottom right panels in Fig. 4). The parameters of the model are the number of levels , and the set of level-dependent birth and death rates .
We first consider the special case where the birth rates at all levels are equal; . We divide lattice sites into two sets: sites that have labels greater than or equal to (here denoted ), and sites that have labels less than (here denoted ). An site can become by infection by a neighbouring site: this occurs at rate regardless of the level of the site. An site can become by death of the host or by loss of a parasite at levels . This occurs at total rate where the sum is over levels up to . Thus the dynamics of the density is exactly equivalent to that of a standard CP with parameter .
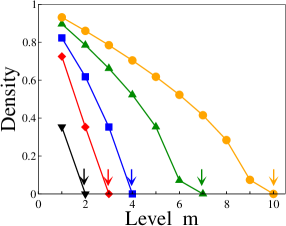
This observation provides us with important insight into the number of levels that are sustainable in a stacked CP. For the standard (one-level) CP, a finite density of occupied lattice sites can only be sustained for , where for a 2D square lattice [3]. In the stacked CP with equal birth rates we therefore expect the density of sites, those with label , to be non-zero only if . Figure 5 shows simulation results for the average density of lattice sites with label , as a function of , for a stacked CP with equal birth rates and death rates , for several values of . By mapping onto a standard CP with , we predict that all levels have zero density and are thus unsustainable. Our simulation results, shown in Figure 5, bear this out: the system indeed only sustains a finite number of parasite levels.
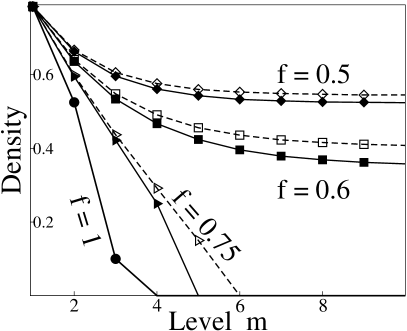
Are there any circumstances where a stacked CP can be sustained for an infinite number of levels? This is indeed possible if either the birth rate increases, or the death rate decreases, sufficiently strongly with . We first suppose that the birth rate is constant but the death rate decreases by a factor at successive levels: where . In this case, the average density of sites with label is given by that of a standard CP with . To sustain an infinite number of levels, we require that , which implies that . Our simulation results, Fig. 6a, show that, with and , the system indeed sustains an infinite number of levels for values of above the critical value of .
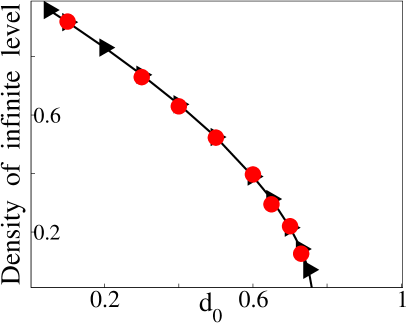
Interestingly, this analysis also shows that, for given values of and , there exists a critical value of the host death rate which separates regimes where the stacked CP can and cannot sustain an infinite number of levels. This is given by . Figure 6b shows, as a function of , the predicted density of sites with label , as : this is given by the density of a standard CP with . The density as indeed falls to zero at .
Finally, we explore briefly the case where, instead of varying the death rate between levels, we instead increase the birth rate by a factor (i.e. set ). In this case the dynamics no longer maps onto that of a standard CP – but nevertheless, our simulations show qualitatively similar results (dashed lines in Figure 6a).
The transition to an infinite number of levels of parasites that we observe in this model appears to be related to a transition that occurs in models for the growth of interfaces by deposition of particles on surfaces [14, 15, 16]. In these models, the interface is modelled as a lattice, with a given height at each lattice site. According to the ballistic deposition rule for surface growth [18], particles fall onto the lattice from above and only stick if the neighbouring lattice site already contains a particle. In some models, particles can also desorb from the surface [16]. In the stacked CP model, we can think of the label of a given lattice site as corresponding to the local height of the interface. The transmission of higher-level parasites to a site with label , from a neighbour with then corresponds to ballistic deposition, while death of a host and loss of parasites loosely correspond to desorption of particles. This apparent mapping is intriguing because these models for surface growth show a roughening transition [14, 15, 16]: when the deposition rate is low, the interface remains smooth, that is, the width of the surface layer remains finite in the thermodynamic limit, whereas when the deposition rate is high, the surface layer grows and roughens over time, that is, arbitrarily large differences in surface height can arise in the thermodynamic limit. These two cases correspond to finite and infinite hierarchies of parasites in our stacked CP model. Although the mapping to the surface growth models is not exact, one expects to see the same phenomenology, e.g. in terms of critical exponents, for the transitions. For example a generic model for coupled directed percolation processes with unidirectional coupling between adjacent levels [25] can show a different exponent at different levels when the critical points coincide. It would be interesting to see if this is true for models such as the one described here which show bidirectional coupling between all levels.
5 Discussion
In this paper, we have presented a simple model for the dynamics of long-lived infections in spatially structured populations. The model is a stacked contact process (CP), in which the host population undergoes a standard CP, and a secondary CP representing the parasite takes place on the dynamically changing network of lattice sites occupied by the host. We find that the coupling between the dynamics of the host population and of the infection leads to non-trivial effects, including a non-monotonic dependence of the parasite prevalence on the host population’s turnover rate, for fixed host population size. This exposes a connection between spatial and temporal scales, since host population turnover affects spatial clustering of infected organisms which in turn affects the prevalence of the infection within the population. We have found that an improved mean-field theory that takes local correlations into account (the ordinary pair approximation [19]) fails to reproduce this nonmonotonic behaviour. This suggests that a deep understanding of the fluctuations in the host CP is required to predict the steady-state properties of the parasite population. It will be interesting in future to investigate how the nature of the CP phase transition for the infection dynamics is affected by the dynamics of the underlying host population. Since disorder can alter critical exponents and lead to new dynamics such as Griffiths phases and activated scaling [20, 21], we envisage that the secondary CP may show fundamentally different behaviour to the standard CP.
Inspired by natural examples of hyperparasitism, or “parasites on parasites”, we have also investigated the properties of a multi-level contact process. For this model, we show that the average density of the -th (and above) level of the stacked CP maps onto that of a standard, one-level CP, if the birth rates at all levels are equal. We find that a phase transition separates two very different behaviours of the model: maintenance of an infinite hierarchy of levels of parasites, versus collapse to zero density at a finite number of levels. In light of the link to models of surface growth it will be interesting to determine more fully the properties of the parasite maintenance transition that we observe in the multi-layer stacked CP.
Finally, we note that the stacked CP model also presents the possibility for a novel study of disorder in contact processes. Classic models for disordered systems usually create disorder by removing a fraction of sites from the dynamics [22] or by allowing different creation or annihilation rates for different sites [23]. This disorder is often quenched - i.e. time-invariant. In our model, disorder in the secondary CP (and higher CPs if present) arises naturally from the underlying dynamics of the primary CP, and can be controlled by varying the rates. This naturally arising disorder is not fixed but varies in time and space (in a fundamentally different process than the mobile disorder of Ref. [24]). Future studies of the effects of this natural disorder on the properties of the secondary CP may uncover new principles of CP dynamics on disordered lattices.
6 Acknowledgements
We thank Martin Evans for useful discussions. SJC was funded by the Carnegie Trust for the Universities of Scotland, RAB by an RCUK Academic Fellowship and RJA by a Royal Society University Research Fellowship.
References
- [1] \NameHarris T. \REVIEWAnn. Probab. 21974969.
- [2] \NameMarro J. Dickman R. \BookNonequilibrium Phase Transitions in Lattice Models (Cambridge University Press, Cambridge) 1999.
- [3] \NameHenkel M., Hinrichsen H. Lubeck S. \BookNon-equilibrium phase transitions, Volume 1: Absorbing phase transitions (Springer, Dordrecht) 2008.
- [4] \NameLiggett T. \BookInteracting Particle Systems (Springer, New York) 1985.
- [5] \NameSummers D. K. \BookThe Biology of Plasmids (Blackwell Science, UK) 1996.
- [6] \NameSmith J. Dunn A. \REVIEWParasitol. Today 7199114648.
- [7] \NameLipsitch M., Nowak M., Ebert D. May R. \REVIEWProc. R. Soc. B 2601995321.
- [8] \NameJones E., White A. Boots M. \REVIEWProc. R. Soc. B 2782011863.
- [9] \NameBusenberg S., Cooke K. L. Pozio M. A. \REVIEWJ. Math. Biol. 171983305.
- [10] \NameSchinazi R. \REVIEWMath. Biosci. 16820001.
- [11] \NameSullivan D. Völkl W. \REVIEWAnnu. Rev. Entomol. 441999291.
- [12] \NameMilgroom M. Cortesi P. \REVIEWAnn. Rev. Phytopathol. 422004311.
- [13] \NameSwinton J. Gilligam C. \REVIEWProc. Roy. Soc. Lond. B 2661999437.
- [14] \NameAlon U., Evans M. R., Hinrichsen H. Mukamel D. \REVIEWPhys. Rev. Lett. 7619962746.
- [15] \NameAlon U., Evans M., Hinrichsen H. Mukamel D. \REVIEWPhys. Rev. E 5719984997.
- [16] \NameBlythe R. A. Evans M. R. \REVIEWPhys. Rev. E 642001051101.
- [17] \NameBortz A., Kalos M. Lebowitz J. \REVIEWJ. Comput. Phys. 17197510.
- [18] \NameMeakin P., Ramanlal P., Sander L. M. Ball R. C. \REVIEWPhys. Rev. A 3419865091.
- [19] \NameSato K., Matsuda H. Sasaki A. \REVIEWJ. Math. Biol. 321994251.
- [20] \NameGriffiths R. B. \REVIEWPhys. Rev. Lett. 23196917.
- [21] \NameVojta T. Dickison M. \REVIEWPhys. Rev. E 722005.
- [22] \NameMoreira A. G. Dickman R. \REVIEWPhys. Rev. E 541996R3090.
- [23] \NameNoest A. J. \REVIEWPhys. Rev. Lett. 57198690.
- [24] \NameDickman R. \REVIEWJ. Stat. Mech.: Theor. Exp. 2009P08016.
- [25] \NameTäuber U. C., Howard M. J. Hinrichsen H. \REVIEWPhys. Rev. Lett. 8019982156.