∎
Tel.: +49 721 608-45022
Fax: +49 721 925-2348
55email: kumar.ankit@hs-karlsruhe.de
Phase-field study of grain boundary tracking behavior in crack-seal microstructures
Abstract
In order to address the growth of crystals in veins, a multiphase-field model is used to capture the dynamics of crystals precipitating from a super-saturated solution. To gain a detailed understanding of the polycrystal growth phenomena in veins, we investigate the influence of various boundary conditions on crystal growth. In particular, we analyze the formation of vein microstructures resulting from the free growth of crystals as well as crack-sealing processes. We define the crystal symmetry by considering the anisotropy in surface energy to simulate crystals with flat facets and sharp corners. The resulting growth competition of crystals with different orientations is studied to deduce a consistent orientation selection rule in the free-growth regime. Using crack-sealing simulations, we correlate the grain boundary tracking behavior depending on the relative rate of crack opening, opening trajectory, initial grain size and wall roughness. Further, we illustrate how these parameters induce the microstructural transition between blocky (crystals growing anisotropically) to fibrous morphology (isotropic) and formation of grain boundaries. The phase-field simulations of crystals in the free-growth regime (in 2D and 3D) indicate that the growth or consumption of a crystal is dependent on the orientation difference with neighboring crystals. The crack-sealing simulation results (in 2D and 3D) reveal that crystals grow isotropically and grain boundaries track the opening trajectory if the wall roughness is high, opening increments are small and crystals touch the wall before the next crack increment starts. Further, we find that within the complete crack-seal regime, anisotropy in surface energy results in the formation of curved/oscillating grain boundaries (instead of straight) when the crack opening velocity is increased and wall roughness is not sufficiently high. Additionally, the overall capability of phase-field method to simulate large-scale polycrystal growth in veins (in 3D) is demonstrated enumerating the main advantages of adopting the novel approach.
Keywords:
Phase-field methodCrystal growthAnisotropic surface energyVeins1 Introduction
Veins are sub-planar discontinuities in the earth’s crust, containing minerals which precipitate from a super-saturated solution in a fracture (Urai et al. 1991). They exhibit a wide range of crystal habits from dendritic, acicular to crystalline or fibrous structures depending on the boundary conditions (Durney and Ramsay 1973; Ramsay and Huber 1983; Fisher and Brantley 1992; Bons and Jessell 1997). Hilgers and Urai (2002b) provide an extensive list of such boundary condition: relative rate of crystal growth with respect to fracture opening velocity, degree of crack surface roughness, fluid properties (pressure, temperature, flow velocity and supersaturation) (Cox et al. 1987; Knipe and McCaig 1994) or transport mechanisms (diffusion and advection) (Durney 1976; McCaig 1988; Yardley and Jamtveit 1997). Durney (1972) and Durney (1976) also correlate fibrous veins to pressure solution and diffusion. The morphology of crystals growing in freely flowing fluid differs significantly from the crystals growing in a constrained environment such as present in crack-sealing conditions. Among the numerous distinguishable crystal morphologies that develop due to a combination of boundary conditions, an interesting case is the formation of curved crystals in veins. Durney and Ramsay (1973) propose that syntectonic fibres grow along the opening trajectory of fracture walls with the transport mechanism being diffusion into the dilational sites. The crystal growth is assumed to be continuous because of which growth competition is not observed. As an alternative to diffusional and continuous accretion, Ramsay (1980) discusses the discontinuous crack-seal mechanism, a repeated process of crack opening and sealing, as indicated by the characteristic inclusion bands/trails and stair-stepped grain boundaries. In recent papers based on natural microstructural features, laboratory experiments and theoretical modeling (Fisher and Brantley 1992; Bons and Jessell 1997), it is suggested that crystal fibers in veins can only form by a diffusional accretion process.
Williams and Urai (1989) elucidate that the primary reason responsible for such deviations from the equilibrium crystal shape is mechanical coupling of wall rock and evolving crystals. Further, Hilgers and Urai (2002b) amend that mechanical coupling of vein and wall is not a necessary condition for the formation of curved fibrous crystals, if the crack increments are smaller than about 10 m.
Cox and Etheridge (1983) and Urai et al. (1991) propose a kinematic model for crystal growth in crack seal veins and show the importance of the wall-rock morphology for the resulting vein microstructure. According to this model, if the crystals have already sealed the space available before the next crack event, the facets are lost and they assume the morphology of the rough vein wall interface. If opening increments are sufficiently small, the crystals cannot develop crystal facets and therefore, grow isotropically. An important conclusion of this model is that the crystal growth kinetics is effectively isotropic if the crack surface is sufficiently rough and crack opening rate is smaller as compared to rate of crystal growth front. As a step to implement crystal anisotropy in 2D, an efficient numerical program Vein Growth is developed by Bons (2001) which is further utilized to simulate the anisotropic growth of crystals under complex boundary conditions. Simulations with Vein Growth produce fibrous crystals with the potential to track the opening trajectory of the crack when the wall morphology is rough and the average opening velocity is smaller than the growth velocity of the crystals (Koehn et al. 2000; Hilgers et al. 2001). A 2D simulation program FACET is separately developed by Zhang and Adams (2002) to study the growth of polycrystal based on deposition flux of atoms. Nollet et al. (2006) use the algorithms Vein Growth and FACET to study crystal growth competition leading to orientation selection and transition from blocky to fibrous morphology during crack-seal growth.
The numerical programs Vein Growth and FACET suffer from geometric restrictions and are vulnerable to inaccuracies at triple/quadruple crystal junctions. The artifacts of the algorithm Vein Growth namely ‘Crystal terminations’ and ‘Long-distance effects’ cause the euhedral angles between facets at crystal terminations to depart from an angle corresponding to the equilibrium shape and the effect of non-neighboring crystals on growth process respectively. Further, the method advocates the switching of the numerical program to FACET in order to produce crystallographically correct facets that develop during free growth of crystals. However, the switching of numerical program induces new complications; the complete sealing of the crack can no longer be simulated correctly. Besides, the algorithm FACET is not capable of generating the crystal facets from a randomly shaped nucleus and implicitly assumes the presence of crystallographically correct facets prior to the growth process. These aspects are addressed in great detail by Nollet et al. (2005). We recognise that since neither of the methods used in the past are able to completely describe the crystal growth in veins and restricted to two dimensions, it is important to develop better algorithms to enhance the knowledge concerning the vein growth process.
The phase-field method, long established in the material science community, is a stand-out approach to describe microstructural evolution during phase transitions for e.g. solidification, spinodal decomposition etc. (Chen 2002; Thornton et al. 2003; Singer-Loginova and Singer 2008; Nestler and Choudhury 2011) The phase-field method’s popularity in modeling material processes is due to the elegance with which it treats moving boundary problems by obviating the necessity to explicitly track the interfaces. Thus it can overcome many of the problems suffered by earlier models such as the Vein Growth and FACET. The model equations are derived on the basis of general thermodynamic and kinetic principles and contain a number of phenomenological parameters related to the physical properties of the material. These parameters are determined based on experimental and theoretical information. Different thermodynamic driving forces for microstructure evolution, such as chemical bulk free energy, interfacial energy, elastic strain energy and different transport processes, such as mass diffusion and advection, can be coupled and the effect on the over all evolution process can be studied simultaneously.
In the present article, we use a thermodynamically consistent multiphase-field model (Stinner et al. 2004; Nestler et al. 2005) to extend the 2D numerical studies of vein growth to 3D. We present the specific formulation of the multiphase-field model for crystall growth by considering anisotropy of the surface energy to produce flat facets and sharp corners (Stinner et al. 2004; Nestler et al. 2005). We also briefly discuss about the computational optimization technique used to make large-scale studies feasible in the present simulations. The phase-field model is used to simulate and analyze the kinematic properties of the anisotropic growth competition in polycrystal, arising due to mis-orientation with respect to most preferred growth direction. In this regard, we also make a strict check for any model artifacts (if present). Further, we modify the boundary condition and parameters to present a systematic study of crack-sealing, e.g. crack surface roughness, crack opening velocity, opening trajectory and number of crystal nuclei. Finally, we present a detailed discussion of 2D and 3D phase-field simulation results, benefits of using the new approach and possible extensions of the current numerical model.
2 Phase-field model
We consider a set of phase-field parameters, denoted by where each component of the vector varies smoothly from 1 inside 0 outside the crystal over a small finite distance (diffuse interface). The location of the crystal-liquid or crystal-crystal interface is defined by a level set at which is determined mathematically by solving the evolution equation. The external fields like temperature or concentration can be coupled to the phase-field parameter , hence no external boundary conditions needs to be applied at the interfaces.
In this article, we use the phase-field equations derived from non-equilibrium thermodynamics guaranteeing a locally positive entropy production. The model is well suited to describe a polycrystalline system by accounting for an arbitrary number of phase-field parameters (Nestler et al. 2005). In the considered applications to crystal growth in veins, we restrict model definition to an isothermal problem. The Helmholtz free energy functional can be formulated as
| (1) |
where is the bulk free energy density, is the small length scale parameter related to the interface width, is a gradient type and , a potential type energy density. We discuss each of these terms in detail.
The phase-field parameter describes the location of ‘N’ crystals with different orientation. The value of each phase field paramter lies in the interval and fulfils the constraint . The integral shown in functional extends over the entire domain of consideration.
The gradient energy density is given by
| (2) |
where defines the form of the surface energy anisotropy of the evolving phase boundary and is the surface free energy per unit area of the boundary which may additionally depend on the relative orientation of the interface. The vector quantity is a generalized gradient vector normal to the interface. To assign an isotropic surface energy to the phase boundary, is chosen. For including a strongly anisotropic surface energy, so that crystals develop flat facets and sharp corners according to directions of the crystal symmetry, a piecewise defined function is used
| (3) |
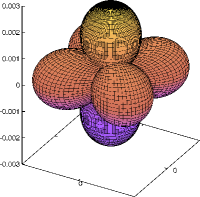
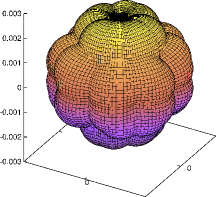
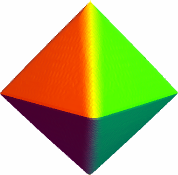
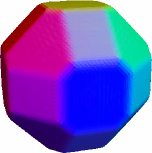
where for denotes the complete set of vertex vectors of the corresponding Wulff shape of a crystal embedded in the bulk phase and represents the number of edges. In Figs. 1 and 1, a polar plot of function for a cubic symmetry and for a truncated octahedral shape are shown. The corresponding equilibrium crystal shapes are displayed in Figs. 1 and 1, respectively.
In the free energy functional , we choose the function to represent a multi-obstacle potential in the form of
| (4) |
where . The higher order term proportional to in function is added to reduce the presence of an unwanted third or higher-order phase at binary interfaces.
The term represents the interface driving force due to the occurrence of different bulk phases. A general formulation of can be given as an interpolation of different free energy densities of the bulk phases,
| (5) |
For studying the kinematics of crystal growth, we apply the interpolation function as a suitable interpolaton function and a constant value for for the bulk free energies.
The evolution equations for the phase fields can be derived from the free energy functional by relating the temporal change of the order parameter, i.e. to the variational derivative of the functional . Applying the Euler Lagrange formalism yields:
| (6) |
| (7) |
where the comma separated subindices represent derivatives with respect to and gradient components . The lagrange multiplier guarantees the summation constraint . In the evolution equation , is the kinetic coefficient which establishes a relationship between the interface growth velocity and the driving force. In the following sections, we assume negligible interface kinetic effect and choose the value of accordingly. This assumption ensures that the rate at which a nuclei evolves into its equilibrium shape (fast or slow growth mode), is not influenced by interface kinetics.
The phase-field evolution equation is solved numerically using an explicit forward Euler scheme. The spatial derivatives of the right hand side equation are discretized using a second order accurate scheme with a combination of forward and backward finite differences. The phase-field solver is written in programming language C and only solves the evolution equation next to the locally present interfaces. The implementation of such a locally reduced order parameter optimization (LROP) facilitates a reduction in computation time from to and in memory consumption from to per cell in the domain, N being the number of crystals in the system. Thus, the computation is independent of the number of phases making the large scale crystal growth studies feasible even in 3D (Kim et al. 2006; Nestler et al. 2008). Further, the simulation code is highly parallelized on the basis of message passing interface (MPI) standard including 3D domain decomposition and dynamic redistribution schemes. For the present article, the simulations are performed on multiprocessor workstations as well as on a Linux high performance cluster.
3 Free growth in an open cavity
The dependence of growth rate on facet orientations for a single crystal has been reported in the past (Mügge 1925; Mullin 2001). However, when polycrystal growth occurs, the neighboring crystals influence the growth rate. Microstructures formed due to crystal growth in an open cavity are characterized by an increase in grain size with more favorably oriented facets out-growing the poorly oriented neighbors (Schmidegg 1928; Thijssen et al. 1992). The orientation selection rule responsible for the growth competition in such systems is based on mis-orientation with respect to the most preferred growth direction. In the following section, we simulate grain growth competition in 2D and 3D and deduce the orientation selection rule. Since the scope of the current study is limited to kinematics of crystal growth, the driving force is assumed to be constant.
One common mineral analogue that has been used to replicate free growth of crystals in laboratory experiments is Potash alum (Nollet et al. 2006). The crystal structure of alum is cubic with eight facets. At room temperature it grows into an octahedral habit and also develops and facets. However, the growth rate of the and facets is much higher as compared to , hence they are much smaller in size as compared to the primary facet (Bhat et al. 1992). Klapper et al. (2002) report that temperature fluctuation increases the growth rate of and facets with respect to . They also state that crystal dissolution and recrystallization can lead to formation of extra facets in the early growth stages. In the present work, we limit the discussion to cubic symmetry since the kinetics of precipitation of crystals from its salt solution is yet to be incorporated in the present phase-field model.
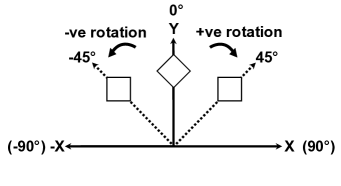
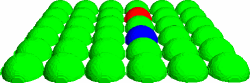
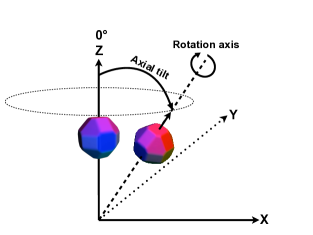
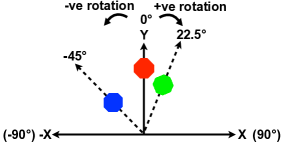
In the first set of simulations, we study the effect of non-neighboring members (termed as ”Long distance effect” by Nollet et al. (2005)) on the free-growth regime of cubic crystals. A 2D simulation is carried out with 10 crystal seeds uniformly embedded at the bottom of the simulation domain and orientation designated as A, B or C degrees. In Fig. 2, the second grain from left at the bottom grain boundary is assigned ‘A’ degrees and sixth grain as ‘B’ degrees. All other grains are assigned ‘C’ degrees. The orientation definitions in 2D simulations are given by Fig. 2. Similarly, we simulate the free-growth in 3D by embedding 36 crystal seeds uniformly at the bottom and assigning each orientation A and B once in the domain. The rest of the grains are assigned with orientation value C as shown in Fig. 3. The numeric value of ‘A’, ‘B’ and ‘C’ are chosen to investigate the effect of non-neighboring crystals (if any) on orientation selection during free-growth of crystals.
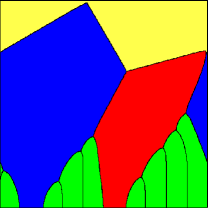


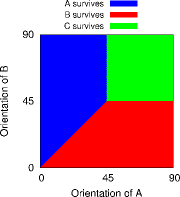
On the basis of phase-field simulation results as shown in Figs. 2 - 2, we derive an orientation map Fig. 2 of crystal orientations ‘A’, ‘B’ and ‘C’ to establish the following selection rules:
-
•
If every crystal has a different orientation, the crystal which is most favorably oriented (vertical in this case), survives and rest of the crystals are consumed.
-
•
The consumption or survival of a crystal depends on its own orientation relative to its neighbors. The non-neighboring crystals do not effect the growth.
-
•
Crystals retain the equilibrium shape (from Wulff construction) when in contact with liquid at all times.
-
•
Crystals having the same growth orientation with respect to most preferred orientation (vertical in this case) form perpendicular grain boundaries (relative to initial surface) and co-exist in the final microstructure, if the other neighboring crystals are not more favorably oriented. This is also observed in the 3D case when two crystals have a similar orientation with respect to the vertical line but lie in different planes.
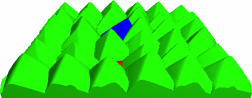
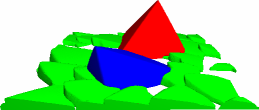
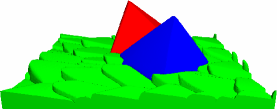
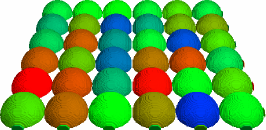
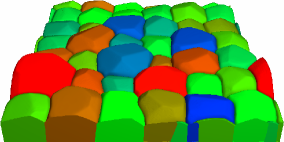
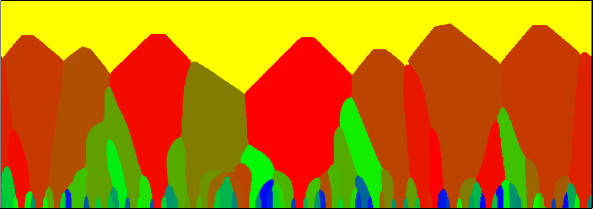
Next, we perform a 3D simulation of alum crystal growth such that crystals also develop and facets in addition to as shown in Fig. 4. Hemispherical crystal seeds are uniformly embedded at the bottom of the domain as shown in Fig. 4, and every crystal is assigned a random orientation with respect to the normal direction of the growth plane. The growth competition results in the consumption of poorly oriented crystals (greenish and bluish in color) and in survival of favorably oriented ones (reddish) as shown in Fig. 4.

4 Crack-seal growth
In the following section, we use the phase-field method described in section 2, to study the effect of various crack parameters namely roughness, opening velocity and trajectory on the crack-seal microstructure. Further, we also examine if the number of competing crystal nuclei causes a variation in the final microstructure.
Numerical simulations are carried out with periodic asperities on the crack wall and uniformly distributed crystal nuclei placed at the top of the domain. The crystals grow downwards in the direction of crack opening. All the crystals are assumed to posses a cubic anisotropy and are assigned random orientation in the range of to with respect to the vertical direction.
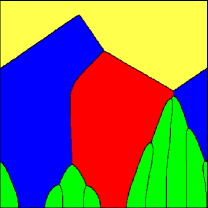
4.1 Effect of crack wall roughness
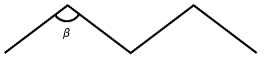
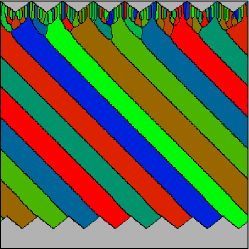
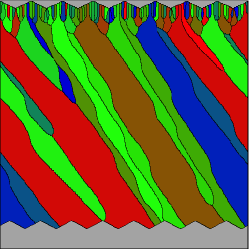
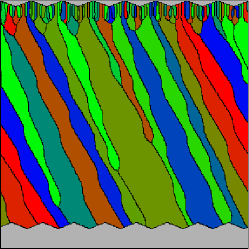
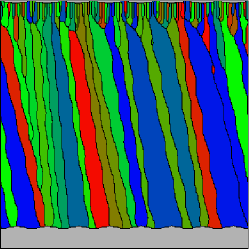
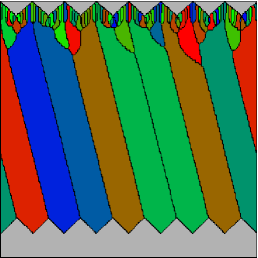
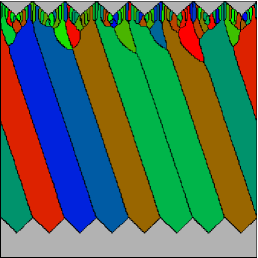
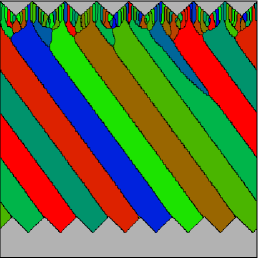
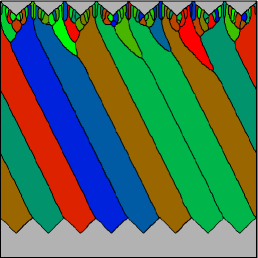
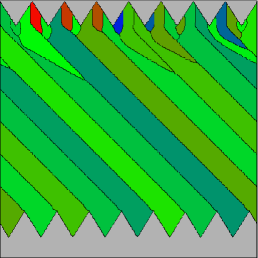
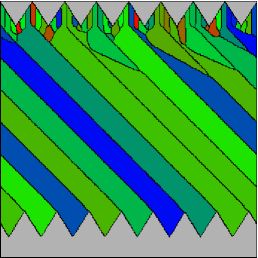
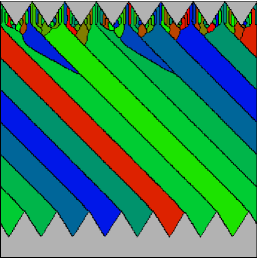
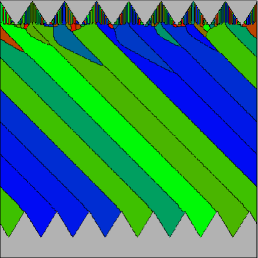
The crack surface is assumed to be periodic and the degree of roughness is controlled by the vertical angle which is varied between 90 and 180 while keeping the wavelength constant as shown in 5. An angle of corresponds to a smooth surface. The crack is opened periodically at an angle with respect to the vertical direction. In order to study the influence of crack roughness, we fix the value of to be . The velocity of crack opening is selected in such a way that a complete sealing of the crack occurs before every crack opening event.
At a higher crack roughness , it is observed in Fig. 5 that the crystals track the crack opening trajectory. This is also characterized by the crack peaks (referred as ’Grain Boundary Attractor’ by Hilgers et al. (2001) and Nollet et al. (2005)) attracting the grain boundaries and forcing the crystals to grow in a fibrous morphology. As the roughness angle is successively increased in Figs. 5 - 5, the tracking behavior decreases and crystals develop curved/oscillating grain boundaries. The period of oscillation reduces with decreasing roughness.
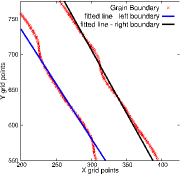
To quantify the grain boundary tracking behavior, we plot the contour of the crystal grain boundaries (corresponding to one of the tracking grain boundary) and fit straight lines to the left and right crystal boundaries as illustrated in Fig. 5. The overall tracking inclination is defined as the mean value of the slopes of the two lines and is used to elaborate the general tracking efficiency as:
| (8) |
The general tracking efficiency (GTE) is plotted as a function of roughness angle in Fig. 5. The resulting trend indicates that the general tracking efficiency decreases for lower crack-surface roughness, beyond a certain value. It is to be noted that the purpose of the prefix ’general’ in the term ’general tracking efficiency’ (GTE) is to highlight the difference with the definition of ’tracking efficiency’ by Urai et al. (1991). As evident from the simulations and plotted results in Fig. 5, GTE converges to the definition of ’tracking efficiency’ when crystal growth is isotropic without any oscillations. Additionally, the definition of GTE is more general as it remains valid even when characterizing the tracking behavior of oscillating grain boundaries.


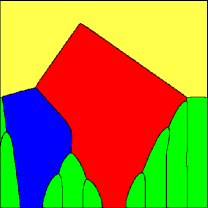
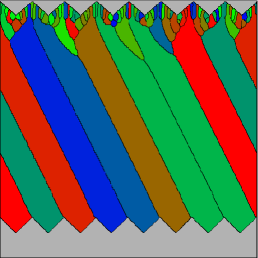
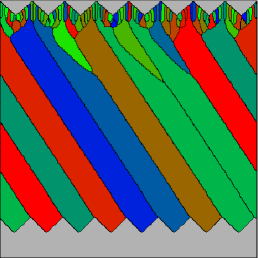
4.2 Effect of crack opening rate
To study the effect of crack opening velocity on vein growth, a simulation setup similar to section 4.1 is considered with 10 crystal nuclei. The roughness angle is selected to ensure a high level of tracking efficiency, if complete sealing occurs before every opening event. The crack opening angle is kept constant and rate of opening is varied as shown in Fig. 6. It is observed in Fig. 6 that at higher crack opening rate (as compared to crystal growth rate), crystals lose contact with the crack surface. This leads to the formation of an elongate-blocky growth morphology, since crystals now grow more or less anisotropically and follow the orientation rule as observed for free-growth in Fig. 2. At lower crack opening rate as in Figs. 6 and 6, crystals grow isotropically in fibrous morphology, since the facet formation is suppressed. Further, within the complete crack-seal regime, at a higher opening velocity, the crystal boundaries have a tendency to curve in contrast to the case when opening velocity is smaller. The simulation results for the influence of crack opening velocity on crystal growth morphology are presented in Fig. 6. A definitive change in the crystal growth morphology is observed if crack opening rate is varied.


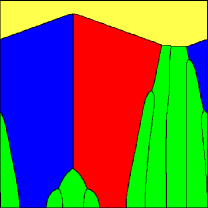
4.3 Effect of crack opening trajectory
In the next series of simulations, 100 crystal nuclei with different orientation are uniformly embedded at the top of the domain and the crack opening angle is varied. The crack roughness angle is selected to be and a complete sealing is ensured at every opening event. The phase-field simulation results show that crystals track the crack opening trajectory, irrespective of . Thus, the grain boundary tracking efficiency is not affected by the crack opening angle. The results of the simulation are summarized in Fig. 7. On further increasing the magnitude of the crack opening increment in Fig. 8 while ensuring complete sealing before every opening event, we observe that the tracking behavior is lost and crystals grow in a random morphology (Fig. 8). However, when the crack opening increment is reduced ten-folds, while keeping unchanged, crystals re-establish a tracking of the crack opening trajectory as shown in Fig. 8.


4.4 Effect of number of crystal nuclei
The number of nuclei is varied to study its influence on the vein growth morphology. The crack is assumed to be sufficiently rough for 100% tracking of crystal boundaries and complete sealing is ensured. The phase-field simulations show that varying the initial number of nuclei does not influence the tracking behavior. It is noteworthy that the number of surviving crystals remains constant and is numerically equal to the number of peaks in the crack surface which faces the crystal growth front. The crystal boundaries stabilize at the crack peaks which suggest that these attract the grain boundaries. Further, we do not observe any change in growth morphology once the number of crystals surviving equals the crack peaks, irrespective of the initial number of nuclei as shown in Fig. 9.

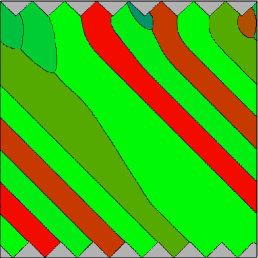
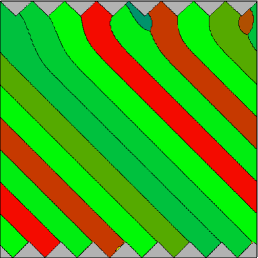
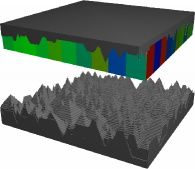
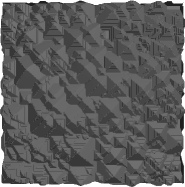
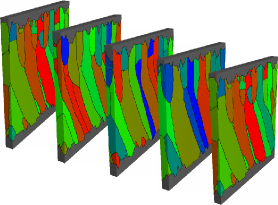
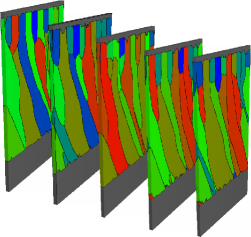
Finally, 3D phase-field simulations of crack-sealing are carried out by embedding 100 alum crystal nuclei on computationally generated rough crack surface in Figs. 10 and 10. The roughness of the 3D crack surface is controlled by varying the range of amplitude of peaks. Higher roughness relates to a wider range of maximum and minimum height of peak which is permissible (chosen randomly at different spatial locations). The crack is opened slowly to ensure ensuring complete sealing before every opening event. The 3D simulation results are displayed in Fig. 10 which shows a layer-by-layer plot of the simulation domain. The simulation results reveal that a crack surface with higher roughness forces the crystals to track the opening trajectory. As the surface roughness is reduced, the resulting grain boundaries partially form curved/oscillatory morphologies (Fig. 10). It can be observed, that crystals grow in a mixed regime when the wall roughness is not sufficiently high.

5 Discussion of results
In the present article, the multiphase-field model for grain-growth has been extended to study the crystal growth in veins in two different growth conditions namely, free-growth in fluid and crack-sealing. In spite of considering the role of surface energy anisotropy which is responsible for crystal facet formation and growth competition, the previous algorithm for modeling vein growth (Bons 2001) suffer from model artifacts namely ‘Crystal terminations’ and ‘Long distance effect”. The phase-field model presented in this article explains the role of surface energy anisotropy and additionally account for the interface thermodynamics and force balances at multi-grain junctions (crystal triple/quadruple points in current context). Thus, the selection dynamics of faceted crystal growth observed in the present simulations are more reliable as they compare well with the experimental findings (Hilgers and Urai 2002a).
It is observed that the consumption or the survival of a crystal depends on its own orientation relative to neighbors, when allowed to grow freely. The non-neighboring crystals do not effect the growth of the crystal in consideration directly. Additionally, the inter-facet angle defined by the equilibrium shapes are always preserved for the crystals growing freely in liquid Figs. 1 and 1. Moreover, we do not observe any exceptions in the deduced crystal growth selection rule contrary to the findings of Nollet et al. (2005) for cubic crystal symmetry. In particular, these exceptions refer to the survival of crystals which have different orientations as well as equilibrium angle between the facets described as model artifacts. The present method is able to rectify such problems, evident from the simulations as well as orientation map and shown in Fig. 2 - Fig. 2 and Fig. 2 respectively. The phase-field simulation results in Figs. 2 and 2 corroborate the findings of Bons and Bons (2003) by the observation that the interface boundary between crystal ‘A’ and ‘B’ is found to be inflected. This highlights the reproducibility of previous simulation results when phase-field method is utilized. Apparently, if sufficient time is available for the development of facets, the favorably oriented crystals always out-grow the poorly oriented neighbors. We are aware of the fact that crystal growth results from an interplay of surface energy anisotropy and growth kinetics. Typically, a crystal nucleates in its equilibrium (Wulff) shape and grows asymptotically towards its ”kinetic Wulff shape” if long-range transport of energy and/or mass is assumed to be extremely fast (Sekerka 2005). Additionally, we do not rule out the possibility of different contact angles at liquid–solid triple junctions as a result of different force balances corresponding to kinetic or surface energy anisotropy. Therefore, the values of the kinetic coefficient and of interfacial energies need to be chosen appropriately to simulate correct selection dynamics.
The presence of a barrier for example,
a rigid and rough crack surface,
obstructs the freely growing crystals,
forcing them to grow into a
morphology unrelated to the
equilibrium crystal shape. It is found that
the crack parameters such as the roughness,
opening velocity and trajectory determine the final
crack-seal microstructure. The phase-field simulation
results of crack-sealing process suggest
that if the wall rock is sufficiently rough and
opening velocity is small, the crystals grow isotropically,
in a fibrous morphology and track the
crack-opening trajectory. In this case, anisotropy in surface energy
does not effect the growth morphology
since facet formation
is suppressed due to the additional boundary condition,
which corroborates the previous simulation and
experimental studies on crack-sealing process
(Urai et al. 1991; Hilgers et al. 2001; Nollet et al. 2005).
Moreover, higher roughness
of the facing wall rock also increases the fineness of fibrous microstructure.
This is inferred from Fig. 9 which shows that if the
roughness is sufficiently high, the number of fibers formed is numerically
consistent with the peaks on the facing crack surface.
At a lower crack surface roughness, the grain boundary
tracking efficiency decreases and the crystal boundaries
have a curved/oscillating morphology as presented in Figs.
5, 5 and 5.
The anisotropy of the surface energy
provides an explanation for the curvature observed in
grain boundaries in this case, as the
crack opening events occur along an oblique
line with respect to the vertical direction.
It is noteworthy, that grain boundaries alone do
not provide much information about the crack-opening trajectory
in such cases. The simulation results also reveal that
straight grain boundaries are formed when
surface energy of the growing crystals
is assumed to be isotropic. Further, within the complete
crack-seal regime, when the opening increment is
relatively faster, curved grain boundaries
are formed. The 3D phase-field
study of the crack-sealing process
accentuate these findings; if the wall rock
roughness is low and crack opening
velocity is increased while still ensuring
complete sealing before every
opening event, the crystals
growth occurs in a mixed regime, characterized
by a decrease in tracking behavior with a
propensity to form curved grain boundaries.
A systematic study to establish the correlation
of crack roughness (by choosing more realistic
boundary condition for e.g. fractal surface) and opening rate
(in 3 dimensions for more relevant vein forming crystals like quartz or calcite)
with the extent/amplitude of grain boundary curvature/oscillation
and influence of hydrodynamic convection, is a part of
on-going effort.
At this point, we would like to clarify that the
objective of present work is not to
question the numerical algorithm
or the simulation results of
Urai et al. (1991), Bons (2001), Hilgers et al. (2001) and Nollet et al. (2005).
Rather, it is aimed to advance
the numerical studies to
3D by adopting a
thermodynamically consistent approach
and to discuss the applicability of phase-field
method to study polycrystal growth in veins.
In this scope, the foremost intention is to
discuss the reproducibility
of previous results (in free-growth as well
as crack-sealing 2D simulations) as well as advantages
of using the present phase-field model (3D numerical studies
for crystal of any shape, large-scale simulations and provision to
implement transport).
6 Conclusion and outlook
In the present article, the parameters controlling the vein microstructure are studied using the phase-field method. The role of surface energy anisotropy during free growth of crystals and its influence on the grain orientation selection is addressed. The 3D phase-field simulation of free crystal growth process provides further insight on how poorly oriented crystals are consumed by more favorably oriented ones and previous ambiguities reported in literature (Nollet et al. 2005) are ruled out. Further, the influence of crack parameters on the final microstructure is discussed in detail. One of the intriguing finding of the current work is the role of surface energy anisotropy in the formation of crack-seal microstructures. Of particular importance, is the appearance of curved/oscillating crystal boundaries which draws similarities with the natural vein microstructures. The current phase-field study of crack-sealing process (in 2D and 3D) indicate that anisotropy in surface energy of the growing crystals cause the grain boundaries to curve/oscillate, if wall rock is not sufficiently rough and crack opening rate is increased gradually while still ensuring complete crack-sealing before every opening event. The fineness of the fibrous microstructure is directly related to the number of peaks on the facing wall surface. Further, the transition from fibrous to elongate-blocky morphology in vein microstructure caused by varying the crack opening rate is demonstrated in the simulation results. The present work also establishes the phase-field method as comprehensive, artifact-free and standout approach to simulate the geological processes occurring during vein formation. The simulation results also demonstrate the general capability of multiphase-field method in dealing with anisotropic 3D vein-growth problem. It is noteworthy that the numerical model presented in the current work provides a general framework to simulate crystals of any shape. Since the underlying model equations are based on continuum mechanical and thermodynamical concepts, several extensions of the present vein-growth model are possible. This includes the studies related to diffusion driven grain evolution and hydrodynamic convection. Including such effects in the present phase-field model is imperative for the complete understanding of the vein growth problem. Once implemented, the model can be further utilized to study the precise effect of hydrodynamic convection on the morphology of the vein front and crystal boundaries. Further, this also helps in debating the question posed by Barker et al. (2006) whether vein formation involves advective fluid flow, or occurs by local diffusion of material from the surrounding wall rock. Though, this requires significant computational resources, the efficient parallelization of the phase-field solver (Nestler et al. 2008) (utilized for phase-field simulations presented in this article) makes it feasible.
Acknowledgements.
Drs. Abhik Choudhury (Ecole Polytechnique, Palaiseau, France) and Frank Wendler (Institute of Applied Geosciences, Karlsruhe Institute of Technology) are thanked for many insightful discussions. KA and BN acknowledge the financial support by Graduate school 1483 of German Research Foundation and by the project CCMSE of the European Union (EFRE) together with the state Baden-Wuerttemberg. KA also thank former co-workers Drs. Denis Pilipenko and Michael Fleck (Materials and Process Simulations, University of Bayreuth) for preliminary discussions concerning the model and Center for Computing and Communication at RWTH Aachen University (HPC Cluster) for computational resources.References
- Barker et al. (2006) Barker SL, Cox SF, Eggins SM, Gagan MK (2006) Microchemical evidence for episodic growth of antitaxial veins during fracture-controlled fluid flow. Earth Planet Sc Lett 250(1–2):331 – 344
- Bhat et al. (1992) Bhat HL, Ristić RI, Sherwood JN, Shripathi T (1992) Dislocation characterization in crystals of potash alum grown by seeded solution growth under conditions of low supersaturation. J Cryst Growth 121(4):709 – 716
- Bons and Bons (2003) Bons AJ, Bons PD (2003) The development of oblique preferred orientations in zeolite films and membranes. Micropor Mesopor Mat 62(1–2):9 – 16
- Bons (2001) Bons PD (2001) Development of crystal morphology during unitaxial growth in a progressively widening vein: I. the numerical model. J Struct Geol 23(6–7):865 – 872
- Bons and Jessell (1997) Bons PD, Jessell MW (1997) Experimental simulation of the formation of fibrous veins by localised dissolution-precipitation creep. Mineralogical Mag 61(1):53–63
- Chen (2002) Chen LQ (2002) Phase-field models for microstructure evolution. Annual Review of Materials Research 32(1):113–140
- Cox and Etheridge (1983) Cox SF, Etheridge MA (1983) Crack-seal fibre growth mechanisms and their significance in the development of oriented layer silicate microstructures. Tectonophysics 92(1–3):147 – 170
- Cox et al. (1987) Cox SF, Etheridge MA, Wall VJ (1987) The role of fluids in syntectonic mass transport, and the localization of metamorphic vein-type ore deposists. Ore Geol Rev 2(1-3):65–86
- Durney (1972) Durney D (1972) Solution-transfer, an important geological deformation mechanism. Nature 235(5337):315–317
- Durney and Ramsay (1973) Durney D, Ramsay J (1973) Incremental strains measured by syntectonic crystal growths. Gravity and Tectonics pp 67–96
- Durney (1976) Durney DW (1976) Pressure-solution and crystallization deformation. Phil Trans R Soc A 283(1312):229–240
- Fisher and Brantley (1992) Fisher DM, Brantley SL (1992) Models of quartz overgrowth and vein formation: deformation and episodic fluid flow in an ancient subduction zone. J Geophys Res 97(B13):20,043–20,061
- Hilgers and Urai (2002a) Hilgers C, Urai JL (2002a) Experimental study of syntaxial vein growth during lateral fluid flow in transmitted light: first results. J Struct Geol 24(6–7):1029 – 1043
- Hilgers and Urai (2002b) Hilgers C, Urai JL (2002b) Microstructural observations on natural syntectonic fibrous veins: implications for the growth process. Tectonophysics 352(3–4):257 – 274
- Hilgers et al. (2001) Hilgers C, Koehn D, Bons PD, Urai JL (2001) Development of crystal morphology during unitaxial growth in a progressively widening vein: II. Numerical simulations of the evolution of antitaxial fibrous veins. J Struct Geol 23(6–7):873 – 885
- Kim et al. (2006) Kim SG, Kim DI, Kim WT, Park YB (2006) Computer simulations of two-dimensional and three-dimensional ideal grain growth. Phys Rev E 74:061,605
- Klapper et al. (2002) Klapper H, Becker RA, Schmiemann D, Faber A (2002) Growth-sector boundaries and growth-rate dispersion in potassium alum crystals. Cryst Res Technol 37(7):747–757
- Knipe and McCaig (1994) Knipe RJ, McCaig AM (1994) Geofluids: origin, migration and evolution of fluids in sedimentary basins, pp 99–111
- Koehn et al. (2000) Koehn D, Hilgers C, Bons PD, Passchier CW (2000) Numerical simulation of fibre growth in antitaxial strain fringes. J Struct Geol 22(9):1311 – 1324
- McCaig (1988) McCaig AM (1988) Deep fluid circulation in fault zones. Geology 16(10):867–870
- Mügge (1925) Mügge O (1925) Über gehemmtes kristallwachstum. Z Kristallogr 62(5/6):415–442
- Mullin (2001) Mullin JW (2001) Crystallization. Butterworth-Heinemann, Oxford
- Nestler and Choudhury (2011) Nestler B, Choudhury A (2011) Phase-field modeling of multi-component systems. Current Opinion in Solid State and Materials Science 15(3):93 – 105
- Nestler et al. (2005) Nestler B, Garcke H, Stinner B (2005) Multicomponent alloy solidification: Phase-field modeling and simulations. Phys Rev E 71:041,609
- Nestler et al. (2008) Nestler B, Reichardt M, Selzer M (2008) Massive multi-phase-field simulations: methods to compute large grain system. In: Hirsch J, Skrotzki B, Gottstein G (eds) Proceedings of the 11th International Conference on Aluminium Alloys, Aachen, Germany, pp 1251–1255
- Nollet et al. (2005) Nollet S, Urai JL, Bons PD, Hilgers C (2005) Numerical simulations of polycrystal growth in veins. J Struct Geol 27(2):217 – 230
- Nollet et al. (2006) Nollet S, Hilgers C, Urai JL (2006) Experimental study of polycrystal growth from an advecting supersaturated fluid in a model fracture. Geofluids 6(2):185–200
- Ramsay (1980) Ramsay JG (1980) The crack-seal mechanism of rock deformation. Nature 284(5752):135–139
- Ramsay and Huber (1983) Ramsay JG, Huber MI (1983) The Techniques of Modern Structural Geology: Strain analysis, The Techniques of Modern Structural Geology, vol 2, Academic Press, pp 185,192
- Schmidegg (1928) Schmidegg O (1928) Über geregeltes wachstumsgefüge. Jb Geol Bundesanstalt 78:1–51
- Sekerka (2005) Sekerka RF (2005) Equilibrium and growth shapes of crystals: how do they differ and why should we care? Cryst Res Technol 40(4-5):291–306
- Singer-Loginova and Singer (2008) Singer-Loginova I, Singer H (2008) The phase field technique for modeling multiphase materials. Reports on Progress in Physics 71(10):106,501
- Stinner et al. (2004) Stinner B, Nestler B, Garcke H (2004) A diffuse interface model for alloys with multiple components and phases. SIAM J Appl Math 64(3):775–799
- Thijssen et al. (1992) Thijssen JM, Knops HJF, Dammers AJ (1992) Dynamic scaling in polycrystalline growth. Phys Rev B 45:8650–8656
- Thornton et al. (2003) Thornton K, Ågren J, Voorhees P (2003) Modelling the evolution of phase boundaries in solids at the meso- and nano-scales. Acta Materialia 51(19):5675 – 5710
- Urai et al. (1991) Urai JL, Williams PF, van Roermund HLM (1991) Kinematics of crystal growth in syntectonic fibrous veins. J Struct Geol 13(7):823 – 836
- Williams and Urai (1989) Williams PF, Urai JL (1989) Curved vein fibres: an alternative explanation. Tectonophysics 158(1–4):311 – 333
- Yardley and Jamtveit (1997) Yardley BWD, Jamtveit B (1997) Fluid flow and transport in rocks : mechanisms and effects. Chapman & Hall, London
- Zhang and Adams (2002) Zhang J, Adams JB (2002) Facet: a novel model of simulation and visualization of polycrystalline thin film growth. Model Sinul Mater Sc 10(4):381