Disk stability and neutral hydrogen as a tracer of dark matter
Abstract
We derive the projected surface mass distribution for spherically symmetric mass distributions having an arbitrary rotation curve. For a galaxy with a flat rotation curve and an ISM disk having a constant Toomre stability parameter, , the ISM surface mass density as well as both fall off as . We use published data on a sample of 20 well studied galaxies to show that ISM disks do maintain a constant over radii usually encompassing more than 50% of the H i mass. The power law slope in covers a range of exponents and is well correlated with the slope in the epicyclic frequency. This implies that the ISM disk is responding to the potential, and hence that secular evolution is important for setting the structure of ISM disks. We show that the gas to total mass ratio should be anti-correlated with the maximum rotational velocity, and that the sample falls on the expected relationship. A very steep fall off in is required at the outermost radii to keep the mass and angular momentum content finite for typical rotation curve shapes, and is observed. The observation that H i traces dark matter over a significant range of radii in galaxies is thus due to the disks stabilising themselves in a normal dark matter dominated potential. This explanation is consistent with the cold dark matter paradigm.
keywords:
galaxies: structure – galaxies: evolution – galaxies: spiral – galaxies: irregular – dark matter.1 Introduction
H i has long been the best tracer of Dark Matter (DM) in galaxies (e.g. Bosma, 1981; van der Hulst et al., 1993). This is because it typically extends much further than the optically bright portion of a galaxy, in a fairly regular disk. But this ability to trace DM seems uncanny: typically the projected DM surface density scales very well with the measured H i surface density (Bosma, 1981; Sancisi, 1983; Carignan & Beaulieu, 1989; Carignan et al., 1990; Carignan & Puche, 1990a, b; Jobin & Carignan, 1990; Broeils, 1992; Meurer et al., 1996; Hoekstra et al., 2001). Mestel (1963) had already shown that the flat rotation curve typically seen in the outer parts of spiral galaxies requires a surface mass density fall-off in the disk, if that is where the dominant mass is located. This is not what is observed in the optical but close to the behaviour of H i disks. H i not only is a good dynamical tracer of DM but its distribution scales linearly with the DM in the outskirts of galaxies. This has prompted some researchers to posit that DM may be gaseous, perhaps in a disk configuration (Pfenniger et al., 1994; Pfenniger & Combes, 1994; Gerhard & Silk, 1996; Pfenniger & Revaz, 2005; Bournaud et al., 2007; Hessman & Ziebart, 2011). The scaling between DM and H i is also well explained by the Modified Newtonian Dynamics (MOND) hypothesis in which the gravitational force law is modified; in a MOND analysis, H i is the only significant mass in the outskirts of galaxies (e.g. Sanders & McGaugh, 2002). Either explanation poses a problem for the standard Cold Dark Matter (CDM) scenario. A gaseous form of baryonic DM would be dissipative, whereas in the CDM scenario DM only interacts via gravity and so is non-dissipative. The MOND scenario requires no DM.
We propose an explanation for the linear scaling between H i and DM that is consistent with the CDM scenario. The ISM distribution in disks is configured to maintain a uniform minimum stability over as much of the disk as possible. For a flat rotation curve, this will result in a surface density profile having the same form as the dominant mass. In § 2 we give the basis of our model. In § 3 we gather recent H i rotation curve (RC) data to test this hypothesis. § 4 discusses our results and presents our conclusions.
2 The structure of dynamically stable gas dominated disks
The stability of a purely stellar or purely gaseous disk is a well studied problem starting with the work of Safronov (1960) and Toomre (1964). For a disk to be stable against axi-symmetric perturbations, the support from a combination of random motions and centrifugal forces must be larger than the gravitational attraction. This is expressed as a ratio, the “Toomre ” parameter:
| (1) |
where is the mass density in the disk, is the velocity dispersion, and is the epicyclic frequency given by
| (2) |
with being the rotational velocity at radius . For a purely gaseous disk to be stable , while a purely stellar disk requires for stability. Unstable disks result in the formation of bars and spiral arms which gather the ISM, enhancing star formation efficiency and thus reheating the disk through feedback (Hohl, 1971; Sellwood & Carlberg, 1984; Debattista et al., 2006). The stability of a multi-component disk, i.e. gas and stars, is more complex (Jog & Solomon, 1984; Rafikov, 2001; Romeo & Wiegert, 2011). Here we are concerned primarily with the outer disk, where the ISM mass dominates. In those cases the single fluid given by eq. 1 is sufficient for our purposes. In some of the galaxies we analyse the stellar disk is important, and we show that the results are usually not significantly different over the radii we are concerned with when a multi-component disk analysis is employed.
As done commonly, we consider a galaxy where the dominant mass has a spherical distribution of mass with density , which also contains an embedded “light” (low mass) gas disk having surface mass density . We take the projected total surface mass density to be
| (3) |
This is the projection of a spherical shell onto a ring of the same radius at the equator. This is the correct definition when we are concerned with the rotation curve (hereafter RC, or ) of the dominant mass. Under our assumptions, disk particles in circular orbits only feel the potential of the mass interior to their orbit. We assume this geometry precisely because it allows some simple derivations. Olling & Merrifield (2000) note that theory indicates that DM halos should be somewhat flattened spheroids, but that the limited observations do not clearly state what the flattening typically is. If the DM is in a disk, as might be expected for gaseous form of DM, then the spherical approximation does not hold. As can be discerned from Fig. 1 of Hessman & Ziebart (2011), assuming a spherical geometry will cause us to underestimate at large in this case. However, for typically assumed RC shapes and beyond a few core radii, the ratio of true to inferred changes slowly and only by %. Hence the simplifying assumption of a spherical halo is not critical to our results.
Assuming standard Newtonian gravity and pure circular orbits, it is straight-forward to derive as a function of the RC
| (4) |
which becomes
| (5) |
We define to be the local gas to total mass ratio
| (6) |
The case of being constant corresponds to the gas disc tracing the total mass. We will also have occasion to consider the integrated quantity
| (7) |
where is the mass within the maximum radius, , of the H i distribution.
We emphasise that the mass densities , and in eq. 3 and throughout are the projected and spherically averaged mass densities of all mass, i.e. disk (stars and gas), bulge, and halo (luminous and dark). Likewise and are the local and integrated gas to total mass ratio. We adopt these definitions to simplify the analysis, avoiding the need to fit the rotation curve into contributions from the different components. The quantity is thus the reciprocal of the ratio plotted in Fig. 7 of Bosma (1981) where it first became apparent that H i traces whatever dominates the mass in the outskirts of galaxies. The implications of our results stem from the well established result that at large radius the dominant form of mass in galaxies is DM (e.g. Freeman, 1970; Rubin et al., 1978; Faber & Gallagher, 1979; Kent, 1987; Carignan & Beaulieu, 1989; Carignan et al., 1990; de Blok et al., 2008).
Solving eq. 1 for and employing eq. 2 and eq. 5 yields
| (8) |
It is instructive to adopt a power law form to the RC
| (9) |
where is a constant. This approximation works fairly well over a limited range of radii in galaxies, which is sufficient for our purposes. This results in
| (10) |
The power law index has a narrow range of allowed values:
| (11) |
A below this range means the RC drops faster than Keplerian, while above this range requires a “hollow” mass distribution. corresponds to since this requires . In the outer disks of many disk galaxies the RC is flat at its maximum value, hence , , and thus
| (12) |
If and are also constant, or their ratio is, then is also constant and the gas disk will track the total mass distribution. From eq. 5 then
| (13) |
This is the well known relationship of the total surface mass density falling off as where the RC is flat, which is a fair approximation of what is observed in most spiral galaxies.
We posit that disks evolve towards maintaining a constant . Simple feedback should encourage such a condition. Over the optical face of a galaxy, star formation is likely to be the regulating agent. Regions of the disk where is higher than average have a disk that is a combination of hot or under-dense compared to their surroundings. In these regions any star formation activity would decrease (relative to their surroundings), lowering , thus allowing more ISM to accumulate or cool and decreasing . In regions where is low, the disk is a combination of cold or over-dense. Star formation will be enhanced in these areas, increasing as feedback from the newly born stars kicks in. While the outer disk is usually considered to be devoid of star formation, the discovery of outlying H ii regions (Ferguson et al., 1998) and XUV disks (Thilker et al., 2005, 2007) indicates that in many cases there are sources of new stars that can help regulate disks. Even in the case of pure gaseous disks, the simulations by Wada et al. (2002) show that a turbulent clumpy disk develops with a large range of over short scales, but with a quasi-steady equilibrium maintained with little variation in average with time or radius.
3 Outer disk Q measurements
We gathered data on 20 galaxies to test our hypothesis that outer disks maintain a nearly constant . The majority of the data is from The H i Nearby Galaxy Survey (THINGS) for which detailed published RCs can be found in Oh et al. (2008) and de Blok et al. (2008). Data from individual studies of six additional galaxies with extended disks are included to test the robustness of the results (Cannon et al., 2009; Elson et al., 2010; Gentile et al., 2007; Struve et al., 2010; Warren et al., 2004; Westmeier et al., 2011). The main criteria for selection is that the galaxy have tabulated data available from recent studies (within years) and H i profiles extending beyond the optical radius (where the band surface brightness is 25 mag arcsec-2). Table 1 lists basic quantities of the sample and the data sources, arranged by the maximum rotational velocity . This sample covers and the full range of late-type galaxy morphologies including spirals from types S0 (NGC 1167) to Sd (e.g. NGC 300), irregulars of types Sm (IC 2574) and Im (e.g. NGC3741) as well as Blue Compact Dwarf (BCD) galaxies (e.g. NGC 2915). The majority of the sample is nearby, with only two having distance Mpc. Therefore, we adopt values that are not based on the Hubble flow, where possible. The sources of are given in Table 1. For the two cases where we use based on redshift, we adopt the model given by NED111The NASA/IPAC Extragalactic Database (NED) is operated by the Jet Propulsion Laboratory, California Institute of Technology, under contract with the National Aeronautics and Space Administration. for the Hubble flow corrected for inflow to the Virgo cluster, Great Attractor, and Shapley super-cluster (Mould et al., 2000) and standard cosmological parameters , , and
| Galaxy | morphology | Data ; distance source | |||||
|---|---|---|---|---|---|---|---|
| (1) | (2) | (3) | (4) | (5) | (6) | (7) | (8) |
| DDO154 | IB(s)m | 4.3 | 1.24 | 8.28 | 0.45 | 50 | de Blok et al. (2008); Makarova et al. (1998) |
| NGC3741 | Im | 3.2 | 0.97 | 6.97 | 0.22 | 52 | Gentile et al. (2007); Dalcanton et al. (2009) |
| ESO215 | Ima | 5.2 | 0.80 | 10.82 | 1.46 | 52 | Warren et al. (2004); Karachentsev et al. (2007) |
| NGC2366 | IB(s)m | 3.4 | 2.20 | 8.20 | 0.81 | 58 | Oh et al. (2008); Dalcanton et al. (2009) |
| IC2574 | SAB(s)m | 3.8 | 7.26 | 11.07 | 1.67 | 78 | Oh et al. (2008); Dalcanton et al. (2009) |
| NGC2915 | BCDb | 4.1 | 1.23 | 10.12 | 0.49 | 86 | Elson et al. (2010); Meurer et al. (2003) |
| NGC300 | SA(s)d | 2.0 | 5.81 | 19.36 | 2.55 | 99 | Westmeier et al. (2011); Freedman et al. (2001) |
| ADBSJ1138 | BCDc | 50.0 | 2.27 | 24.20 | 1.92 | 106 | Cannon et al. (2009); NED |
| NGC7793 | SA(s)d | 3.9 | 5.78 | 7.74 | 1.11 | 118 | de Blok et al. (2008); Karachentsev et al. (2003b) |
| NGC2403 | SAB(s)cd | 3.2 | 7.52 | 18.01 | 3.59 | 144 | de Blok et al. (2008); Freedman et al. (2001) |
| NGC3198 | SB(rs)c | 13.8 | 13.22 | 37.51 | 14.50 | 159 | de Blok et al. (2008); Freedman et al. (2001) |
| NGC3621 | SA(s)d | 6.6 | 9.57 | 25.77 | 9.43 | 159 | de Blok et al. (2008); Freedman et al. (2001) |
| NGC4736 | (R)SA(r)ab | 4.7 | 5.41 | 9.61 | 0.52 | 198 | de Blok et al. (2008); Karachentsev et al. (2003a) |
| NGC6946 | SAB(rs)cd | 6.8 | 10.79 | 22.08 | 7.00 | 224 | de Blok et al. (2008); Karachentsev et al. (2000) |
| NGC5055 | SA(rs)bc | 7.9 | 14.30 | 38.15 | 8.29 | 212 | de Blok et al. (2008); Tully et al. (2009) |
| NGC2903 | SA(rs)bc | 8.9 | 15.50 | 29.34 | 6.45 | 215 | de Blok et al. (2008); Drozdovsky & Karachentsev (2000) |
| NGC3521 | SAB(rs)bc | 10.7 | 11.49 | 31.17 | 12.70 | 233 | de Blok et al. (2008) |
| NGC3031 | SA(s)ab | 3.6 | 11.42 | 14.80 | 4.05 | 260 | de Blok et al. (2008); Freedman et al. (2001) |
| NGC2841 | SA(r)b: | 14.1 | 28.90 | 51.68 | 13.90 | 324 | de Blok et al. (2008); Saha et al. (2006) |
| NGC1167 | SA0- | 66.0 | 23.49 | 63.88 | 12.20 | 377 | Struve et al. (2010); NED |
Columns: (1) galaxy name; (2) galaxy morphology from the RC3 catalogue (de Vaucouleurs et al., 1991) except as following: a. Warren et al. (2004), b. Meurer et al. (1994), c. Cannon et al. (2009); (3) Distance in Mpc; (4) radius at the band 25 mag arcsec-2; (5) radius of the outermost H i measurement; (6) H i mass in ; (7) Maximum rotation amplitude in km s-1.
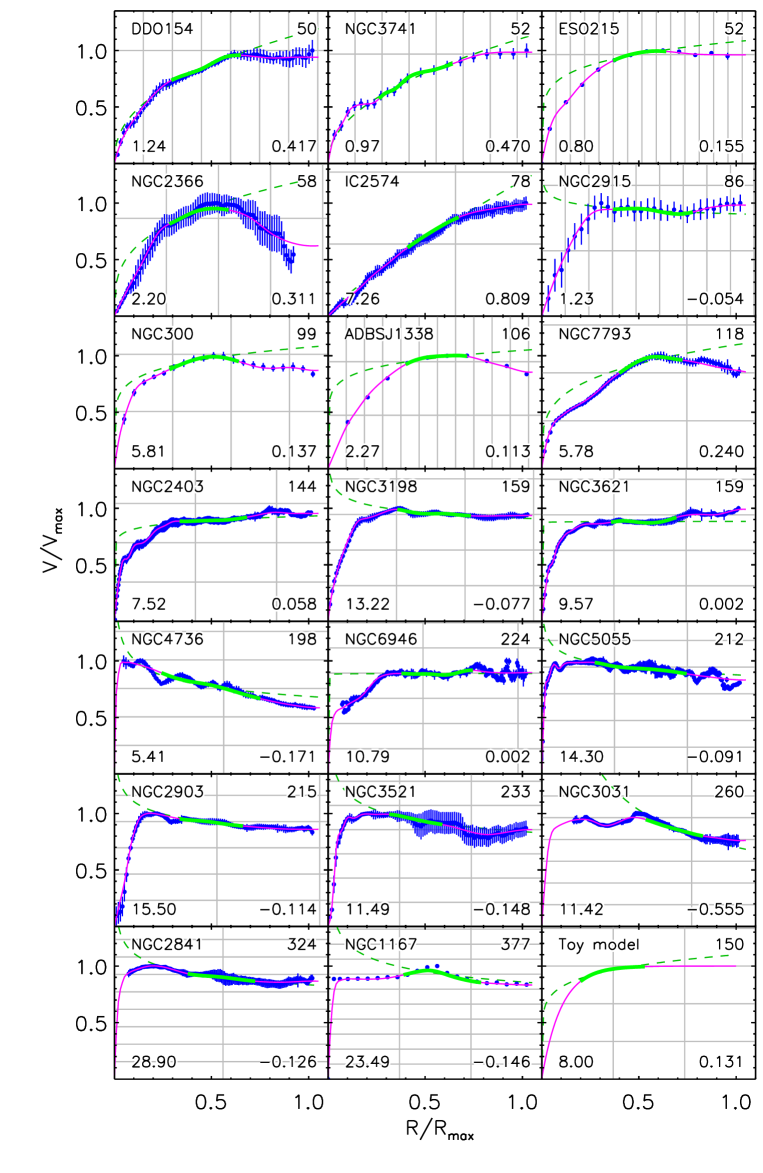
The main observational quantities of importance are the RC and the profile. The RCs are shown in Fig. 1. We fit a cubic-spline to the RCs using knots set by eye. In performing the fit, we keep the number of spline knots to a minimum and try to follow the data to within the errors. However, we smooth over small scale fluctuations in the RCs, presumably due to spiral arms or non circular motions. The fitted splines are shown as continuos lines in Fig. 1. We chose this functional form for its flexibility and because it allows for easy evaluation of the derivative needed for the calculation of and thus . For comparison, we plot a model RC using the functional form adopted by Leroy et al. (2008), with parameters , , and kpc. The sample includes many galaxies with flat RCs at large radii, like this model (DDO154, ESO215222full name: ESO215-G?09 (Warren et al., 2004)., NGC 2915, NGC 2403, NGC 3198, NGC 6946, NGC 2841), or are still rising (IC 2574, NGC 3741, NGC 3621). However, about half the sample have RCs that have a substantial range of radii where they are declining (NGC 2366, NGC 300, ADBS J1138333full name: ADBSJ 113845+2008 (Cannon et al., 2009)., NGC 7793, NGC 4736, NGC 5055, NGC 2903, NGC 3521, NGC 3031, NGC 1167). To illustrate the range of shapes, we fit a power-law RC to the data between a limited range of radii, defined below. These and the other power-law fits in this paper were performed as linear fits in log-log space using the IDL procedure MPFIT (Markwardt, 2009). The fits are shown as dashed lines in Fig. 1, with the fit parameters, including zeropoint, slope , and dispersion of the residuals listed in Table 2.
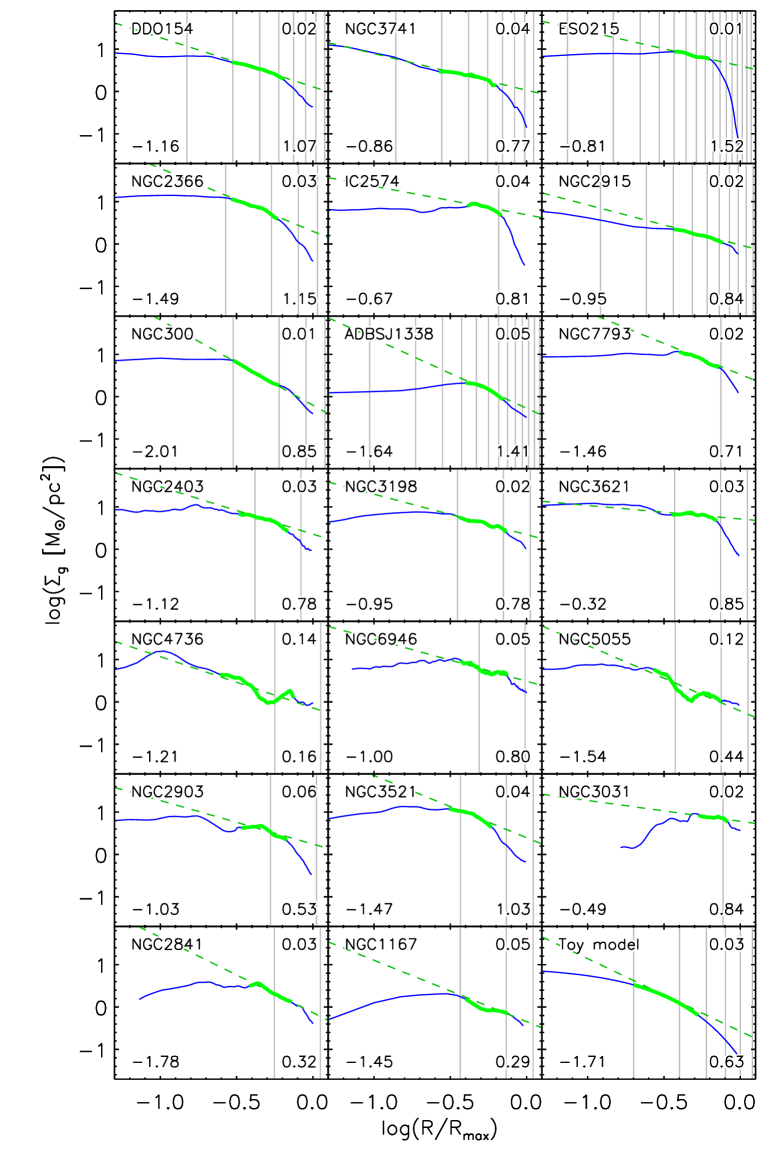
The profiles are shown in Fig. 2. They were derived from the inclination corrected H i profiles assuming to account for elements heavier than hydrogen. Since we are primarily interested in the outer disk we assume that the molecular content is negligible. The profiles are drawn in log-log space, to highlight any power-law behaviour. In general, the profiles are nearly flat or decreasing towards small radii, and steeply dropping at the largest radii, leaving a “knee” where the profile has an approximately power law form. We examined each profile and determined the inner and outer radii at which the power-law portion begins and ends, respectively, and the fraction of the total H i mass within those radii. On average 21()% of is interior to the inner radius and 75()% is interior to the outer, hence the power law knee contains a bit over 50% of on average. In order to treat the galaxies consistently, we determine the radii enclosing 25% and 75% of , and respectively, and fit a power law
| (14) |
to the points between these radii. The fits are shown in Fig. 2 with the parameters listed in the corners of the panels and in Table 2. The range to is highlighted in our figures by using thicker lines to plot the profiles. spans the range (NGC 300) to (NGC 3621). The power law fit is reasonable. The average dex (10%), and in only two cases is dex (in NGC 4736, NGC 5055).
While we use a power law approximation of for convenience, H i profiles are not always characterised as such in the literature. Ferguson & Clarke (2001), for example, use an exponential profile:
| (15) |
where is the central ISM surface mass density and is the disk scale length. They show that the ISM in their viscous disk models are well characterised by such a profile over a wide range in radii, with the ISM scale length greater than that of the stellar disk (which is well known to follow an exponential profile; Freeman, 1970). The bottom right panel of Fig. 2 shows an exponential profile having and . This profile is similar in shape to that of our sample. We fit a power law to this profile in the same manner as the sample galaxies, and report the results in Table 2 and Fig 2. Over the relevant to a power law fit to an exponential profile gives a of dex (7%). In comparison, 55% of our sample have less than or equal to this. Thus a power law is at least as good a functional form as an exponential for about half the sample.
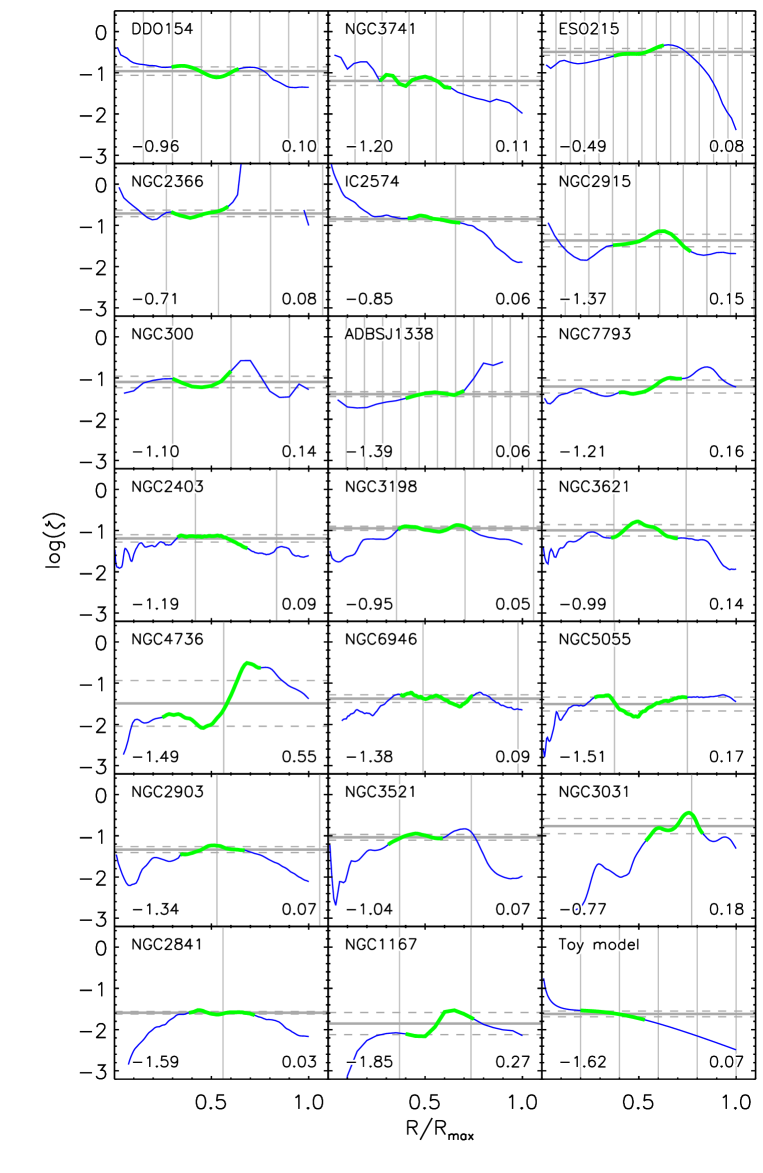
Figure 3 shows the profiles in order to test the premise that H i traces the total mass. To form the ratio we take from the observed profile and from eq. 5. In general the profiles are highly structured. This is due to irregularities in both the and profiles. The profiles are particularly sensitive to the latter since it depends on the derivative of the RC (eq. 5). The toy model, which combines the smooth RC shown in Fig. 1 and the smooth profile shown in Fig. 2, has dex. Six of the galaxies in the sample have profiles that have at this level or smaller.
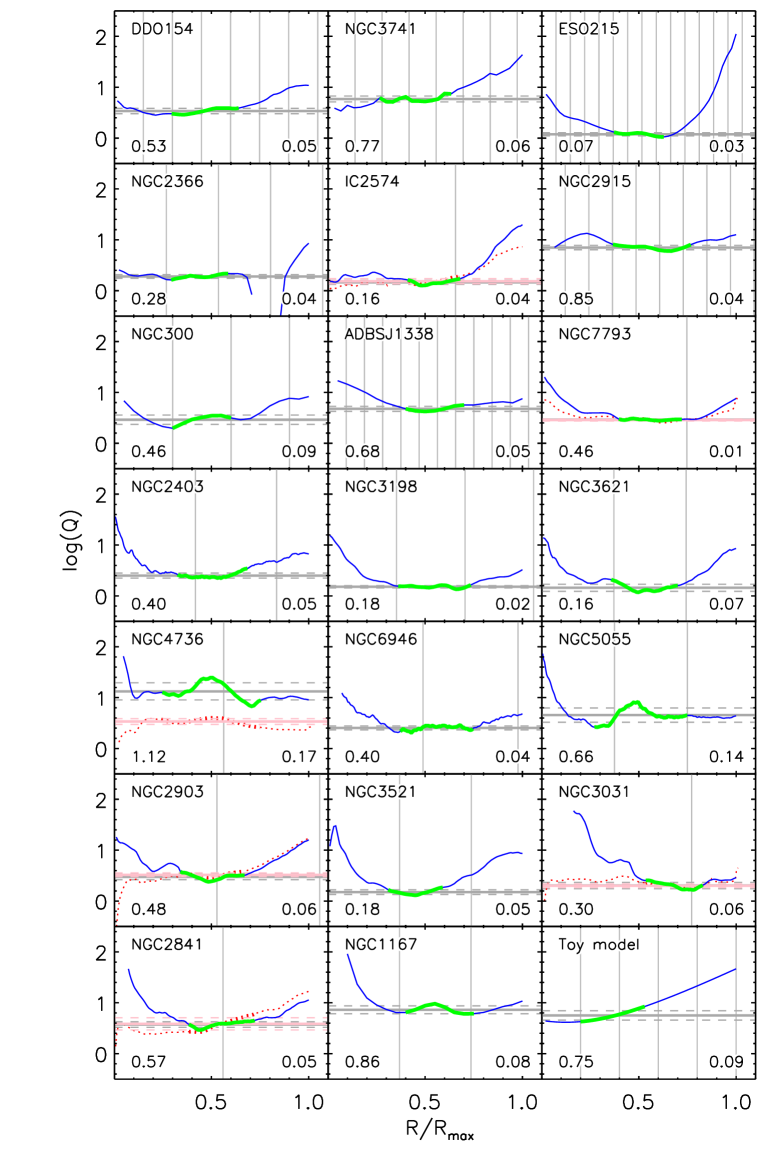
Figure 4 shows the profiles, for an assumed constant velocity dispersion . The average between and and the in this value are listed in Table 2 and the panels of Fig. 4. For the majority of the sample is quite flat between and , and somewhat beyond for many cases. Over this range, the average is 0.06 dex (15%), while in two cases it is more than twice that: NGC 4736 and NGC 5055, for which the variation in corresponds largely to irregular structure in the profile (Fig. 2). For NGC 2366, becomes undefined for much of the disk beyond because, in this case, its RC is declining more steeply than a Keplerian decline. Since this is unphysical, it is likely that a warp or non-circular motions cause the RC of Oh et al. (2008) to be underestimated. In the bottom right panel we combine the toy models shown in Fig. 1 and Fig. 2. This model has dex, while 70% of our sample have values less than or equal to this. As expected, is rising beyond for the majority of the sample.
The we adopt is in the middle of the pack compared to what has been adopted in other studies; e.g. Kennicutt (1989) adopts , while Leroy et al. (2008) use . Changing to a different constant will only change by a constant multiplicative value. Following Tamburro et al. (2009) we also performed calculations where declined linearly with radius, using their profiles for the few overlapping cases between our study and theirs, and otherwise setting at and falling linearly with radius to at the last measured point of the radial profiles. The resultant profile do not look very different from fig. 4; in particular, the decline in does not remove the rise in often found at large .
While Fig. 4 shows that is fairly constant over radii incorporating about half of the H i, usually it increases outside this range. The explanation of what is happening at large radii is fairly simple. There, RCs typically are flat or become flatter as can be seen in Fig 1. As shown by eq. 13, for to be constant in this limit requires . Such a profile can not be maintained to arbitrary radius because it would require infinite . To have a disk with finite mass and angular momentum requires a more rapid drop-off in , as is observed beyond (Fig. 2), hence typically rises at the largest radii. Hoekstra et al. (2001) point out that the sharp drop off in at large does not correspond to an expected decline in RCs, thus casting doubt on the ability of H i to trace DM. Hessman & Ziebart (2011) counter that the fitting technique of Hoekstra et al. (2001) over emphasises the RC fits at large where much of the hydrogen is ionised. Neutral or ionised, there is a finite ISM mass, and this will limit the ability of the ISM to trace DM.
There are multiple causes for the rising profiles towards small radii. The central parts of galaxies typically have a significant molecular content, which we have not included here, hence is overestimated. In addition, the stellar disk usually dominates the mass distribution, so that a single component is inadequate for determining the true disk stability (Leroy et al., 2008; Romeo & Wiegert, 2011). Our assumption has been that the H i largey resides in the outer disk. However, in six of the sample galaxies (IC 2574, NGC 7793, 4736, 2903, 3031, and 2841) the fitting range is largely interior to , hence the stellar disk is likely to play an important role in determining the stability of the disk in these cases.
In order to determine the true disk stability for these cases, we calculated the two fluid (stars and gas) stability parameter . There are various formulations of the two fluid stability parameter (e.g. Jog & Solomon, 1984; Wang & Silk, 1994; Rafikov, 2001; Romeo & Wiegert, 2011). Here, we calculate from eq. 9 of Romeo & Wiegert (2011) which accounts for the thickness of the stellar and gaseous disks. It can be rewritten in a simplified form as
| (16) |
Where and are the stability parameters for the stellar and gaseous components of the disk calculated separately using eq. 1, and , are weight factors which depend on the velocity dispersions of the stars and gas and the value of compared to . Calculation of requires the stellar mass density in the disk which we derive from the stellar mass radial profiles of de Blok et al. (2008), and the radial component of the stellar velocity dispersion ellipsoid . We take following Shapiro et al. (2003) where is the vertical component of the stellar velocity dispersion. This is given by
| (17) |
where is the total disk surface mass density and is the stellar disk scale height. Following Leroy et al. (2008) we estimate the scale height from the disk scale length using and fit the exponential scale length over the same fit region as highlighted in our figures. While we are primarily are concerned with over the fitted region it is instructive to also see its behaviour beyond this range. In the central regions, in cases where the measured is greater than the extrapolated exponential fit, we replace with this fit, under the assumption that the excess light represents a bulge or thick disk with a scale height larger than the disk and thus has a lesser contribution to the disk potential than is expected for the surface brightness. Similarly, at large , beyond the last measured , we also adopt the extrapolated fit when calculating . The results of the calculations are shown in Fig 4 as the red dotted lines. The average over the fitted range is shown as the thick pink lines and the dashed pink lines are offset from this line by its rms.
Figure 4 demonstrates that the profiles are flatter than the profiles when the entire radial range is considered. The biggest difference is for NGC 4736 where the average dispersion is over the fitted region; the dispersion is a factor of three lower than that for the gas . For the remaining cases, the difference between and are more subtle, over the fitted range where we find , , , , and for IC 2574, NGC 7793, 2903, 3031, and 2841 respectively. The dispersion in is smaller than that of for half the cases: NGC 4736, 2903, and 3031. In most cases is an adequate proxy for the total disk stability parameter at the radii we are interested in here, even when much of the H i is within the optical radius. However, a more sophisticated analysis, such as using is required to extend the analysis even closer to the center, or in cases like NGC 4736 where the stellar disk strongly dominates the gaseous disk at all radii. In Zheng et al. (2012) we perform such an analysis over the optically bright portion of galaxies, using various prescriptions for . There we show that the assumption of a constant stability disk can explain the relative distributions of gas, stars and star formation over much of the optically bright portion of galaxies.
Close examination of Fig. 1 and Fig. 2 shows that another of our premises is not exactly correct: the RCs are not always flat. Instead there is a rather wide distribution of rotation curve power law indices . What then causes the nearly constant seen in Fig. 4? This requires the numerator and denominator in the defining equation (eq. 1) to have the same shape, i.e. the same slope. For a constant , this requires the and profiles to have the same shape. To test this, we fit a power law to the epicyclic frequency profile. The profiles and the fits to them are shown in Fig. 5, with the relevant fit parameters listed in Table 2 and the panels of Fig. 5. A power law form is a reasonable approximation to the profiles between and .
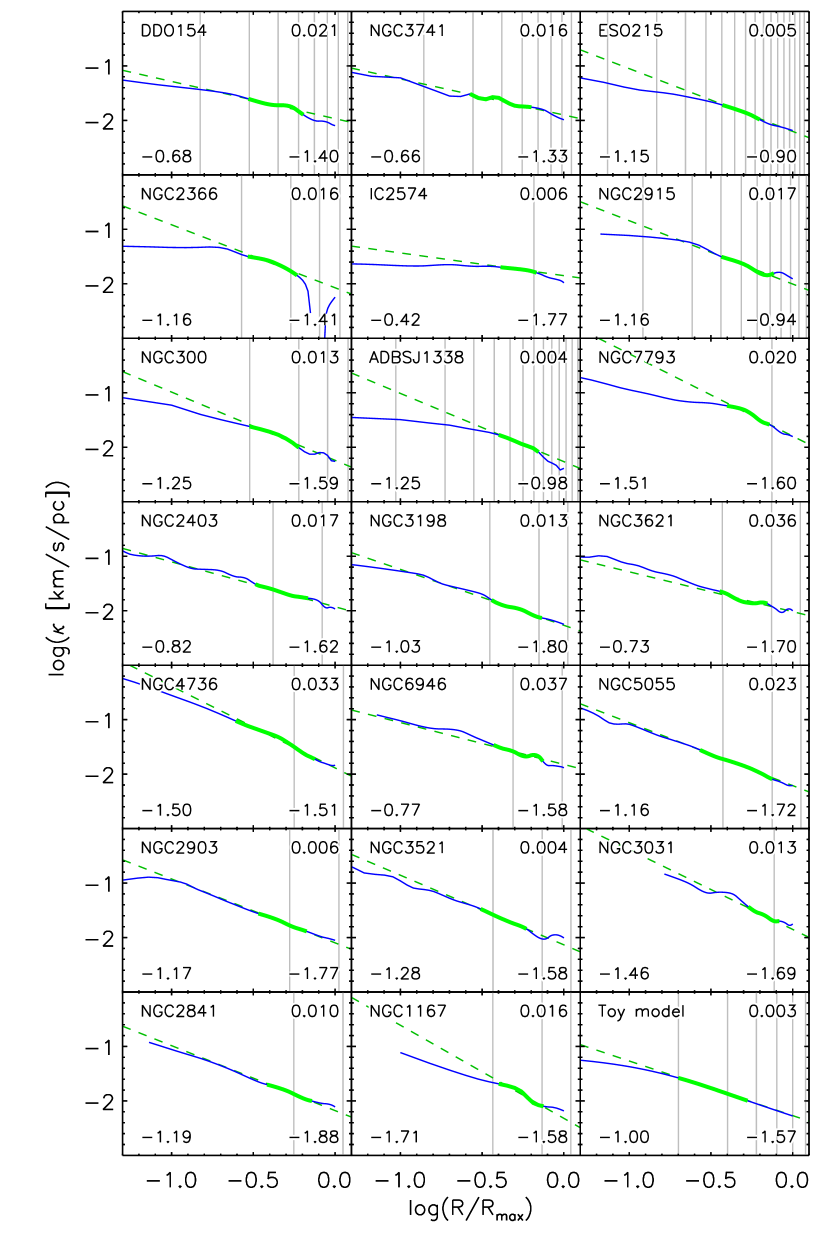
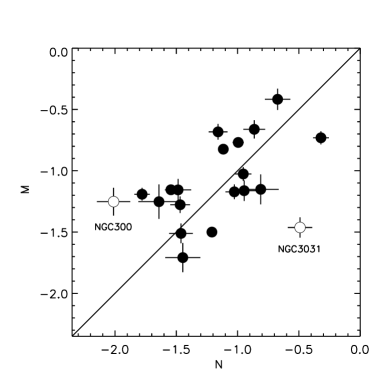
Figure 6 plots the power law index in , against the power law index in , . There is a crude correlation between the indices; the Pearson’s correlation coefficient , with a 2% chance that the correlation is random. Examination of the figure shows that there are two obvious outliers, and we can see plausible reasons for their discrepant behaviour in each case. NGC 3031 (M81) is in a nearby highly interactive group with three close companions (M82, NGC 3077, and HoIX). These may affect the outer ISM distribution of NGC 3031 through either stripping material, or having material stripped from them. NGC 300 has a very extended and lopsided H i distribution and the steepest in our sample. Westmeier et al. (2011) note that there are morphological signs of ram-pressure stripping of the outer disk, which could steepen the profile. They also note that their ATCA data may not capture the total H i flux due to missing short spacings. The profile we use was derived from a data cube that combined the ATCA data of Westmeier et al. (2011) and single dish H i data from the Parkes 64m telescope obtained for the GASS project (Kalberla et al., 2010), thus recovering the H i flux missing from the ATCA observations444Without the Parkes data we would have an even steeper .. Excluding these two galaxies , with a 0.3% chance of being random. We conclude that there is modest correlation between the indices which scatter about the line , that is the and profiles have the same shape. This is exactly what is needed for a constant disk.

A further test of the hypothesis that galaxy disks evolve to constant is given by eq. 12 which predicts that and should be anti-correlated. These quantities are plotted (in the log) in Fig. 7. The filled circles show the average (i.e. ), between and as marked in fig. 3. The expected anti-correlation is clearly present, with ; the probability that this is due to random sampling of uncorrelated data is less than 0.3%. The solid line shows the expected anti-correlation for galaxies with a flat RC, eq. 12, and for the assumed and (this corresponds to the average for our sample). The dashed line is a fit to the data:
| (18) |
The dispersion about this fit dex, while the average offset between the expected relation and this fit is 0.08 dex, very close to what is expected from the standard error on the mean, 0.06 dex. This demonstrates that eq. 12 provides a reasonable model for the average gas to total mass ratio between and .
The hollow circles in Fig. 7 show the ratio plotted against . These quantities are even more strongly anti-correlated with and a less than 0.002% chance that the correlation is due to random sampling of uncorrelated data. The dotted line shows an equally weighted least squares fit to the data
| (19) |
the dispersion about this fit dex. This is tighter than eq. 18, probably because is better defined than which is more susceptible to noise in the and profiles.
4 Discussion and conclusions
The correlation between the shape of the and profiles shown in Fig. 6 is profound. Since is determined purely by the potential, this implies that the ISM disk is responding to the potential, and hence that secular evolution is driving the correlation. An alternate hypothesis is that the structure of galactic disks is set by the mass and angular momentum accretion history (Barnes, 2002; Sancisi et al., 2008). However, it is not clear why there should be any such correlation under this scenario. CDM simulations indicate that Milky-Way mass galaxies have had typically only two major merger event since (D’onghia et al., 2008; Cole et al., 2007), 10 Gyr ago, which agrees with observations of mergers (Conselice et al., 2008). So, to the extent the accretion is from major-mergers, the outer disks should be very lumpy. Our sample does include some lumpy disks (e.g. NGC 4736 and NGC 5055) and also some galaxies that may currently be interacting (NGC 300, NGC 3031) perhaps contributing to the scatter and outliers in Fig. 6. The fact that the majority of the sample falls on the line suggests that most are not strongly interacting and that prior interactions happened far enough in the past that the disk has re-stabilised and smoothed out to trace . The timescale for doing this is the orbital time ( where is the dynamical timescale). For our sample, the average Gyr. Taking the separation between major merger events to be 3 Gyr, there should be approximately five orbits between mergers, sufficient time for structure in the disk to smooth out. Alternatively, if accretion is slow “cold accretion” (Kereš et al., 2005; Sancisi et al., 2008) the disk would not be expected to be lumpy. However, that scenario does not provide an obvious explanation for the and profiles following each other. Of course, cold accretion combined with feedback to equalize , as advocated here, is consistent with our results.
Previous studies have noted the large scatter in the HI to total or DM ratio (e.g. Bosma, 1981; Hoekstra et al., 2001). This is hard to explain in the context of H i being a linear tracer of a baryonic DM (Hoekstra et al., 2001). We show that an inverse correlation between and is expected from constant disks (eq. 12), and indeed is observed (Fig. 7). This avoids the need to place implausibly large quantities of molecular gas in disks. By linking a luminous component of the disk to the rotational velocity the – relation is reminiscent of the Tully-Fisher relation (Tully & Fisher, 1977) and the baryonic Tully-Fisher relation (Freeman, 1999; McGaugh et al., 2000). However, since is a ratio, it does not provide a means to estimate ISM mass from . To do so, one needs to know the extent of the H i mass distribution, since in the case of the local and the integrated gas to total mass ratio within remain constant and equal to each other. Alternatively, if one has and one can estimate the extent of the ISM distribution. This is typically the case in blind H i surveys, such as HIPASS (Barnes et al., 2001), and ALFALFA (Giovanelli et al., 2005) where the H i flux is known but the source is unresolved. Then one can use eq. 19 to estimate and from that the maximum H i extent
| (20) |
This may be useful for determining whether follow-up observations of a particular galaxy are likely to be fruitful, or estimating the covering factor of H i absorbers (e.g. Zwaan et al., 2005).
Our results imply that secular processes are important for setting disk structure. Lynden-Bell & Pringle (1974) noted that viscous disks should evolve so that mass is concentrated in the centre and angular-momentum goes to infinity. As dissipative encounters cause ISM mass to be funnelled towards the galaxy centre, the disk must also spread to conserve angular momentum, and the ISM disk size should grow with time (e.g. Ferguson & Clarke, 2001). High resolution simulations of galactic disks show that transient density waves can increase the size of disks and alter their metallicity distributions (Roškar et al. 2008a,b). The flattening of metallicity gradients (Werk et al., 2010, 2011) in outer disks may be evidence of ISM circulation in spreading disks. If disks are spreading now, they should have been denser and more compact in the past. This would imply a higher molecular fraction from the increased hydrostatic pressure, as well as increased total gas content (to account for the stars that have since formed). Braun et al. (2011) noted an order of magnitude increase in the molecular mass for the most luminous star forming galaxies from now to , mirroring the increase in the cosmic star formation rate density (e.g. Hopkins & Beacom, 2006). They argue that this implies that recent star formation evolution is largely due to the run down in the available ISM supply. Hanish et al. (2006) made a similar argument based on the slope in being similar to that expected from the star formation law. As outer disks spread and evolve, should remain constant with radius. The exact values of and will be set by feedback (with less efficient star formation in the thinning disk) and the available angular momentum.
Finally, our results do not disprove MOND, nor do they rule out the possibility that some or most of the DM is in a gaseous form. However, some of the appeal of these theories is that it was not clear under the prevailing CDM paradigm why dissipative gaseous disks should trace the non-dissipative CDM halo which resides in a spheroid. Our work provides this linkage by showing that ISM disks will trace DM as a natural consequence of disk stabilisation, and our tests of the H i dominated outer disks are consistent with that interpretation.
Acknowledgments
GRM thanks Claude Carignan for first pointing out the relationship between DM and H i to him in 1992. We thank John Cannon, Ed Elson, Gianfranco Gentile, Christian Struve, Brad Warren, and Tobias Westmeier for providing us with data from their studies. We are especially grateful to Tobias Westmeier for combining his ATCA data of NGC 300 with archival Parkes observations and extracting a new radial profile for us. We thank Ken Freeman and Alan Duffy for useful comments, and the referee Alessandro Romeo for making suggestions that improved the paper. GRM was supported in part by a Research Collaboration Award from the University of Western Australia. ZZ was supported through Galex GI grant NNX09AF85G. This research has made use of the NASA/IPAC Extragalactic Database (NED) which is operated by the Jet Propulsion Laboratory, California Institute of Technology, under contract with the National Aeronautics and Space Administration.
Note added in proof: We note a previous paper that reached similar conclusions that had escaped our attention. Struck-Marcell (1991, ApJ, 368, 348) used a related approach, the assumption that gas disks maintain a balance of hyrdostatic forces, to derive a disk structure of for disks having a flat RC. That paper briefly alludes to the relationship with DM, but does not generalize the problem to arbitrary RC shape as we have done.
References
- Barnes et al. (2001) Barnes D. G., Staveley-Smith L., de Blok W. J. G., et al., 2001, MNRAS, 322, 486
- Barnes (2002) Barnes J. E., 2002, MNRAS, 333, 481
- Bosma (1981) Bosma A., 1981, AJ, 86, 1825
- Bournaud et al. (2007) Bournaud F., Duc P.-A., Brinks E., et al., 2007, Science, 316, 1166
- Braun et al. (2011) Braun R., Popping A., Brooks K., et al., 2011, MNRAS, 416, 2600
- Broeils (1992) Broeils A. H., 1992, A&A, 256, 19
- Cannon et al. (2009) Cannon J. M., Salzer J. J., Rosenberg J. L., 2009, ApJ, 696, 2104
- Carignan & Beaulieu (1989) Carignan C., Beaulieu S., 1989, ApJ, 347, 760
- Carignan et al. (1990) Carignan C., Charbonneau P., Boulanger F., et al., 1990, A&A, 234, 43
- Carignan & Puche (1990a) Carignan C., Puche D., 1990a, AJ, 100, 394
- Carignan & Puche (1990b) Carignan C., Puche D., 1990b, AJ, 100, 641
- Cole et al. (2007) Cole S., Helly J., Frenk C. S., et al., 2007, MNRAS, 383, 546
- Conselice et al. (2008) Conselice C. J., Rajgor S., Myers R., 2008, MNRAS, 386, 909
- Dalcanton et al. (2009) Dalcanton J. J., Williams B. F., Seth A. C., et al., 2009, ApJS, 183, 67
- de Blok et al. (2008) de Blok W. J. G., Walter F., Brinks E., et al., 2008, AJ, 136, 2648
- de Vaucouleurs et al. (1991) de Vaucouleurs G., de Vaucouleurs A., Corwin H. G., et al., 1991, Third Reference Catalogue of Bright Galaxies. Springer Verlag
- Debattista et al. (2006) Debattista V., Mayer L., Carollo C., et al., 2006, ApJ, 645, 209
- D’onghia et al. (2008) D’onghia E., Mapelli M., Moore B., 2008, MNRAS, 389, 1275
- Drozdovsky & Karachentsev (2000) Drozdovsky I. O., Karachentsev I. D., 2000, A&AS, 142, 425
- Elson et al. (2010) Elson E. C., de Blok W. J. G., Kraan-Korteweg R. C., 2010, MNRAS, 404, 2061
- Faber & Gallagher (1979) Faber S. M., Gallagher J., 1979, ARA&A, 17, 135
- Ferguson et al. (1998) Ferguson A., Wyse R., Gallagher J., et al., 1998, ApJ, 506, L19
- Ferguson & Clarke (2001) Ferguson A. M. N., Clarke C. J., 2001, MNRAS, 325, 781
- Freedman et al. (2001) Freedman W. L., Madore B. F., Gibson B. K., et al., 2001, ApJ, 553, 47
- Freeman (1970) Freeman K. C., 1970, ApJ, 160, 811
- Freeman (1999) Freeman K. C., 1999, in Davies J. I., Impey C., Phillipps S., eds, “The Low Surface Brightness Universe”, IAU Col 171, ASP Conf Series, #170 . p. 3
- Gentile et al. (2007) Gentile G., Salucci P., Klein U., et al., 2007, MNRAS, 375, 199
- Gerhard & Silk (1996) Gerhard O., Silk J., 1996, ApJ, 472, 34
- Giovanelli et al. (2005) Giovanelli R., Haynes M. P., Kent B. R., et al., 2005, AJ, 130, 2598
- Hanish et al. (2006) Hanish D. J., Meurer G. R., Ferguson H. C., et al., 2006, ApJ, 649, 150
- Hessman & Ziebart (2011) Hessman F. V., Ziebart M., 2011, A&A, 532, 121
- Hoekstra et al. (2001) Hoekstra H., van Albada T. S., Sancisi R., 2001, MNRAS, 323, 453
- Hohl (1971) Hohl F., 1971, ApJ, 168, 343
- Hopkins & Beacom (2006) Hopkins A. M., Beacom J. F., 2006, ApJ, 651, 142
- Jobin & Carignan (1990) Jobin M., Carignan C., 1990, AJ, 100, 648
- Jog & Solomon (1984) Jog C. J., Solomon P. M., 1984, ApJ, 276, 114
- Kalberla et al. (2010) Kalberla P. M. W., McClure-Griffiths N. M., Pisano D. J., et al., 2010, A&A, 521, 17
- Karachentsev et al. (2003b) Karachentsev I. D., Grebel E. K., Sharina M. E., et al., 2003b, A&A, 404, 93
- Karachentsev et al. (2003a) Karachentsev I. D., Sharina M. E., Dolphin A. E., et al., 2003a, A&A, 398, 467
- Karachentsev et al. (2000) Karachentsev I. D., Sharina M. E., Huchtmeier W. K., 2000, A&A, 362, 544
- Karachentsev et al. (2007) Karachentsev I. D., Tully R. B., Dolphin A., et al., 2007, AJ, 133, 504
- Kennicutt (1989) Kennicutt R. C., 1989, ApJ, 344, 685
- Kent (1987) Kent S. M., 1987, AJ, 93, 816
- Kereš et al. (2005) Kereš D., Katz N., Weinberg D. H., et al., 2005, MNRAS, 363, 2
- Leroy et al. (2008) Leroy A. K., Walter F., Brinks E., et al., 2008, AJ, 136, 2782
- Lynden-Bell & Pringle (1974) Lynden-Bell D., Pringle J. E., 1974, MNRAS, 168, 603
- McGaugh et al. (2000) McGaugh S. S., Schombert J. M., Bothun G. D., et al., 2000, ApJ, 533, L99
- Makarova et al. (1998) Makarova L., Karachentsev I., Takalo L. O., et al., 1998, A&AS, 128, 459
- Markwardt (2009) Markwardt C. B., 2009, Astronomical Data Analysis Software and Systems XVIII ASP Conference Series, 411, 251
- Mestel (1963) Mestel L., 1963, MNRAS, 126, 553
- Meurer et al. (2003) Meurer G. R., Blakeslee J. P., Sirianni M., et al., 2003, ApJ, 599, L83
- Meurer et al. (1996) Meurer G. R., Carignan C., Beaulieu S. F., et al., 1996, AJ, 111, 1551
- Meurer et al. (1994) Meurer G. R., Mackie G., Carignan C., 1994, AJ, 107, 2021
- Mould et al. (2000) Mould J. R., Huchra J. P., Freedman W. L., et al., 2000, ApJ, 529, 786
- Oh et al. (2008) Oh S.-H., de Blok W. J. G., Walter F., et al., 2008, AJ, 136, 2761
- Olling & Merrifield (2000) Olling R. P., Merrifield M. R., 2000, MNRAS, 311, 361
- Pfenniger & Combes (1994) Pfenniger D., Combes F., 1994, A&A, 285, 94
- Pfenniger et al. (1994) Pfenniger D., Combes F., Martinet L., 1994, A&A, 285, 79
- Pfenniger & Revaz (2005) Pfenniger D., Revaz Y., 2005, A&A, 431, 511
- Rafikov (2001) Rafikov R. R., 2001, MNRAS, 323, 445
- Romeo & Wiegert (2011) Romeo A. B., Wiegert J., 2011, MNRAS, 416, 1191
- Roškar et al. (008b) Roškar R., Debattista V. P., Quinn T. R., et al., 2008b, ApJ, 684, L79
- Roškar et al. (008a) Roškar R., Debattista V. P., Stinson G. S., et al., 2008a, ApJ, 675, L65
- Rubin et al. (1978) Rubin V. C., Thonnard N., Ford W. K. J., 1978, ApJ, 225, L107
- Safronov (1960) Safronov V. S., 1960, Annales d’Astrophysique, 23, 979
- Saha et al. (2006) Saha A., Thim F., Tammann G. A., et al., 2006, ApJS, 165, 108
- Sancisi (1983) Sancisi R., 1983, in “Internal kinematics and dynamics of galaxies” Proceedings of the IAU Symposium, 100, 55
- Sancisi et al. (2008) Sancisi R., Fraternali F., Oosterloo T., et al., 2008, A&AR, 15, 189
- Sanders & McGaugh (2002) Sanders R. H., McGaugh S. S., 2002, ARA&A, 40, 263
- Sellwood & Carlberg (1984) Sellwood J. A., Carlberg R. G., 1984, ApJ, 282, 61
- Shapiro et al. (2003) Shapiro K., Gerssen J., van der Marel R. P., 2003, AJ, 126, 2707
- Struve et al. (2010) Struve C., Oosterloo T., Sancisi R., et al., 2010, A&A, 523, 75
- Tamburro et al. (2009) Tamburro D., Rix H.-W., Leroy A. K., et al., 2009, AJ, 137, 4424
- Thilker et al. (2005) Thilker D. A., Bianchi L., Boissier S., et al., 2005, ApJ, 619, L79
- Thilker et al. (2007) Thilker D. A., Bianchi L., Meurer G., et al., 2007, ApJS, 173, 538
- Toomre (1964) Toomre A., 1964, ApJ, 139, 1217
- Tully & Fisher (1977) Tully R. B., Fisher J. R., 1977, A&A, 54, 661
- Tully et al. (2009) Tully R. B., Rizzi L., Shaya E. J., et al., 2009, AJ, 138, 323
- van der Hulst et al. (1993) van der Hulst J. M., Skillman E. D., Smith T. R., et al., 1993, AJ, 106, 548
- Wada et al. (2002) Wada K., Meurer G., Norman C. A., 2002, ApJ, 577, 197
- Wang & Silk (1994) Wang B., Silk J., 1994, ApJ, 427, 759
- Warren et al. (2004) Warren B. E., Jerjen H., Koribalski B. S., 2004, AJ, 128, 1152
- Werk et al. (2010) Werk J. K., Putman M. E., Meurer G. R., et al., 2010, ApJ, 715, 656
- Werk et al. (2011) Werk J. K., Putman M. E., Meurer G. R., et al., 2011, ApJ, 735, 71
- Westmeier et al. (2011) Westmeier T., Braun R., Koribalski B. S., 2011, MNRAS, 410, 2217
- Zheng et al. (2012) Zheng Z., Meurer G. R., Heckman T. M., et al., 2012, MNRAS, (submitted)
- Zwaan et al. (2005) Zwaan M. A., van der Hulst J. M., Briggs F. H., et al., 2005, MNRAS, 364, 1467