Effects of spin density wave quantization on the electrical transport in epitaxial Cr thin films
Abstract
We present measurements of the electrical resistivity, , in epitaxial Cr films of different thicknesses grown on MgO (100) substrates, as a function of temperature, . The curves display hysteretic behavior in certain temperature range, which is film thickness dependent. The hysteresis are related to the confinement of quantized incommensurate spin density waves (ISDW) in the film thickness. Our important finding is to experimentally show that the temperature where the ISDW changes from to + 1 nodes decreases as the film thickness increases. Identifying with a first order transition between ISDW states with and + 1 nodes, and using a Landau approach to the free energy of the ISDW together with Monte Carlo simulations, we show that the system at high temperatures explores all available modes for the ISDW, freezing out in one particular mode at a transition temperature that indeed decreases with film thickness, . The detailed dependence of seems to depend rather strongly on the boundary conditions at the Cr film interfaces.
pacs:
75.30.Fv, 73.50.-h, 75.70.AkI Introduction
Besides the superconducting state, itinerant antiferromagnetism is another macroscopic manifestation of a collective quantum state of the charged electrons in a metaloverhauser . Bulk Cr is the paradigmatic and unique simple metal showing this electronic ground state. In single crystalline samples, an incommensurate spin density wave (ISDW) forms below the Néel temperature = 311 K, characterized by wave vectors = along the directionsfawcett . Here = 2.88 Å is the lattice parameter of the Cr bcc unit cell and = is the deviation from commensurability, with the wavelength of the ISDW. This deviation is temperature dependent,werner leading to a variation of from 60 Å at 10 K to 78 Å at 310 K. Above the spin-flip temperature = 123 K, the spin waves are transverse with the spin perpendicular to . Contrary to what happens in single crystals in which all three crystallographic directions are equivalent, in thin Cr filmszabel the wave vector orients perpendicular to the film surface as its thickness decreasessonntag ; bodeker , and the ISDW’s are transverse for all temperaturesbader below . This confinement of the ISDW leads to the quantization of the wave vector , with an integer, giving rise to very interesting hysteretic phenomena.
Fullerton et al.fullerton measured neutron scattering and electrical transport in Cr/Cr97.5Mn2.5 (001) superlattices, where the CrMn layers, being antiferromagnetic with a higher , exert some stringent boundary conditions on the Cr surfaces. They found that temperature cycling produced irreversibility in the derivative of the resistivity and in the neutron scattering scans. These features were attributed to a change in an odd number of nodes in the ISDW inside the Cr layers which is compatible with the magnetic coupling at the interfaces with the CrMn layers.
Recently, Kummamuru et al.kummamuru reported on transport results in epitaxially grown Cr (100) thin films of different thicknesses. Here the boundary conditions are different from those in the superlattices of Fullerton et al. However, they found thermal hysteretic behavior of the Hall coefficient and resistivity for thicknesses below 510 Å. They interpreted these results in terms of ISDW domains with nodes (at high temperatures) or +1 nodes (at low temperatures) in the Cr film. For thicker films (3500 Å) this mechanism disappears, and only an irreversibility in the curves was seen in a wider temperature range, and explained in terms of domain-wall scattering of electrons.
If hysteretic phenomena are indeed related to a first order phase transition taking place between domains of ISDW’s with and +1 nodes inside the Cr layers, it is natural to ask how the transition temperature depends on the Cr thickness. Since for thicker films the number of available modes for the ISDW increases in the whole temperature range where changes, one would naively expect to find the hysteretic behavior at higher temperatures in the thicker films. In this article we address these issues both experimentally and theoretically, and demonstrate that exactly the opposite behavior is found, i.e. the hysteretic region and the transition temperature move towards lower temperatures as the film thickness is increased. We therefore believe that this work throws new light on the understanding of the behavior of ISDWs in confined geometries.
II Experiment
Cr thin films were grown epitaxially on MgO (100) substrates using DC Magnetron Sputtering in a similar way as that reported by Kummamuru et al..kummamuru The films, with thicknesses between 270Å and 1100Å, were characterized by x-ray diffraction showing rocking curves that have an angular dispersion at FWHM around the [002] peak of , indicating a very good degree of epitaxy. Results from AFM scans show a mean surface roughness of about 20Å, which is the third part of at low temperatures. All films were patterned using photolithography and chemical etching in a convenient configuration to perform four terminal measurements of the resistance. It was measured as a function of between 15 and 340K in a commercial cryo-cooler. The error in the resistance measurement was 1/10000, almost independent of .
III Results and Discussion
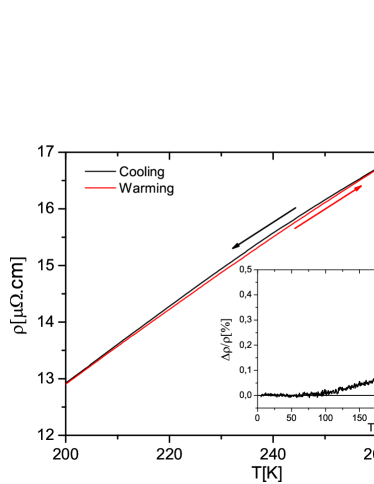
In Fig.1 we show the resistivity of the 270 Å film as a function of temperature in the temperature region where the hysteretic behavior appears in while making a cooling-warming cycle. The inset shows the difference between and () normalized by and expressed as a percentage. Clearly, in a rather small temperature window, the resistivity while cooling down is higher than the values of when warming up the film by an amount that reaches 0.5% at it’s maximum. This value is of the same order of magnitude than that reported by Kummamuru et al.kummamuru
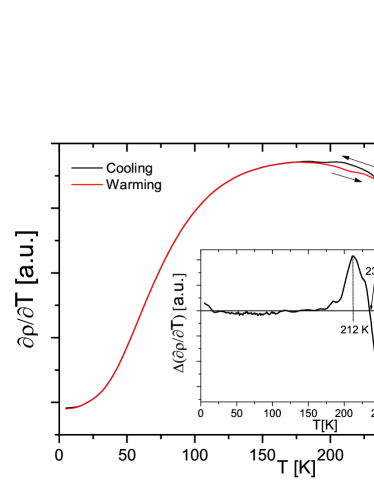
We observed that the derivative of the resistivity curves has an intrinsic noise in the temperature region where the hysteresis is seen, which is not related to the measurement method. We will address this issue in a forthcoming article.ruido For the purpose of the physics we want to analyze here, it is enough to work with the smoothed curves of as a function of T as shown in Fig.2, corresponding to the data displayed in Fig.1. Clearly, the hysteretic behavior seen in is reflected also in the derivatives of both, the cooling and warming cycles. The inset shows the difference between them. We define the temperature at which the derivatives are equal within the hysteretic zone (marked with an arrow) as (= 235 K for 270 Å). This coincides with the temperature at the maximum of . The temperatures where the difference between the derivatives has its maximum and minimum values, below and above , are marked in the insets of Figs.1 and 2 using dotted vertical lines. We call these temperatures and (212 K and 254 K respectively, for 270 Å) and define . As we will show below, the region where the hysteresis occurs is film thickness dependent.
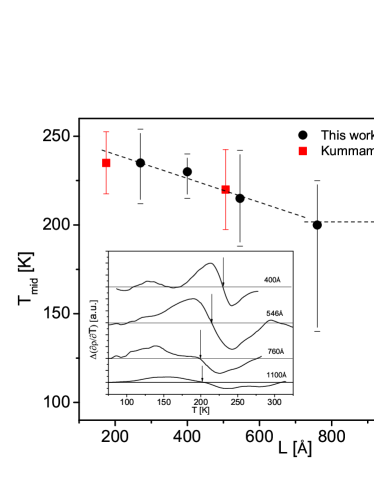
To appreciate the mentioned behavior, we plot in Fig.3 as a function of film thickness . Note that the bars are not error bars but represent the irreversibility region width, , as defined above. It can be observed that there exists a systematic shift of the hysteretic region towards lower temperatures as the film thickness is increased. In fact, goes down and tends to saturate as the film thickness becomes larger than 750 Å. For comparison, we include the data from Kummamuru et al. kummamuru (squares). As can be seen, their data are in very good agreement with our results. This would be expected because both set of films have been grown following the same procedure and over the same type of substrate. In the data of Fullerton et al.fullerton a similar decreasing trend for may be observed, but a much steeper decrease of with thickness seems to be present, at least for the samples reported (63Å and 200Å). Since it is well known that the magnetism at Cr surfaces strongly depends on conditions at its surface or interface zabel , this different behavior might be related to the role played by the CrMn layers in their Cr/CrMn superlattices.fishman
Other important features are worth to remark. In the inset of Fig. 3 we plot the difference of the derivatives as a function of for films of increasing thickness. For the sake of clarity, the vertical zero of each curve has been shifted by an arbitrary offset. The important point here is not the absolute value of , but the temperature at which (cooling) equals (warming). Note that increases, while the amplitude of the difference between and , measured at and , decreases. These two last observations give a clear clue on why the irreversible behavior in is not likely to be seen in thicker samples.
If we identify as the temperature at which a first order transition takes place between a state with an ISDW with nodes to a new state with +1 nodes when the temperature is reduced, then our data clearly show that the transition temperature decreases as the film thickness is increased, tending to saturation for films thicker than 750 Å. In order to explain this behavior of , let us look more in detail the quantization of the ISDW in thin films, which is important to understand the hysteresis of the resistivity in cooling-warming cycles.
As a product of different internal interactions, depends on temperature.werner It varies quite linearly from, = 0.0379 at = 300 K, to = 0.044 at = 200 K. As a direct consequence, changes from 76 Å to 65.5 Å in the same temperature range. At much lower temperatures it saturates to a constant value = 0.048 giving 60 Å.
Since the magnetic instability in the electron system depends on the combination , it is clear that the resulting beating has a fast variation modulated by a long wavelength . Thus, the ISDW in Cr has a wavelength
| (1) |
When the ISDW is confined in Cr films with non-magnetic interfaces, as is the case in our Cr films, we expect a configuration with antinodes (or nodes)mibu at the films’ surfaces. For this case, the available modes are separated by half a wavelength. Given a film with thickness , the allowed values for are therefore , where is either the number of nodes inside the film (antinodes at the surfaces), or antinodes in the film (nodes at the surface).
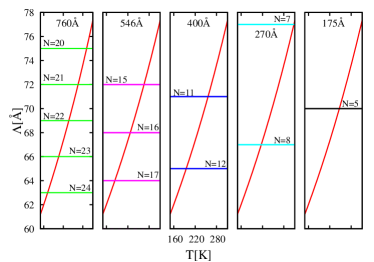
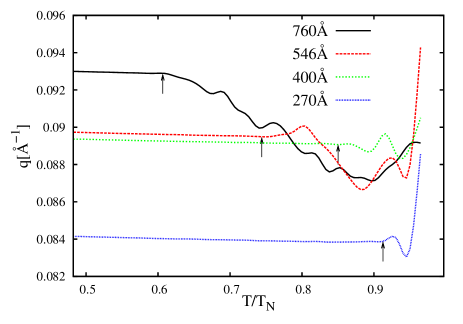
In the window of wavelength values found in bulk chromium given by (60 Å to 78 Å), there are only a few modes available for each film thickness. Their number increases as increases. This is shown in Fig.4 where we plot the allowed modes for each film thickness. The lines correspond to as calculated from equation 1, using a linear approximation for between 200 K and 300 K, obtained from the data in Ref.werner . This approximation seems reasonable because in the thickness range in which our samples lay (270-1100 Å) we do not see appreciable variations of the Néel temperature, indicating that there is no strong dependence of with thickness.fishman-rev ; rotenberg
As can be seen in Fig.4, in the the filmkummamuru of 175 Å, the transition occurs between N = 4 and N = 5 at the temperature where the line corresponding to . Correspondingly, for the 270 Å film the transition between N = 7 and N = 8 lies at a lower temperature. From this, it seems that the transition temperature would decrease with . This reasoning, however, cannot be extended to the other film thicknesses based on the information displayed in Fig.4 alone, because more modes than one become available for the ISDW, and there is no way to choose a priori at which one the transition would occur. In order to understand how the transition temperature depends on , in Section IV we propose a phenomenological model which takes into account this variation of the number of permitted modes when increases, and we also incorporate some dynamics.
IV Model
IV.1 The Free Energy of the ISDW
When the temperature is decreased below , the wavelength of the ISDW in the Cr film would try to follow it’s bulk behavior.werner However, as discussed in the previous section: the ISDW is confined in a film of a given thickness, the variation in temperature of is quantized, and the number of nodes varies discontinuously from to + 1, in a process that involves a first order phase transition. Neutron diffractionfullerton as well as X-ray experimentskummamuru confirm this physical picture in Cr/CrMn multilayers and in Cr thin films respectively.
Let us consider a one-dimensional model of a transverse ISDW with = , where is the direction perpendicular to the film’s surface. In this case the order parameter takes the form = . We can then write an expression for the free energy (per unit length) depending on and ,
| (2) | |||||
where is the part of the free energy which is independent of the ISDW, = 311 K and is the wave vector that the ISDW would have in the bulk material. Following McMillanmcmillan we include the term which gives a contribution proportional to . This takes into account the fact that there exists an energy cost in order to deform the ISDW with respect to it’s bulk form. The key point is that varies in temperature and these variations should be followed by the ISDW in order to keep the energy at a minimum.
There is, nevertheless, a competition between the energy paid to deform the ISDW respect to the bulk, and the energy cost for not satisfying the boundary conditions imposed by the surface. As already mentioned, the most natural way to choose these boundary conditions for Cr films that are not in contact with magnetic materials is to have nodes or antinodes at the surfaces. For both cases , i.e. . Considering this, the surface contribution to the free energy is given by a term proportional to . The way to account for the different possible available modes is simply by selecting the one that gives the lowest contribution to the free energy at a given temperature (see Fig.4). Then, we explicitly have for the free energy,
| (3) | |||||
If the nodes (or antinodes) are pinned at the surface (enough large ), then the free energy displays a series of minima corresponding to parabolic potentials sitting close to each . This is shown in Fig.5 for a fixed amplitude of the order parameter and adequate numeric parameters. Note the change in the potential landscape with temperature. As is decreased the barriers between modes increase and the free energy changes in such a way to give preference to the modes with higher ’s, i.e. shorter wavelengths and more nodes (antinodes) in the ISDW.
In this simple way we can understand how the ISDW’s wavelength is jumping from to + 1 nodes and so on as the temperature decreases. Given the fact that each of these jumps involves a first order transition, hysteresis is expected in cooling-warming cycles.

IV.2 Monte-Carlo Simulation Results

One of the most important results of this work is the description of how the temperature of the maximum hysteresis, , moves to lower values as the thickness of the Cr films is increased. From the scheme shown in Fig.4 it can be inferred that when many ISDW modes are available (larger ’s), a large barrier should be needed in order to freeze the state of the system with the largest number of nodes, otherwise the system would wander between all available modes. Since the ISDW’s amplitude increases with decreasing temperature as well as the barriers do, lower temperatures are needed to freeze the system in a high mode.
To better quantify this, we introduce some dynamics by means of a Monte-Carlo simulation of the system. Here we have a two dimensional phase space and an energy given by Eq.3. The resulting average value of after several runs is shown in Fig.6 for different film thickness as the temperature is decreased. At high temperatures, the system explores all possible ’s for each , but as the temperature is lowered, the ISDW chooses only one and stays there no matter how low the temperature goes. This behavior defines a freezing temperature that we identify with .
The values obtained from the results in Fig.6 for the freezing temperature corresponding to each film thickness, are plotted in Fig.7. Clearly, the freezing temperature follows the same trend as the experimental data for , i.e., it goes down as the film thickness is increased. The saturation seen in the transition temperature in our data for ’s larger than 750 Å naturally occurs in our Monte-Carlo simulations if we put, mimicking the experimental results,werner a constant at low temperatures. With this simple phenomenological model we do not pretend to get a quantitative agreement with our experimental data, but it is important to understand the physics behind the observed hysteretic phenomena.
V Conclusions
We have shown that the hysteretic behavior that appears in in epitaxial Cr thin films is a consequence of the quantization of a transverse incommensurate spin density wave in the direction perpendicular to the film surfaces, with a first order phase transition occurring between domains with and + 1 nodes (or antinodes). The number at which the transition manifests is film thickness dependent, being larger for thicker films. An analysis of the one dimensional ISDW free energy, estimated using McMillan’s approach for CDW’s, together with some dynamics introduced via Monte-Carlo simulations, show that the potential barriers between allowed modes increases as the system is cooled down. As a consequence of this, and for each , at high temperatures the system explores all available modes but remains frozen in a high state at low enough temperatures. Therefore, this simple phenomenological model explains in a natural way the experimental results which show that the temperature at which the transition between and + 1 modes takes place, decreases as the film thickness is increased.
VI Acknowledgements
We would like to thank H. Pastoriza and K. Ogando for help with the patterning of the samples. E.O., E.K. and C.A.B. are members of CONICET. L.T. has a scholarship from CONICET. Work partially supported by PIP No.11220080101821 CONICET, PICT R1776 ANPCyT, and PIP No.1122008010111001 CONICET.
References
- (1) A. W. Overhauser, Phys. Rev. 128, 1437 (1962).
- (2) E. Fawcett, Rev. Mod. Phys. 60, 209 (1988).
- (3) S. A. Werner et al., Phys. Rev. 155, 528 (1967).
- (4) H.Zabel, J. Phys.: Condens. Matter 11, 9303 (1999).
- (5) P. Sonntag et al., J. Magn. Magn. Mater. 183, 5 (1998).
- (6) P. Bödeker et al., Phys. Rev. Lett. 81, 914 (1998).
- (7) E. E. Fullerton et al., Phys. Rev. Lett. 77, 1382 (1996).
- (8) E. E. Fullerton et al., Phys. Rev. Lett. 91, 237201-1 (2003).
- (9) R. K. Kummamuru and Yeong-Ah Soh, Nature (London) 452, 859 (2008).
- (10) C. Balseiro et al., to be published.
- (11) R. S. Fishman and Z.-P. Shi, Phys. Rev. B 59, 13849 (1999).
- (12) K. Mibu et al., Phys. Rev. Lett. 89, 287202-1 (2002).
- (13) R. S. Fishman, J. Phys. Condens. Matter 13, R235 (2001).
- (14) Eli Rotenberg et al., New Jour. of Phys 7, 114 (2005).
- (15) W. L. McMillan, Phys. Rev. B 12, 1187 (1975).