Polycyclic Aromatic Hydrocarbon in the Central Region of the Seyfert 2 Galaxy NGC 1808
Abstract
We present mid infrared (MIR) spectra of the Seyfert 2 (Sy 2) galaxy NGC 1808, obtained with the Gemini’s Thermal-Region Camera Spectrograph (T-ReCS) at a spatial resolution of 26 pc. The high spatial resolution allowed us to detect bright polycyclic aromatic hydrocarbons (PAHs) emissions at 8.6m and 11.3m in the galaxy centre (26 pc) up to a radius of 70 pc from the nucleus. The spectra also present [Ne ii]12.8m ionic lines, and H (2)12.27m molecular gas line. We found that the PAHs profiles are similar to Peeters’s class, with the line peak shifted towards the blue. The differences in the PAH line profiles also suggests that the molecules in the region located 26 pc NE of the nucleus are more in the neutral than in the ionised state, while at 26 pc SW of the nucleus, the molecules are mainly in ionised state. After removal of the underlying galaxy contribution, the nuclear spectrum can be represented by a Nenkova’s clumpy torus model, indicating that the nucleus of NGC 1808 hosts a dusty toroidal structure with an angular cloud distribution of , observer’s view angle , and an outer radius of R0.55 pc. The derived column density along the line of sight is NH = 1.5 cm−2, which is sufficient to block the hard radiation from the active nucleus, and would explain the presence of PAH molecules near to the NGC 1808’s active nucleus.
keywords:
galaxies: Seyfert – galaxies: starburst – infrared: ISM – ISM: molecules – techniques: spectroscopic1 Introduction
Mid-infrared (MIR) spectra of active galactic nuclei (AGN) are dominated by the emission features at 3.3, 6.2, 7.7, 8.6, 11.3 and 12.7 m, commonly called the unidentified infrared (UIR) bands (e.g. Gillett et al., 1973; Geballe et al., 1985; Cohen et al., 1986), and generally attributed to Polycyclic Aromatic Hydrocarbon (PAHs) molecules (Leger & Puget, 1984; Puget & Leger, 1989; Allamandola et al., 1989, 1999). The spectra of AGN also present prominent molecular hydrogen and forbidden emission lines (Sturm et al., 2000; Weedman et al., 2005; Wu et al., 2009; Gallimore et al., 2010; Sales et al., 2010), as well as silicate bands at 9.7 m and 18 m, both in emission and/or absorption.
The absence of PAH emission close to the central engine of active galaxies has been attributed to the destructive effects of highly energetic UV photons (h40 eV) supplied by the active nucleus and, therefore, the presence of these features have been mostly used as a tracer of massive star formation (e.g. Peeters et al., 2004; Siebenmorgen et al., 2004; Allamandola et al., 1999; Tielens, 2008). However, Voit (1992a, b) has shown that PAHs can survive if the hard AGN radiation is shielded by dusty gas with high column density. Recently, Sales et al. (2010) showed that a large fraction ( 70%) of Seyfert galaxies shows bright PAH emission lines, and demonstrated that PAHs in AGN present higher ionisation fraction and larger molecules ( 180 carbon atoms) than in Starburst galaxies.
The unified model of AGNs proposes the existence of a dense concentration of absorbing material surrounding the central engine in a toroidal distribution, which blocks the broad line region (BLR) from the line of sight in Seyfert 2 (Sy 2) galaxies (see Antonucci, 1993). Nowadays such toroidal structure is believed to be composed by gas clumps or clouds (e.g. Hönig et al., 2006; Nenkova et al., 2002). In fact, very recently we (Sales et al., 2011) have shown that the nuclear spectral energy distribution of NGC 3281, a Sy 2 galaxy, can be well described by clumpy torus models with about 14 dusty clouds in the torus equatorial radius. Similar results are also obtained for other AGN (e.g. Ramos Almeida et al., 2009, 2011; Nikutta et al., 2009).
It has been known by approximately five decades that NGC 1808 presents a peculiar nuclei, evidenced by the detection of star forming regions disposed in a circumnuclear ring, the so called hot spots (Sérsic & Pastoriza, 1965; Pastoriza, 1967; Sérsic & Pastoriza, 1967). In addition, Galliano et al. (2005) detected bright MIR sources in the central region of NGC 1808, associated with already known radio sources (Saikia et al., 1990), suggesting that these sources are young embedded star clusters. The presence of an active nucleus in this source is supported by the presence of extended wings on both Hα and [N ii] emission lines (Veron-Cetty & Veron, 1985). These authors found that NGC 1808 falls in the Seyfert region of the Baldwin et al. (1981) diagram with H/[Nii]
and presents the full width at half maximum (FWHM) of H component approximately 550 km/s. In addition, Awaki et al. (1996) have detected hard X-ray emission variability suggesting the presence of a low-luminosity AGN in NGC 1808. This object is a nearby galaxy (d=13 Mpc, using H ) exhibiting evidence that strong star formation and an active nucleus coexist in the central regions, making it a key object to investigate PAH emission and torus structure through N band spectroscopy.
Here we present a detailed study of N band spectra of NGC 1808 using ground-based MIR high angular resolution, R spectra obtained with the Thermal-Region Camera Spectrograph (T-ReCS; Telesco et al., 1998) at the 8.0m Gemini South telescope, achieving a spatial resolution of 036, or pc at NGC1̇808 distance, which makes our data quite adequate to study the molecular and dust distribution in the inner 100 pc of this galaxy. This paper is structured as follows: in Section 2 we describe the observation and data reduction processes. Results are discussed in Section 3. Summary and conclusion are presented in Section 4.
2 Observations and Data Reduction
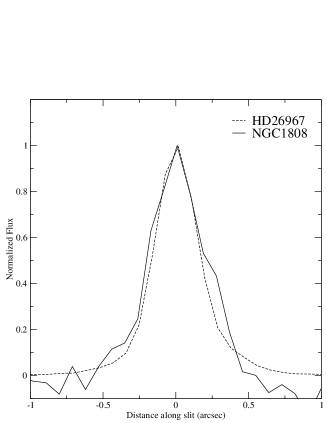
The -band spectra of NGC 1808 were obtained with the T-ReCS in queue mode at Gemini South, in 2009 August 28 and 29 UT, as part of program GS-2009B-Q-19. The observational conditions were photometric, with water vapour column in the range 5–8mm, and image quality of 034 in the -band, measured from the telluric standard acquisition images observed before NGC 1808. The -band luminosity profile of the galaxy is slightly extended with respect to that of HD 26967 telluric star (see Fig. 1)
We used a standard chop-nod technique to remove time-variable sky background, telescope thermal emission, and the effect of 1/f noise from the array/electronics. In order to include only the signal of the guided beam position in the frame and avoid possible nod effects in the spatial direction the slit were oriented along P.A. = 45°with a chop throw of 15″, oriented along P.A. = 45°. The same slit position/nod orientations was used for the telluric standards. The T-ReCS configuration used was the low-resolution ( 100) grating and the 036 slit, for a dispersion of 0.0223 m pixel-1 and a spectral resolution of 0.08 m. The pixel scale is 0.089″pixel-1 in the spatial direction, and the slit is 216 long. The resulting spectral coverage is between 8-13m centred at 10.5m. The total on-source integration time was 900s.
We used the midir and gnirs sub-packages of Gemini IRAF111IRAF is distributed by the National Optical Astronomy Observatory, which is operated by the Association of Universities for Research in Astronomy (AURA), Inc., under cooperative agreement with the National Science Foundation. package to reduce the data. In addition, to extract the final spectrum we combined the chop- and nod-subtracted frames using the tasks tprepare and mistack. Wavelength calibration was obtained from the skylines in the raw frames. To remove the telluric absorption lines from the galaxy spectrum, we divided the extracted spectrum for each observing night by that of the telluric standard star HD 26967 (Cohen et al., 1999), observed before the science target. The flux calibration used the task mstelluric that interpolates a blackbody function to the spectrum of the telluric standard in order to derive the proper instrumental response.
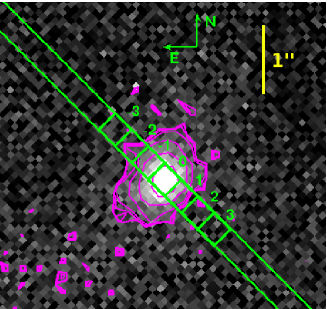
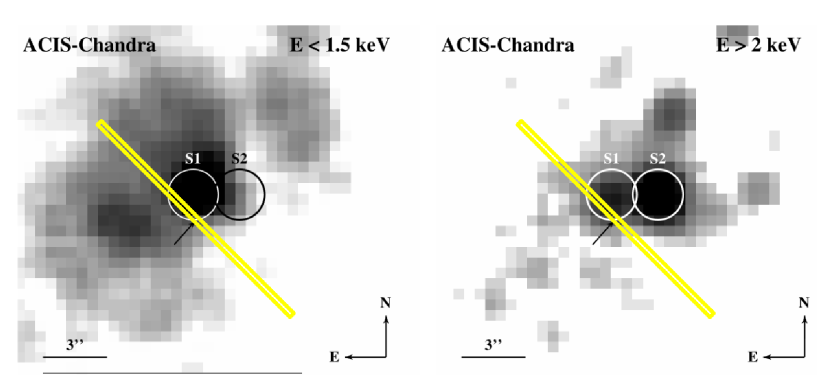
In Fig. 2 we show the T-ReCS slit position superimposed on our N band acquisition image, as well as the hard ( 2keV) and soft ( 1.5keV) X-ray images from Jiménez-Bailón et al. (2005). We can see that the X-ray images show two point-like emission sources offset from the NGC 1808 nucleus (see in Figure 2). These emitting regions were also detected in the radio and infrared images (Saikia et al., 1990; Kotilainen et al., 1996) and have been attributed to supernova remnants (S1) and Hii regions (S2) (Saikia et al., 1990; Kotilainen et al., 1996; Jiménez-Bailón et al., 2005). The T-ReCS slit position crosses the soft X-ray source S1 and diffuse X-ray emission.
 |
 |
3 Results and Discussion
3.1 Emission Lines Measurements and Radial Gradients
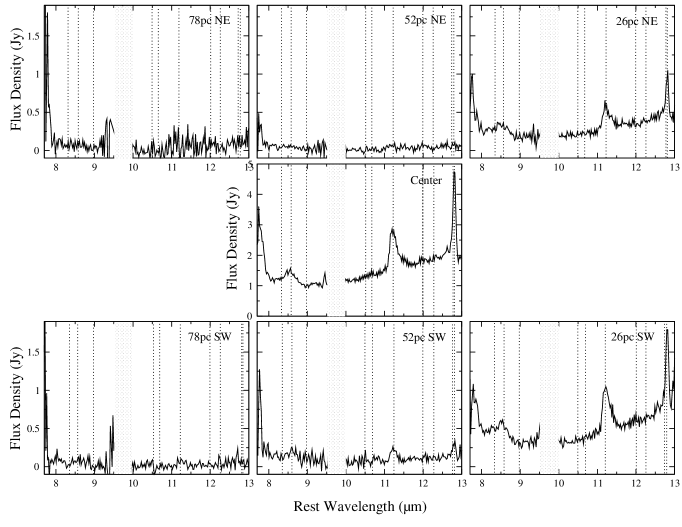
We extracted 7 one dimensional spectra spaced four pixels or 036 ( 26 pc) along the slit: one centred in the unresolved nucleus, and six extractions centred at 26 pc, 52 pc, and 78 pc to the northeast (NE) and southwest (SW) directions. The spectra are presented in Fig. 3, and clearly show intense emission in the PAH bands (8.6 m, 11.3 m and 12.7 m), [Ne ii] 12.8 m ionic line, as well as the molecular hydrogen rotational line, H (2) at 12.27 m, in the nuclear extraction, and at 26 pc in both NE and SW directions. Weak PAH bands are also observed at 52 pc SW direction of NGC 1808, while the outer extractions at 78 pc NE and SW do not show any emission lines. This result indicates that in this galaxy the PAH bands are emitted inside a region less than 70 pc from the active nucleus, and clearly show one of the most rich PAH features at 8.6, 11.3 and 12.7 m observed using T-ReCS so far in AGNs.
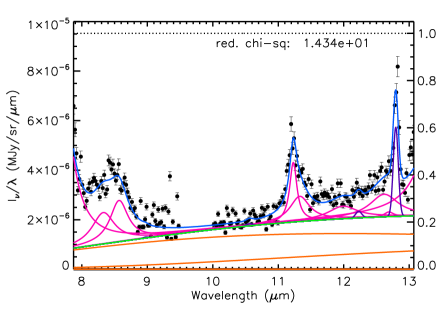
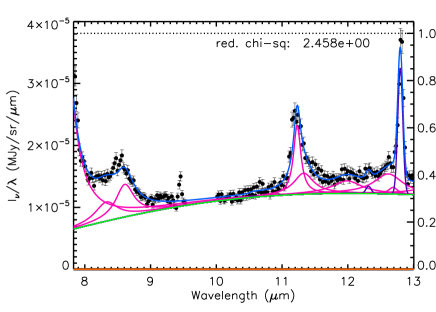
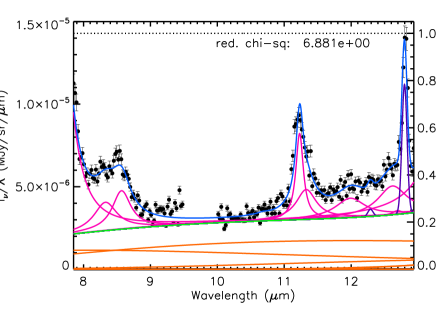
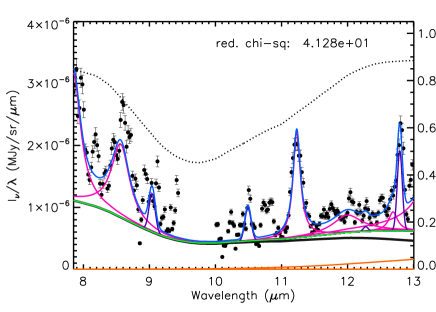
To disentangle the different spectral components in each 1D spectra, both emission lines and continuum, and determine the contribution of each component to the spectral energy distribution (SED) of NGC 1808 as a function of the distance to the galaxy centre, we used the pahfit222Source code and documentation for pahfit are available at http://tir.astro.utoledo.edu/jdsmith/research/pahfit.php code (Smith et al., 2007) routines. The input flux uncertainties required by pahfit were assumed to be 10% of the flux observed, which are the expected ones for T-ReCS observations (see Radomski et al., 2002; Mason et al., 2006).
The pahfit code assumes that the spectrum is formed by continuum emission from dust and starlight, prominent emission lines, individual and blended PAH emission bands, and that the light is attenuated by extinction due to silicate grains. The code use the dust opacity law of Kemper et al. (2004), where the infrared extinction is considered as a power law plus silicate features peaking at 9.7 m. For more details see Smith et al. (2007). The remaining input parameters are the same as those used by Sales et al. (2010), which are appropriate for AGNs. The results of the decomposition of the NGC 1808 spectra are shown in Fig. 4, and the derived emission line fluxes are given in Tabs. 2 and 2. It is worth note that 10.7m PAH emission at the centre and 26 pc NE is at the detection limits and its emission profile can not be seen in the PAHFIT fitting at Fig. 4. In addition, note that the 11.3m PAH emission complex is composed by 11.2m and 11.3m emission bands, which can be seen in Fig. 4.
| Position | Label | 8.3m | 8.6m | 10.7m | 11.3m11footnotemark: 1 | 12.0m | 12.7m | ||||||
|---|---|---|---|---|---|---|---|---|---|---|---|---|---|
| Flux | EW | Flux | EW | Flux | EW | Flux | EW | Flux | EW | Flux | EW | ||
| 26 pc SW | -1 | 3.25 0.1 | 0.562 | 3.15 0.1 | 0.517 | - | - | 2.95 0.2 | 0.396 | 1.19 0.1 | 0.163 | 2.05 0.3 | 0.291 |
| Center | 0 | 5.35 0.8 | 0.119 | 11.2 0.7 | 0.242 | 0.29 0.3 | 0.006 | 11.8 1.2 | 0.251 | 4.85 0.7 | 0.110 | 7.54 1.6 | 0.182 |
| 26 pc NE | 1 | 4.33 0.3 | 0.328 | 4.44 0.2 | 0.334 | 0.11 0.1 | 0.009 | 5.70 0.4 | 0.477 | 2.46 0.5 | 0.208 | 3.46 1.1 | 0.285 |
| 52 pc NE | 2 | - | - | 3.13 0.1 | 0.990 | - | - | 1.32 0.1 | 0.775 | 0.81 0.1 | 0.493 | 0.39 0.1 | 0.265 |
The 11.3m PAH emission complex is composed by 11.2m and 11.3m emission bands.
| Position | Label | [Ar iii]m | [S iv]m | H(2)m | [Ne ii]m | ||||
|---|---|---|---|---|---|---|---|---|---|
| Flux | EW | Flux | EW | Flux | EW | Flux | EW | ||
| 26 pc SW | -1 | 0.20 0.10 | 0.004 | 0.28 0.19 | 0.005 | 0.79 0.25 | 0.016 | 8.08 0.46 | 0.170 |
| Center | 0 | - | - | 0.64 0.10 | 0.001 | 3.13 1.40 | 0.011 | 45.6 2.19 | 0.166 |
| 26 pc NE | 1 | - | - | 0.28 0.11 | 0.001 | 0.98 0.46 | 0.012 | 17.5 9.17 | 0.210 |
| 52 pc NE | 2 | 3.88 0.18 | 0.235 | 2.80 0.13 | 0.238 | 0.24 0.08 | 0.022 | 3.18 0.16 | 0.326 |
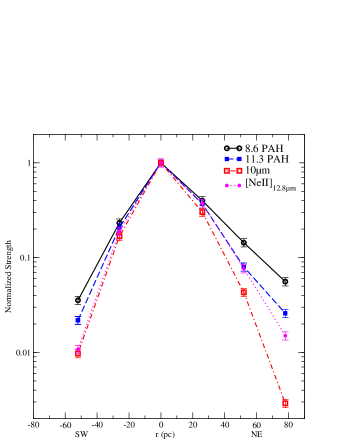
Fig. 5 shows the PAH bands and [Ne ii] 12.8 m emission line integrated fluxes, as well as the 10m flux continuum emission flux, as function of distance to the nucleus. Both emission lines and continuum present a strong decreasing gradient from the centre to the outer regions. The similarity between the luminosity profile of the PAH emission bands, ionic line and continuum suggests that the same mechanism dominates the excitation of both ionic and PAH bands.
3.2 NGC 1808 PAH Profiles Analysis
Peeters et al. (2002) and van Diedenhoven et al. (2004) demonstrated that the PAH bands in a sample of reflection nebulae, Hii regions, young star objects, evolved stars and galaxies can show different profiles, which they proceeded to classify based on their shape and peak position into three classes. The class has the peak shifted to the blue, while and would show the peak centred and shifted to the red, respectively. According to these authors, Hii regions, non-isolated Herbig AeBe stars and young stellar objects generally can be classified as class for all m PAH emission features. Their galaxy sample shows the same profile as the Hii regions ( class) except for the 11.3m profile, which resembles that of some evolved stars ( class). They also point out that most planetary nebulae and post-asymptotic giant branch stars belong to the second group ( class) and just two peculiar post-asymptotic giant branch stars form a third class ( class Peeters et al., 2002; van Diedenhoven et al., 2004). However, Peeters et al. (2002) and van Diedenhoven et al. (2004) do not analyse the PAH line profiles in the AGNs environment. These authors have been attributed the PAH different profiles to differences in the physical conditions, composition of the PAH family and/or the accumulated effect of processing in the regions where the emission originates (see also Genzel et al., 1998; van Diedenhoven et al., 2004; Lebouteiller et al., 2007; Tielens, 2008; Sales et al., 2010). In addition, other authors propose that the trends in the PAH band line profiles and intensities are a function of the PAH molecules size, charge, geometry, and heterogeneity (Hony et al., 2001; Bauschlicher et al., 2008, 2009).
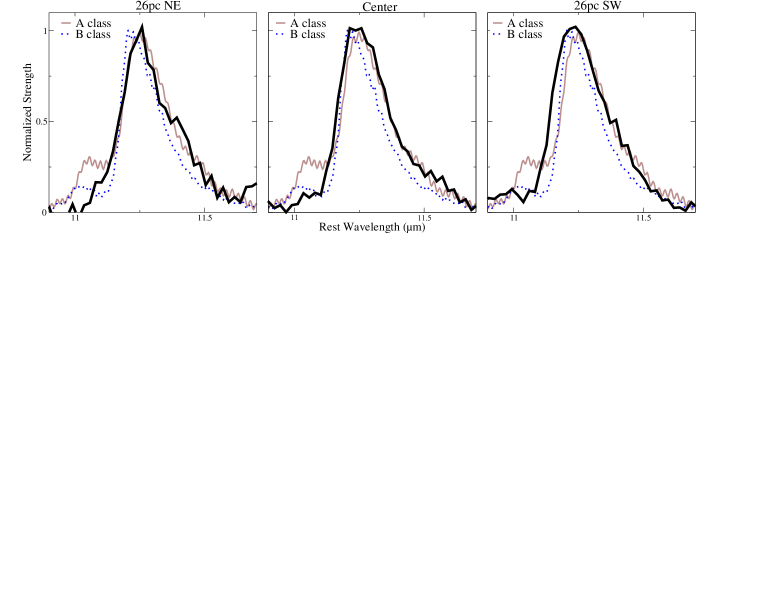
In order to investigate the PAH profiles using high spatial resolution (26 pc) of the Seyfert NGC 1808, we isolate the PAH emission subtracting a general and local continuum under the 8.6 m and 11.3 m bands, using the same procedures of Peeters et al. (2002) and van Diedenhoven et al. (2004). Figures 6 and 7 show the 8.6 m and 11.3 m PAH profiles from our data, compared to representative PAH profiles of the and Peeters et al. (2002) classes333The Peeters et al. (2002) profiles are available at http://www.astro.uwo.ca/ epeeters/research-data.shtml..
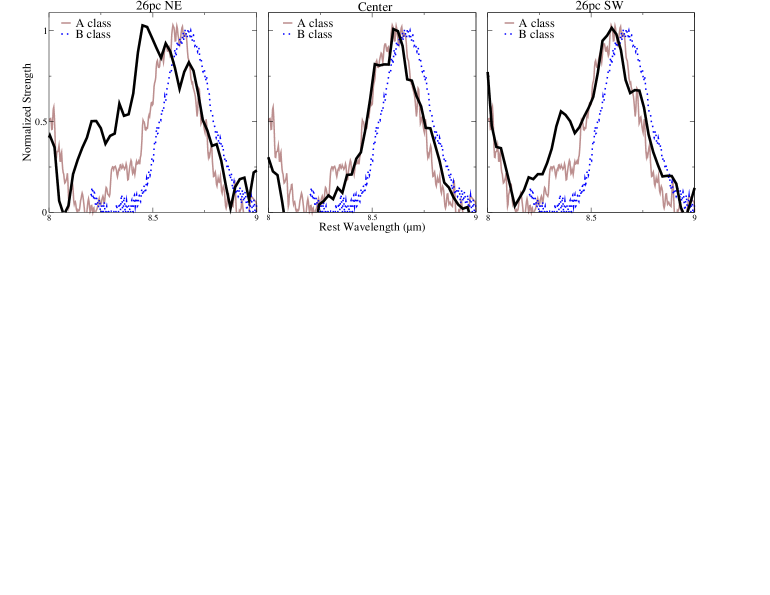
In general, the 8.6m and 11.3m PAH emission line profiles in NGC 1808 resemble Peeters’ class. However, the 26 pc SW and 26 pc NE 8.6m PAH profiles are wider than the representative class example, and also shifted to shorter wavelengths. Comparison with the theoretical models from Bauschlicher et al. (2009) would suggest that the excess emission in the blue wing of the 8.6m line profile is evidence that the off-nuclear regions at 26 pc SW and 26 pc NE contain more ionised PAH material than the nuclear region in this galaxy. The same conclusion can be derived from the equivalent width of the 8.6m assuming that this line is emitted by ionized PAH molecules (see Allamandola et al., 1999).
Fig. 7 shows that the 11.3m PAH profile from the 26 pc SW spectrum is broader towards shorter wavelengths than the representative class. According to Bauschlicher et al. (2008, 2009), the emission creating the shorter wavelengths of the 11.3m profile would be produced mainly by neutral PAH molecules, and we would conclude that the amount of neutral emitting PAH material in the 26 pc SW region is larger than in the NGC 1808 centre. The same conclusion can be derived from the equivalent width of the 11.3m assuming that this line is emitted by neutral PAH molecules (see Allamandola et al., 1999).
In addition, we can see from the values in the Table 2 that the equivalent width (EW) of the PAH at 8.6m, which is due to the ionized PAHs (e.g. Puget & Leger, 1989; Allamandola et al., 1989, 1999; Peeters et al., 2002; Tielens, 2008), is larger at 26 pc SW extraction, while the largest EW of the neutral PAHs (see references above)is at 26 pc NE extraction. In summary, the comparison of the observed PAH profiles and their EWs with the existing observational and theoretical studies indicate that at 26 pc SW of the nucleus in NGC 1808, the ratio of ionised to neutral PAH molecules is larger (1.3) than in the nuclear region (0.96). On the other hand, the EW ratio of ionised to neutral PAH is smallest, EW11.3m/EW8.6m0.7, at 26 pc NE suggesting that this region has more PAHs in the neutral ionization stage. Interestingly, the region hosting more ionised PAH coincides with the X-ray source of Jiménez-Bailón et al. (2005), while the side hosting more neutral molecules coincides with the extended diffuse X-ray emission (see Fig. 2). Overall, the asymmetry in the PAH profiles correlates with regions associated with soft X-ray emission (E keV).
Our data make it quite evident that the 8.6m and 11.3m PAH emission (from ionised and neutral molecules) are present in regions of soft and hard X-ray emission, as well as near to the active nucleus itself (r 30pc). This immediately implies that both ionised and neutral PAH molecules are surviving in the hard X-ray radiation field of the AGN, as predicted if a dusty structure, such as the putative torus in the AGN unified model, is present to partially block the strong radiation field from the central black hole. In this context, it is an interesting issue to investigate if the nuclear spectrum of NGC 1808 present evidence of dusty torus that would explain the presence of PAH molecules near to the active nucleus.
3.3 Is there a Dusty Torus Present in the Central Region of NGC 1808?
The presence of a nuclear dusty toroidal structure, mainly composed by silicate and graphite grains, leaves unmistakable signatures in the observed SEDs of AGN. While the sublimation of the graphite grains creates IR emission at m, the 9.7m feature observed in emission/absorption is attributed to silicate grains (e.g. Barvainis, 1987; Pier & Krolik, 1992; Granato & Danese, 1994; Siebenmorgen et al., 2005; Fritz et al., 2006; Rodríguez-Ardila & Mazzalay, 2006; Riffel et al., 2009). Some authors describe the torus as a continuous density distribution (e.g. Pier & Krolik, 1992; Granato et al., 1997; Siebenmorgen et al., 2004; Fritz et al., 2006), but it has been postulated that, for dust grains to survive in the torus environment, they should be formed in clumpy structures (Krolik & Begelman, 1988) and once provide a natural attenuation of the silicate feature (e.g. Nenkova et al., 2002, 2008a, 2008b; Hönig et al., 2006).
Following Sales et al. (2011), we removed the underlying host galaxy contribution from the NGC 1808 nuclear spectrum by subtracting the average spectrum of the two adjacent extractions (apertures -1 and 1 in Fig. 2). Moreover, we masked the emission lines and the telluric band region (Fig.3) using a simple interpolation, and then compared the resulting pure nuclear spectrum against the Nenkova’s models (e.g. Nenkova et al., 2002, 2008a, 2008b).
These models444The models are available from http://www.pa.uky.edu/clumpy/ assume that the torus is formed by dusty clumps constrained by the following parameters: (i) the number of clouds, , in the torus equatorial radius; (ii) the optical depth of each cloud in the V band, ; (iii) the radial extension of the clumpy distribution, , where and are the outer and inner radius of the torus, respectively; (iv) the radial distribution of clouds as described by a power law ; (v) the torus angular width, constrained by a Gaussian angular distribution described by a half-width ; (vi) the observer’s viewing angle .
The ionic and PAH emission lines, as well as the telluric band (Fig.3) were ignored for the fit. The final spectrum was compared with the clumpy theoretical SEDs, and the best fit is obtained by searching for the minimum in the equation:
| (1) |
where N is the number of data points in the spectrum, F and F are the observed and theoretical fluxes at each wavelength, and are the uncertainties in F, calculated as 10% of (see Radomski et al., 2002; Mason et al., 2006; Sales et al., 2011). Both F and F were normalised to unit at 11.0m, with the uncertainties correctly propagated. Table 3 show the parameters of the best fit, and Fig. 8 shows the resulting theoretical SED superimposed on the NGC 1808 pure nuclear spectrum.
The mean and standard deviation of the model parameters were calculated from the subset of models with a value within 10% of the best-fitting result (144 in total). The locus of the corresponding theoretical SEDs is plotted as a grey region in Figure 8. We used a similar approach to that of Nikutta et al. (2009), who test 5%, 10%, 15% and 20% deviation fractions, and found that our methodology results in a narrower locus of acceptable solutions. The mean values for the model parameters within the adopted deviations are shown in Table 3.
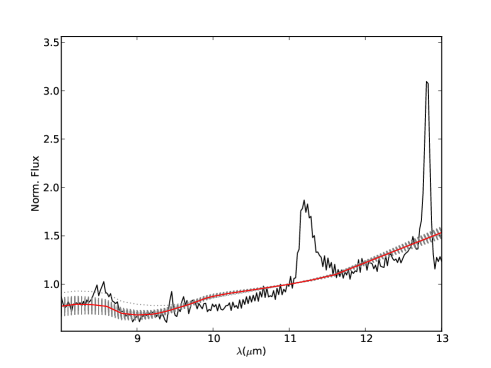
The parameters obtained for the best fit model suggest that NGC 1808 hosts a dusty toroidal structure, where the dusty clouds, with individual optical depth of = 100 mag, occupy a toroidal volume of = 10. The density profile distribution of the clouds follows a power-law r-1.5, and there are 15 clouds in the equatorial radius of this torus. The toroidal structure is constrained in angular width by a Gaussian distribution of width = 70∘.
| Parameter | Best Fit | Average | Average | Average | Average |
| 5% | 10% | 15% | 20% | ||
| Torus angular width () | 70∘ | 65∘ 5∘ | 62∘ 7∘ | 61∘ 8∘ | 61∘ 8∘ |
| Radial extent of the torus () | 10 | 10 0 | 11 7 | 11 8 | 11 10 |
| Number of clouds in the torus equatorial radius () | 15 | 14 1 | 13 1 | 13 2 | 12 2 |
| Power-law index of the radial density profile () | 1.5 | 1.5 0.1 | 1.1 0.3 | 0.7 0.5 | 0.6 0.5 |
| Observers’ viewing angle () | 90∘ | 80∘ 9∘ | 76∘ 11∘ | 74∘ 13∘ | 71∘ 15∘ |
| Optical depth for individual cloud () | 100 mag | 100 0 mag | 99 6 mag | 99 6 mag | 100 7 mag |
| Total number of solution | 25 | 144 | 343 | 525 |
According to our best-fit model, we would be looking along the torus equator ( = 90∘), resulting in a line of sight column density of N and torus outer radius is R0.55 pc. We can also estimate the bolometric luminosity from clumpy torus model as Lbol = 1.9 erg s-1 (see Nenkova et al., 2008b; Sales et al., 2011). This value is a factor of 6 larger than that inferred from X-ray observation (LX-ray = 1.6 erg s-1 Jiménez-Bailón et al., 2005) after apply the correction factor of 20 suggested by Elvis et al. (2004). Ramos Almeida et al. (2009) have also found similar results from their clumpy torus model fitting (L = 6.8 erg s-1) of the NGC1808 photometric data. However, such discrepancy could be attributed to the attenuation from circumnuclear dust (e.g. Krabbe et al., 1994) included in the larger (850 pc) aperture used for the X-ray (850 pc) used by Jiménez-Bailón et al. (2005).
4 Summary and Conclusions
In this paper we analyse N band spectra of the Seyfert 2 NGC 1808, obtained with the Gemini T-ReCS at a spatial resolution 26 pc. The central regions of this galaxy show extended PAH band emission, and conspicuous differences in the PAH line profiles are detected in scales of dozens of parsecs. Our main conclusions are:
-
1.
The spectra of the unresolved nucleus and of regions located 26 pc in both NE and SW directions along the slit show intense 8.6m, 11.3m and 12.7m PAH emission bands. The spectra also show [Ne ii]12.8m and H (2)12.27m emission lines. Both ionic and molecular emission are extended up to 70 pc from the nucleus.
-
2.
The PAH, [Ne ii]12.8m, and 10m continuum emission decrease radially in intensity. The similarity in their luminosity profiles would indicate that their excitation mechanism is the same.
-
3.
The analysis of the PAH emission lines shows that the 8.6m and 11.3m line profiles in the central region are similar to Peeters’s class. However, the profile of the lines originating from the 26 pc SW and 26 pc NE regions are different, implying that in the ratio of ionised to neutral PAH molecules in the 26 pc NE region is higher than in the 26 pc SW one.
-
4.
Strong PAH molecular emission is present in the nuclear extraction, as well as in the off-nuclear regions coincident with hard and soft X-ray emission. This suggests that the PAH molecules in the nucleus of NGC 1808 are able to survive the AGN hard radiation field.
-
5.
The nuclear N band spectrum after subtraction of the underlying galaxy contribution can be represented by a clumpy torus model (Nenkova et al., 2008b). The torus in NGC 1808 would present a toroidal volume of = 10, with each cloud having an optical depth = 100 mag and the distribution of the clouds following a power-law.
-
6.
According to the best-fit torus model, our line of sight would be along the torus equatorial radius (), resulting a hydrogen column density of N. The torus would have an outer radius of R0.55 pc. Our modelling is consistent with NGC 1808 hosting a Sy 2 nucleus.
Acknowledgements
The authors thank for the anonymous referee for many useful suggestions. MP would like to acknowledge the support from CNPq (grant 308985/2009-5). RR acknowledges funding from FAPERGs (ARD 11/1758-5) and CNPq. Based on observations obtained at the Gemini Observatory, which is operated by the Association of Universities for Research in Astronomy, Inc., under a cooperative agreement with the NSF on behalf of the Gemini partnership: the National Science Foundation (United States), the Science and Technology Facilities Council (United Kingdom), the National Research Council (Canada), CONICYT (Chile), the Australian Research Council (Australia), Ministério da Ciência e Tecnologia (Brazil), and Ministerio de Ciencia, Tecnología e Innovación Productiva (Argentina). We thank Charles Bonatto and Isabel Aleman for helpful discussion.
References
- Allamandola et al. (1989) Allamandola, L. J., Tielens, A. G. G. M., & Barker, J. R. 1989, ApJS, 71, 733
- Allamandola et al. (1999) Allamandola, L. J., Hudgins, D. M., & Sandford, S. A. 1999, ApJL, 511, L155
- Antonucci (1993) Antonucci, R. 1993, ARA&A, 31, 473
- Awaki et al. (1996) Awaki, H., Ueno, S., Koyama, K., Tsuru, T., & Iwasawa, K. 1996, PASJ, 48, 409
- Baldwin et al. (1981) Baldwin, J. A., Phillips, M. M., & Terlevich, R. 1981, PASP, 93, 5
- Barvainis (1987) Barvainis, R. 1987, ApJ, 320, 537
- Bauschlicher et al. (2008) Bauschlicher, Jr., C. W., Peeters, E., & Allamandola, L. J. 2008, ApJ, 678, 316
- Bauschlicher et al. (2009) Bauschlicher, C. W., Jr., Peeters, E., & Allamandola, L. J. 2009, ApJ, 697, 311
- Cohen et al. (1999) Cohen, M., Walker, R. G., Carter, B., Hammersley, P., Kidger, M., & Noguchi, K. 1999, AJ, 117, 1864,
- Cohen et al. (1986) Cohen, M., Allamandola, L., Tielens, A. G. G. M., et al. 1986, ApJ, 302, 737
- Elvis et al. (2004) Elvis, M., Risaliti, G., Nicastro, F., Miller, J. M., Fiore, F., & Puccetti, S. 2004, ApJ, 615, L25
- Fritz et al. (2006) Fritz, J., Franceschini, A., & Hatziminaoglou, E. 2006, MNRAS, 366, 767
- Galliano et al. (2005) Galliano, E., Pantin, E., Alloin, D., & Lagage, P. O. 2005, MNRAS, 363, L1
- Gallimore et al. (2010) Gallimore, J. F., Yzaguirre, A., Jakoboski, J., et al. 2010, ApJ, 187, 172
- Geballe et al. (1985) Geballe, T. R., Lacy, J. H., Persson, S. E., McGregor, P. J., & Soifer, B. T. 1985, ApJ, 292, 500
- Genzel et al. (1998) Genzel, R., Lutz, D., Sturm, E., et al. 1998, ApJ, 498, 579
- Gillett et al. (1973) Gillett, F. C., Forrest, W. J., & Merrill, K. M. 1973, ApJ, 183, 87
- Granato & Danese (1994) Granato, G. L., & Danese, L. 1994, MNRAS, 268, 235
- Granato et al. (1997) Granato, G. L., Danese, L., & Franceschini, A. 1997, ApJ, 486, 147
- Hönig et al. (2006) Hönig, S. F., Beckert, T., Ohnaka, K., & Weigelt, G. 2006, A&A, 452, 459
- Hony et al. (2001) Hony, S., Van Kerckhoven, C., Peeters, E., et al. 2001, A&A, 370, 1030
- Jiménez-Bailón et al. (2005) Jiménez-Bailón, E., Santos-Lleó, M., Dahlem, M., et al. 2005, A&A, 442, 861
- Kemper et al. (2004) Kemper, F., Vriend, W. J., & Tielens, A. G. G. M. 2004, ApJ, 609, 826
- Kotilainen et al. (1996) Kotilainen, J. K., Forbes, D. A., Moorwood, A. F. M., van der Werf, P. P., & Ward, M. J. 1996, A&A, 313, 771
- Krabbe et al. (1994) Krabbe, A., Sternberg, A., & Genzel, R. 1994, ApJ, 425, 72
- Krolik & Begelman (1988) Krolik, J. H., & Begelman, M. C. 1988, ApJ, 329, 702
- Lebouteiller et al. (2007) Lebouteiller, V., Brandl, B., Bernard-Salas, J., Devost, D., & Houck, J. R. 2007, ApJ, 665, 390
- Leger & Puget (1984) Leger, A., & Puget, J. L. 1984, A&A, 137, L5
- Mason et al. (2006) Mason, R. E., Geballe, T. R., Packham, C., Levenson, N. A., Elitzur, M., Fisher, R. S., & Perlman, E. 2006, ApJ, 640, 612
- Nenkova et al. (2002) Nenkova, M., Ivezić, Ž., & Elitzur, M. 2002, ApJL, 570, L9
- Nenkova et al. (2008a) Nenkova, M., Sirocky, M. M., Ivezić, Ž., & Elitzur, M. 2008a, ApJ, 685, 147
- Nenkova et al. (2008b) Nenkova, M., Sirocky, M. M., Nikutta, R., Ivezić, Ž., & Elitzur, M. 2008b, ApJ, 685, 160
- Nikutta et al. (2009) Nikutta, R., Elitzur, M., & Lacy, M. 2009, ApJ, 707, 1550
- Pastoriza (1967) Pastoriza, M. G. 1967, The Observatory, 87, 225
- Peeters et al. (2002) Peeters, E., Hony, S., Van Kerckhoven, C., et al. 2002, A&A, 390, 1089
- Peeters et al. (2004) Peeters, E., Spoon, H. W. W., & Tielens, A. G. G. M. 2004, ApJ, 613, 986
- Pier & Krolik (1992) Pier, E. A., & Krolik, J. H. 1992, ApJ, 401, 99
- Puget & Leger (1989) Puget, J. L., & Leger, A. 1989, ARA&A, 27, 161
- Radomski et al. (2002) Radomski, J. T., Piña, R. K., Packham, C., Telesco, C. M., & Tadhunter, C. N. 2002, ApJ, 566, 675
- Ramos Almeida et al. (2009) Ramos Almeida, C., Levenson, N. A., Rodríguez Espinosa, J. M., et al. 2009, ApJ, 702, 1127
- Ramos Almeida et al. (2011) Ramos Almeida, C., Levenson, N. A., Alonso-Herrero, A., et al. 2011, ApJ, 731, 92
- Riffel et al. (2009) Riffel, R., Pastoriza, M. G., Rodríguez-Ardila, A., & Bonatto, C. 2009, MNRAS, 400, 273
- Rodríguez-Ardila & Mazzalay (2006) Rodríguez-Ardila, A., & Mazzalay, X. 2006, MNRAS, 367, L57
- Sales et al. (2010) Sales, Dinalva A., Pastoriza, M. G., & Riffel, R. 2010, ApJ, 725, 605
- Sales et al. (2011) Sales, D. A., Pastoriza, M. G., Riffel, R., et al. 2011, ApJ, 738, 109
- Saikia et al. (1990) Saikia, D. J., Unger, S. W., Pedlar, A., et al. 1990, MNRAS, 245, 397
- Sérsic & Pastoriza (1967) Sérsic, J. L., & Pastoriza, M. 1967, PASP, 79, 152
- Sérsic & Pastoriza (1965) Sérsic, J. L., & Pastoriza, M. 1965, PASP, 77, 287
- Siebenmorgen et al. (2004) Siebenmorgen, R., Krügel, E., & Spoon, H. W. W. 2004, A&A, 414, 123
- Siebenmorgen et al. (2005) Siebenmorgen, R., Haas, M., Krügel, E., & Schulz, B. 2005, aap, 436, L5
- Smith et al. (2007) Smith, J. D. T., Draine B. T., Dale D. A., et al. 2007, ApJ, 656, 770
- Sturm et al. (2000) Sturm, E., Lutz, D., Tran, D., Feuchtgruber, H., Genzel, R., Kunze, D., Moorwood, A. F. M., & Thornley, M. D. 2000, A&A, 358, 481
- Telesco et al. (1998) Telesco, C. M., Piña, Robert K., Hanna, Kevin T., Julian, Jeffrey A., Hon, David B., & Kisko, Thomas M. 1998, Proc. SPIE, 3354, 534
- Tielens (2008) Tielens, A. G. G. M. 2008, ARA&A, 46, 289
- Urry & Padovani (1995) Urry, C. M., & Padovani, P. 1995, PASP, 107, 803
- van Diedenhoven et al. (2004) van Diedenhoven, B., Peeters, E., Van Kerckhoven, C., et al. 2004, ApJ, 611, 928
- Veron-Cetty & Veron (1985) Veron-Cetty, M.-P., & Veron, P. 1985, A&A, 145, 425
- Voit (1992a) Voit, G. M. 1992, ApJ, 399, 495a
- Voit (1992b) Voit, G. M. 1992, MNRAS, 258, 841b
- Weedman et al. (2005) Weedman, D. W., Hao, Lei, Higdon, S. J. U., et al. 2005, ApJ, 633, 706
- Wu et al. (2009) Wu, Y., Charmandaris, V., Huang, J., Spinoglio, L., & Tommasin, S. 2009, ApJ, 701, 658