Intragroup and Galaxy-Linked Diffuse X-ray Emission in Hickson Compact Groups
Abstract
Isolated compact groups of galaxies (CGs) present a range of dynamical states, group velocity dispersions, and galaxy morphologies with which to study galaxy evolution, particularly the properties of gas both within the galaxies and in the intragroup medium. As part of a large, multiwavelength examination of CGs, we present an archival study of diffuse X-ray emission in a subset of nine Hickson compact groups observed with the Chandra X-ray Observatory. We find that seven of the groups in our sample exhibit detectable diffuse emission. However, unlike large-scale emission in galaxy clusters, the diffuse features in the majority of the detected groups are linked to the individual galaxies, in the form of both plumes and halos likely as a result of star formation or AGN activity, as well as in emission from tidal features. Unlike previous studies from earlier X-ray missions, HCGs 31, 42, 59, and 92 are found to be consistent with the relationship from clusters within the errors, while HCGs 16 and 31 are consistent with the cluster relation, though this is likely coincidental given that the hot gas in these two systems is largely due to star formation. We find that increases with decreasing group H i to dynamical-mass ratio with tentative evidence for a dependance in X-ray luminosity on H i morphology whereby systems with intragroup H i indicative of strong interactions are considerably more X-ray luminous than passively evolving groups. We also find a gap in the of groups as a function of the total group specific star formation rate. Our findings suggest that the hot gas in these groups is not in hydrostatic equilibrium and these systems are not low-mass analogs of rich groups or clusters, with the possible exception of HCG 62.
1 Introduction
As the majority of galaxies in the nearby Universe are found within gravitationally bound groups (e.g., Tully 1987; Small et al. 1999; Karachentsev 2005), understanding the physical processes at work in these systems is fundamental to galaxy formation, evolution, and cosmological theory. Though a significant fraction may be condensed structures embedded within largely extended, loosely bound systems (Tovmassian et al., 2006; Mendel et al., 2011), Hickson compact groups (HCGs; Hickson 1982) in particular are useful tools for studying tidally enhanced galaxy evolution in the nearby Universe because they are isolated from other nearby galaxies due to their selection criteria, have low velocity dispersions (usually km s-1), and exhibit high number densities (typically 3–4 galaxies of comparable luminosity within several galaxy radii of one another). These properties combined encourage numerous gravitational interactions between group members.
Because the crossing time of CGs is short (; Diaferio et al. 1994), simulations indicate that group members should have entirely merged into single massive galaxies on timescales of 1 Gyr. Hypotheses concerning the continued existence of CGs have included that these systems are either recently formed (e.g., Mendes de Oliveira et al. 2005), that they are chance alignments within larger structures (e.g., Mamon 1986), or that CGs are perpetually formed within collapsing rich groups (e.g., Diaferio et al. 1994). However, all three proposed scenarios have evidence that contradicts them such as the wide range in ages of star clusters in CGs (Konstantopoulos et al., 2010, 2012), the low surface brightness tidal debris and disturbed disk morphologies present in many groups (e.g., HCGs 16, 31, and 92; Mendes de Oliveira et al. 1998; Gallagher et al. 2010; Fedotov et al. 2011), and indications that a small fraction of CG members are the result of mergers (Mendes de Oliveira et al., 2005). Clearly these systems are much more complicated than first suspected, and understanding the origin and physical processes responsible for maintaining CGs over timescales in excess of several Gyr is important for refining cosmological simulations.
Verdes-Montenegro et al. (2001) presented an evolutionary scenario in which the spiral-rich compact groups with most of their neutral H i gas confined to the galaxy disks experience successive tidal encounters which liberate the cool gas from the galaxies into the intragroup medium in the form of tails and bridges. This progresses to one of two evolutionary end points: (1) a group in which the liberated H i is shock-heated to X-ray temperatures; or (2) a group with a large, low velocity dispersion H i halo. In a study of five groups, Freeland et al. (2009) found that the amount of H i tidally removed from galaxy disks is related to the compactness of the group. Therefore, compact groups should be very efficient at dispersing their neutral gas into the intragroup medium. If a sufficient mass of gas is removed from the disks and heated to sufficiently temperatures, the group may be considered a fossil group. Jones et al. (2003) defined fossil groups as those with erg s-1 and a difference in -band magnitude of mag between the two brightest group members. The possible evolution of HCGs into fossil groups represents the most similar to clusters these systems may become. We note that tidal stripping of gas from galaxy disks is not necessarily the only source of baryons for the intragroup medium. Simulations of galaxy clusters at high redshift have shown that cold mode accretion of gas from the surrounding intergalactic medium can be a substantial source of baryons (e.g., Kereš et al. 2005); however, it is unclear how significant this accretion may be for low redshift groups.
Observations of diffuse X-ray emission are particularly helpful in placing constraints on the properties of CGs because the increased likelihood of tidal encounters implies that a significant fraction of the gas mass in these systems may be in the form of a hot plasma. Previous ROSAT (e.g., Ponman et al. 1996; Mulchaey & Zabludoff 1998; Helsdon et al. 2001; Mulchaey et al. 2003) and Chandra (e.g., Rasmussen et al. 2008; Rasmussen & Ponman 2009; Sun et al. 2009) analyses of diffuse X-ray emission in galaxy groups have specifically treated groups of galaxies as low-mass analogs of galaxy clusters. Early studies found that, within large errors, galaxy groups were consistent with the established relationships between bolometric X-ray luminosity and gas temperature () as well as and velocity dispersion () found from observations of large samples of galaxy clusters. With improved instrumentation and more statistically robust datasets, it was shown that compact groups deviate from the established cluster relation (groups are fainter for a given temperature), however the relation was still found to be consistent, though with a large scatter (cf. Figure 12 in Ponman et al. 1996).
Having performed the first extensive X-ray survey of compact groups using data from both the ROSAT All-Sky Survey (RASS) and pointed ROSAT PSPC observations, Ponman et al. (1996) found that 22 out of 85 observed HCGs had diffuse X-ray emission above their detection limits. From the data, the authors statistically estimated that 75% of HCGs have a diffuse X-ray luminosity above erg s-1. While diffuse X-ray emission was previously thought to be limited to groups containing only E/S0 members, Ponman et al. (1996) found that groups containing spiral galaxies exhibit diffuse X-ray emission as well, however the X-ray luminosity functions of spiral dominated groups show that they tend to be fainter than E/S0 dominated groups to a high statistical significance. Additionally, a weak anti-correlation was found between and spiral galaxy fraction.
Studies of compact groups such as HCG 31, which shows multiple interactions among its low-mass members, have shown evidence for hierarchical structure formation characteristic of environments at higher redshifts (1–2) (Gallagher et al., 2010). Additionally, a gap in both the mid-IR colors and specific star formation rates (SSFRs; i.e., SFR normalized by stellar mass) of HCGs compared to galaxies in other environments suggests that the galaxies in these systems undergo accelerated evolution from star-forming “blue-cloud” galaxies to the quiescent “red sequence” (Johnson et al., 2007; Walker et al., 2010, 2012; Tzanavaris et al., 2010). This rapid evolution is supported by the H i deficiency observed in most HCG members relative to spiral galaxies in the field (Huchtmeier, 1997; Verdes-Montenegro et al., 2001).
The rapid evolution of HCG galaxies from gas-rich and star-forming to gas-poor and quiescent raises the following question: how is the neutral gas being processed in HCGs, i.e., is most of the H i mass converted into stellar mass or is it ionized and expelled into the intragroup medium, and in what proportions do these mechanisms operate in individual groups? Previous papers have examined the star cluster populations in several HCGs (e.g., Gallagher et al. 2001; Konstantopoulos et al. 2010; Fedotov et al. 2011) to study the consumption of gas by star formation, however there has been no investigation of how the H i gas is heated to X-ray temperatures in these systems in the context of group evolution. In this work, as part of a multiwavelength campaign to study the evolution of both the galaxies in compact groups and the group environment itself, we present the results of a study of the diffuse X-ray emission from nearby CGs () using Chandra observations. Specifically, we inspect the morphology of the hot gas in compact groups using improved spatial resolution compared to previous studies that analyzed ROSAT data; we re-examine the LX scaling relations with temperature and velocity dispersion; and we compare the hot gas in groups to the neutral H i gas to investigate how the X-ray gas is built up in these systems.
First, we describe the Chandra observations and methods for reducing the events files in §2. In §3, we discuss the extraction of the X-ray spectra, as well as the models we used to fit the data. Our model-derived measurements are presented in §4 in addition to a discussion of the results of our study in the larger context of galaxy evolution and the evolution of the group environment itself. We summarize our findings and discuss the future steps of our investigation into the diffuse X-ray properties of HCGs in §5. Appendix A gives specific information on the extraction and modeling of the diffuse emission in the detected groups. Throughout this work, we assume a cosmology of km s-1 Mpc-1, , and . We also caution the reader that we allude several times to compact groups possibly becoming more cluster-like as they evolve. In this context, we refer to the hot gas distribution, not necessarily to the richness of the group; therefore, the term cluster-like is used to describe groups with a large fraction of E/S0 galaxies and a shared, hot intragroup medium.
2 Sample Definition, Observations, and Data Reduction
Objects for study were selected on the basis of data available from the archive at the Chandra X-ray Center (CXC) for CGs that are part of a sample designed to study star formation and galaxy evolution in the compact group environment (see Johnson et al. 2007 for more information regarding the original sample; HCG 92 was subsequently added based on the availability of high-resolution, deep imaging data). To this end, the sample consists of groups at small enough distances (, excepting HCG 92) to allow for high spatial resolution imaging over a wide range of wavelengths. In addition to our new Chandra observations of HCGs 7, 22, 31, and 59 (PIs: Garmire [7, 22] and Gallagher [31, 59]), we selected archival data that covered the entirety of each group, rather than only individual group members, to search for hot, ionized gas in the intragroup medium, bringing the total number in our study of diffuse X-ray emission to nine groups. HCGs 2, 19, 48, and 61, which were included in the Johnson et al. (2007) sample, were omitted from our study due to the lack of suitable Chandra imaging data.
All of the groups were observed at the ACIS-S aimpoint with the exception of HCG 90, which was observed at the ACIS-I aimpoint due to its large angular extent (the diffuse emission of HCG 90 falls mostly on the I0 CCD, however some is present along the edges of the other I array detectors as well). The individual ACIS CCDs have a field of view of , which is comparable to the extent of the diffuse emission in compact groups found in Ponman et al. (1996) and Mulchaey et al. (2003) (noting the exceptions of HCGs 62 and 90). All data were taken in VFAINT mode except HCG 16, HCG 62 (obsID 921), and HCG 92 (obsID 789), which were in FAINT mode. Due to the design of the High Resolution Mirror Assembly, observations with the Chandra ACIS camera have superior spatial resolution (0.5″ FWHM) compared to other instruments such as the ROSAT PSPC (25″) and XMM EPIC (6″), allowing for more robust removal of point sources that contaminate the diffuse emission and can ead to incorrect estimations of hot gas properties. Tables 3 and 1 list the properties and observation information, respectively, of the CGs included our sample.
The data were reprocessed beginning with the level 1 events file. We used the CIAO tool acis_reprocess_events with standard event filtering and VFAINT background cleaning (when appropriate) to produce the level 2 events file; however, we omitted the pixel randomization step in the event file processing to prevent degradation of the spatial resolution. The pixel randomization introduces a 05 random resampling of the event positions on the detector. This procedure is normally performed to mitigate the effects of aliasing in observations ks, however the observations included in our sample are substantially longer than this limit, and therefore the pixel randomization is not required. The pixel randomization has been shown to decrease the spatial resolution of the observations by 12% (e.g., Chartas et al. 2002). High spatial resolution is useful for proper removal of point sources that may be embedded within or projected onto any diffuse emission present in the groups.
| HCG | Chandra | Date | Extraction AreaaaTotal area over which the events were extracted | Total CountsbbSource + Background in science observation | Exp. | Bkg Counts | Bkg Exp.ccExposure time of the ACIS stowed background files |
|---|---|---|---|---|---|---|---|
| obsID | (sq. arcmin) | (0.7–3.0 keV) | (ks) | (0.7–3.0 keV) | (ks) | ||
| 7 (catalog HCG 7)ddCount information listed for merged spectra | 8171 (catalog ADS/Sa.CXO#obs/08171)ddCount information listed for merged spectra | 2007-09-13 | 48.2 | 2419 | 19.2 | 57670 | 900 |
| 9588 (catalog ADS/Sa.CXO#obs/09588)ddCount information listed for merged spectra | 2007-09-16 | 16.7 | |||||
| 16 (catalog HCG 16) | 923 (catalog ADS/Sa.CXO#obs/00923) | 2000-11-16 | 26.9 | 1270 | 12.6 | 6209 | 110 |
| 22 (catalog HCG 22)eeCounts evaluated over 0.7–1.7 keV (see §3.2) | 8172 (catalog ADS/Sa.CXO#obs/08172) | 2006-11-23 | 44.7 | 2078 | 31.8 | 27973 | 450 |
| 31 (catalog HCG 31)eeCounts evaluated over 0.7–1.7 keV (see §3.2) | 9405 (catalog ADS/Sa.CXO#obs/09405) | 2007-11-15 | 8.70 | 636 | 35.6 | 5433 | 450 |
| 42 (catalog HCG 42) | 3215 (catalog ADS/Sa.CXO#obs/03215) | 2002-03-26 | 36.5 | 7600 | 31.7 | 15882 | 450 |
| 59 (catalog HCG 59)eeCounts evaluated over 0.7–1.7 keV (see §3.2) | 9406 (catalog ADS/Sa.CXO#obs/09406) | 2008-04-12 | 24.7 | 1457 | 38.4 | 15373 | 450 |
| 62 (catalog HCG 62) | 921 (catalog ADS/Sa.CXO#obs/00921) | 2000-01-25 | 7.54 | 31053 | 48.5 | 2604 | 145 |
| 10462 (catalog ADS/Sa.CXO#obs/10462)ddCount information listed for merged spectra | 2009-03-02 | 7.54 | 55302 | 67.1 | 247702 | 900 | |
| 10874 (catalog ADS/Sa.CXO#obs/10874)ddCount information listed for merged spectra | 2009-03-02 | 51.4 | |||||
| 90 (catalog HCG 90) | 905 (catalog ADS/Sa.CXO#obs/00905) | 2000-07-02 | 68.3 | 24821 | 49.5 | 166640 | 450 |
| 92 (catalog HCG 92) | 789 (catalog ADS/Sa.CXO#obs/00789) | 2000-07-09 | 19.3 | 2545 | 19.7 | 4663 | 110 |
| 7924 (catalog ADS/Sa.CXO#obs/07924) | 2007-08-17 | 19.3 | 10656 | 93.2 | 27337 | 450 |
Because the diffuse intragroup emission is typically weak and there is no robust method to determine the full radial extent of it from the data, for most targets we did not perform a spectral extraction in an annulus surrounding the targets to determine the soft X-ray background level. Instead, we subtracted the instrumental background using the stowed ACIS background files appropriate to each observation (as in White et al. 2003). The stowed ACIS background files111This brief description of the stowed ACIS background is based on the work of Maxim Markevitch; further details are at http://cxc.harvard.edu/contrib/maxim/stowed/. were obtained by sliding ACIS out of view of the sky and away from the external calibration source to avoid spectral-line contamination. All stowed background observations were taken after 2002 in VFAINT mode with gain corrections applied. Following procedures outlined in the ACIS Extract manual (Broos et al., 2010), we removed the “Clean55” bit from the event lists for subtraction from data taken in FAINT mode and renormalized the background files to the data using the particle background in the range 9–12 keV. The stowed background files include emission from the high energy particle background ( keV), but not the soft X-ray background (SXRB; keV), therefore in groups where we used the stowed background files we expect contamination from the SXRB at energies 2 keV. Table 1 lists total counts extracted from and exposure times of the stowed background data for each group.
We used the latest version of ACIS Extract to create exposure maps, model point source PSFs and excise them from the observations, and extract spectral information (see §3). The energy used to create the exposure maps was the median event energy over the range 0.5–3.0 keV, chosen to coincide with the peak of any soft diffuse emission in the data.
3 Spectral Extraction and Modeling
3.1 Point Source Detection and Removal
We used the CIAO Mexican-hat wavelet detection routine wavdetect (Freeman et al., 2002) to search for point sources in the field of view down to a source-significance threshold of . Detections were examined by eye to remove spurious sources (e.g., those with an axis length pixel). We then used ACIS Extract to model the PSF of the sources with MARX prior to excising the point sources from the events files. The excised regions correspond to 1.1 times the 99% encircled energy radius. For extraction of spectra, we did not interpolate over the holes created by excising the point sources to avoid making statistical assumptions concerning the gas. The area of diffuse emission on the sky lost due to point-source removal was typically less than 1% of the total extraction region. We defer the examination of the point sources in our sample to Tzanavaris et al. (in prep).
3.2 Extraction of the Diffuse Emission
Extraction regions were centered on the apparent centers of the CG galaxy distributions with shapes and sizes chosen to best cover all of the main group members on the S3 chip (I0 for HCG 90), including evident diffuse emission in the level 2 events files. The extraction regions were either circular or elliptical in shape, except in the case of HCG 16, which fills approximately half of the S3 CCD. In this group, the region was rectangular and placed at an angle to include the main galaxies and the known distribution of H i gas. The area of each extraction region can be found in Table 1, while additional information is located in Appendix A. Note that in the case of HCG 22, the extraction region includes a background pair of galaxies to the southeast of the group center. As this group was classified as a non-detection, we set an upper limit on the diffuse X-ray luminosity using the method outlined below. Therefore, the inclusion of this pair in the extraction region has negligible impact on the results.
Prior to model fitting in XSPEC (Arnaud, 1996), the extracted spectra were rebinned such that each pulse height amplitude (PHA) bin contained a minimum of 20 counts. This ensured statistically valid results when fitting with statistics. In cases where the ACIS instrumental response did not change significantly between observations (i.e., multiple obsIDs within an observing cycle), we merged the on-source spectra to reduce the relative error in each PHA bin. When merging the spectra was not possible due to the changes in the instrument response, we simultaneously fit the model to each spectrum with the temperature and metal abundances linked between different obsIDs; however, the model normalization was allowed to vary freely.
A detection was defined to have . The noise of the spectra was determined to be , where is the total counts in the source before background subtraction, is the number of counts in the background, is the area of the extraction region, is the integration time, and the subscripts and represent the science and background observations, respectively. When using the stowed background, the background counts were scaled to the 9–12 keV count rates in the science observations prior to estimating the noise. This scaling has the effect of normalizing the shape of the stowed background spectrum to that of the source in a range of energies dominated by the particle background Hickox & Markevitch (2006). When no diffuse emission was detected, we put an upper limit on the luminosity of the intragroup medium by fixing the temperature and metal abundance of the plasma to reasonable values of 0.6 keV and 0.5 Z⊙, respectively. We then adjusted the normalization to match the sum of the observed count rate and the 1 noise estimate.
In all cases when diffuse X-ray emission was not detected, the energy range over which the count rates were evaluated had to be restricted to 0.7–1.7 keV due to oversubtraction of the stowed background between 1.7 and 2 keV. Bolometric X-ray luminosities were then computed in the same manner as for groups with detected emission (see below).
3.3 Spectral Model Fitting
We fit a combination of optically thin plasma and Galactic photoelectric absorption models for each of the groups. The best fitting models are presented in Table 2. The first model component, an optically thin plasma, was modeled using the MEKAL model (Mewe et al., 1985, 1986; Kaastra, 1992, 1993; Liedahl et al., 1995; Kaastra & Liedahl, 1995) with the adopted ionization balance taken from Arnaud & Rothenflug (1985) and Arnaud & Raymond (1992). We fixed the hydrogen number density at a reasonable value of 1 cm-3 and allowed the remaining parameters to vary freely. While the metallicity parameter was allowed to vary, these values are poorly constrained by the available data, and we only report them here to describe the best-fitting models to the observations. We calculated the model at all temperatures rather than interpolating it from a pre-calculated table while fitting the data. Other than the plasma temperature, we also report the normalization used in calculating the X-ray luminosity. We note that because the gas is often associated with individual galaxies rather than a single distribution permeating the intragroup medium (see §4.1), it is likely multi-temperature; however, we find that the single temperature plasma model fits the extracted spectra well, except in the case of HCG 62 for which a two-temperature plasma results in a better fit. Note that HCG 62 has the most counts in the background-subtracted data compared to any other observation in this study; specifically, a factor of 7 more counts in the merged obsIDs 10462 and 10874 compared to HCG 90, which has the next most counts. For other targets, our ability to isolate the multiple spectral components that likely make up the diffuse X-ray emission is limited by the number of counts; therefore, it is probable that we cannot detect spectral complexity in our data (e.g., multi-temperature plasmas) given the limited numbers of counts.
| HCGaaFor groups with spectra that were fitted simultaneously rather than merged, we list the corresponding obsIDs in parentheses | H i | kT | log | D.O.F. | ||
|---|---|---|---|---|---|---|
| ( cm-2) | (keV) | (10-4 cm-5) | (erg s-1) | |||
| 7bbNo detection, model temperature and abundance fixed at 0.6 keV and 0.5 Z⊙, respectively | 1.97 | 0.6 | 0.5 | |||
| 16 | 2.56 | 0.16 | 40.43/47 | |||
| 22bbNo detection, model temperature and abundance fixed at 0.6 keV and 0.5 Z⊙, respectively | 4.26 | 0.6 | 0.5 | |||
| 31 | 5.70 | 0.05 | 31.43/40 | |||
| 42 | 4.11 | 0.55 | 196.48/114 | |||
| 59 | 2.64 | 17.53 | 55.84/61 | |||
| 62 (921) cool | 3.32 | 16.68 | 319.10/281 | |||
| 62 (921) hot | 3.32 | 0.48 | 319.10/281 | |||
| 62 (921) total | ||||||
| 62 (10462+10874) cool | 3.32 | 16.68 | 319.10/281 | |||
| 62 (10462+10874) hot | 3.32 | 0.48 | 319.10/281 | |||
| 62 (10462+10874) total | ||||||
| 62 average total | ||||||
| 90 BCD | 2.02 | 0.54 | 121.75/119 | |||
| 92 (789) | 6.16 | 0.14 | 357.33/220 | |||
| 92 (7924) | 6.16 | 0.14 | 357.33/220 | |||
| 92 average | 41.760.07 |
Photoelectric absorption was modeled using the Tuebingen-Boulder ISM absorption model from Wilms et al. (2000). The only model parameter, the H i column density along the line of sight, was fixed at the value determined using the HEASoft tool nH to compute the weighted mean of H i in a cone centered on the source and with a radius of 1°. Following the recommendation of the nH manual222http://heasarc.nasa.gov/Tools/w3nh_help.html#comparison, we use the H i values from Kalberla et al. (2005).
Abundances and depletion values for the model (used in both the absorption and emission components) were taken from Lodders (2003) (the most recent abundances available in XSPEC) rather than the default from Anders & Grevesse (1989). Both abundance tables use Solar photospheric line and CI chondrite analyses to determine the relative amounts of each element. We found that the values from Lodders (2003) consistently performed better at fitting emission-line features in the spectra, particularly in observations with significant numbers of counts (e.g., HCG 62).
Because Chandra only has significant response over the energy range 0.3–8 keV, we computed the bolometric X-ray luminosity using a dummy response over the energy range 0.01–100 keV logarithmically divided into 5,000 energy bins. We used 3K CMB adjusted velocities (Fixsen et al., 1996) from the NASA Extragalactic Database (NED), which adjusts the velocities for the observed dipole anisotropy in the CMB, to determine the distances to the sources for luminosity calculations. Parameters of interest, specifically the temperature and luminosity of the plasma (and by necessity, the model normalization), are reported with 90% confidence error bars. For simultaneously fit spectra, we report the average luminosity (weighted by the number of counts) determined from the model fits. Note that in the case of HCG 59, the peak in energy of the X-ray emission is very poorly constrained; therefore we fix the temperature to the best-fitting value prior to determining the error in the model normalization. Furthermore, we do not consider the best-fitting value to be representative of the real temperature and simply report it as keV, however we do use the temperature result of the model fit for qualitative purposes in the figures below. We present the temperatures and luminosities derived from the fitted models, as well as goodness of fit estimations, in Table 2.
| HCG | Redshift | aaVelocity measured relative to the 3K CMB | Dispersion | Velocity | Number of Galaxies | SSFRccTotal UV+24 m specific star formation rates by Tzanavaris et al. (2010) with corrections from Tzanavaris (2012, private communication) | log10(Mdyn) | log10(M | log10(M/ | Evo | ||
|---|---|---|---|---|---|---|---|---|---|---|---|---|
| (km s-1) | (km s-1) | References | Main | DynbbNumber of galaxies used in velocity dispersion calculation | E/S0 | (10-11 yr-1) | (M⊙) | (M⊙) | log10(Mdyn)ddDynamical masses estimated from the velocity dispersions listed in column 3 using the median two galaxy separation for the group radius (Hickson et al., 1992) corrected to our cosmology; The most recent H i masses were taken from Verdes-Montenegro et al. (2001) and Borthakur et al. (2010) | TypeeeDefined by Johnson et al. (2007) using the ratio of the group H i mass to its dynamical mass, with subtypes A and B qualitatively assessing the location of the H i gas (localized to the group members or spread throughout the group, respectively) (Konstantopoulos et al., 2010) | ||
| 7 | 0.0141 | 3885 | 129 | 1–4 | 4 | 5 | 1 | 8.790.75 | 12.10 | 9.76 | 0.81 | II A |
| 16 | 0.0132 | 3706 | 84 | 4–7 | 5 | 7 | 0 | 56.197.13 | 11.73 | II B | ||
| 22 | 0.0090 | 2522 | 37 | 8–11 | 3 | 4 | 1 | 6.240.95 | 10.78 | 9.13 | 0.85 | II A |
| 31 | 0.0135 | 4026 | 56 | 1, 12–14 | 4 | 8 | 0 | 89.6315.46 | 10.64 | 10.27 | 0.97 | I B |
| 42 | 0.0133 | 4332 | 27312 | 15, 16 | 4 | 38 | 4 | 0.740.11 | 12.75 | 9.40 | 0.74 | III B |
| 59ffNo H i imaging data available to estimate subtypes in the evolutionary classification | 0.0135 | 4392 | 20812 | 17–20 | 4 | 8 | 1 | 51.8211.04 | 12.19 | 9.49 | 0.78 | III |
| 62ffNo H i imaging data available to estimate subtypes in the evolutionary classification | 0.0137 | 4443 | 3987 | 7, 11, 15, | 4 | 62 | 4 | 0.920.19 | 12.86 | III | ||
| 16, 21–23 | ||||||||||||
| 90 | 0.0088 | 2364 | 177 | 8, 15 | 4 | 16 | 2 | 12.19 | 8.70 | 0.71 | III A | |
| 92 | 0.0215 | 6119 | 3436 | 1, 12, 20 | 4 | 4 | 2 | 12.75 | 10.23 | 0.80 | II B | |
| HCG | aaConverted from the bolometric luminosity and adjusted for differences in cosmology | aaConverted from the bolometric luminosity and adjusted for differences in cosmology | ||||
|---|---|---|---|---|---|---|
| (keV) | (keV) | (keV) | (10-12 erg s-1 cm-2) | (10-12 erg s-1 cm-2) | (10-12 erg s-1 cm-2) | |
| 16 | ||||||
| 42 | ||||||
| 62bbThe values listed for this study are the flux-weighted average temperature and total flux of the two plasma components in HCG 62 | ||||||
| 90 | ||||||
| 92 |
4 Results and Discussion
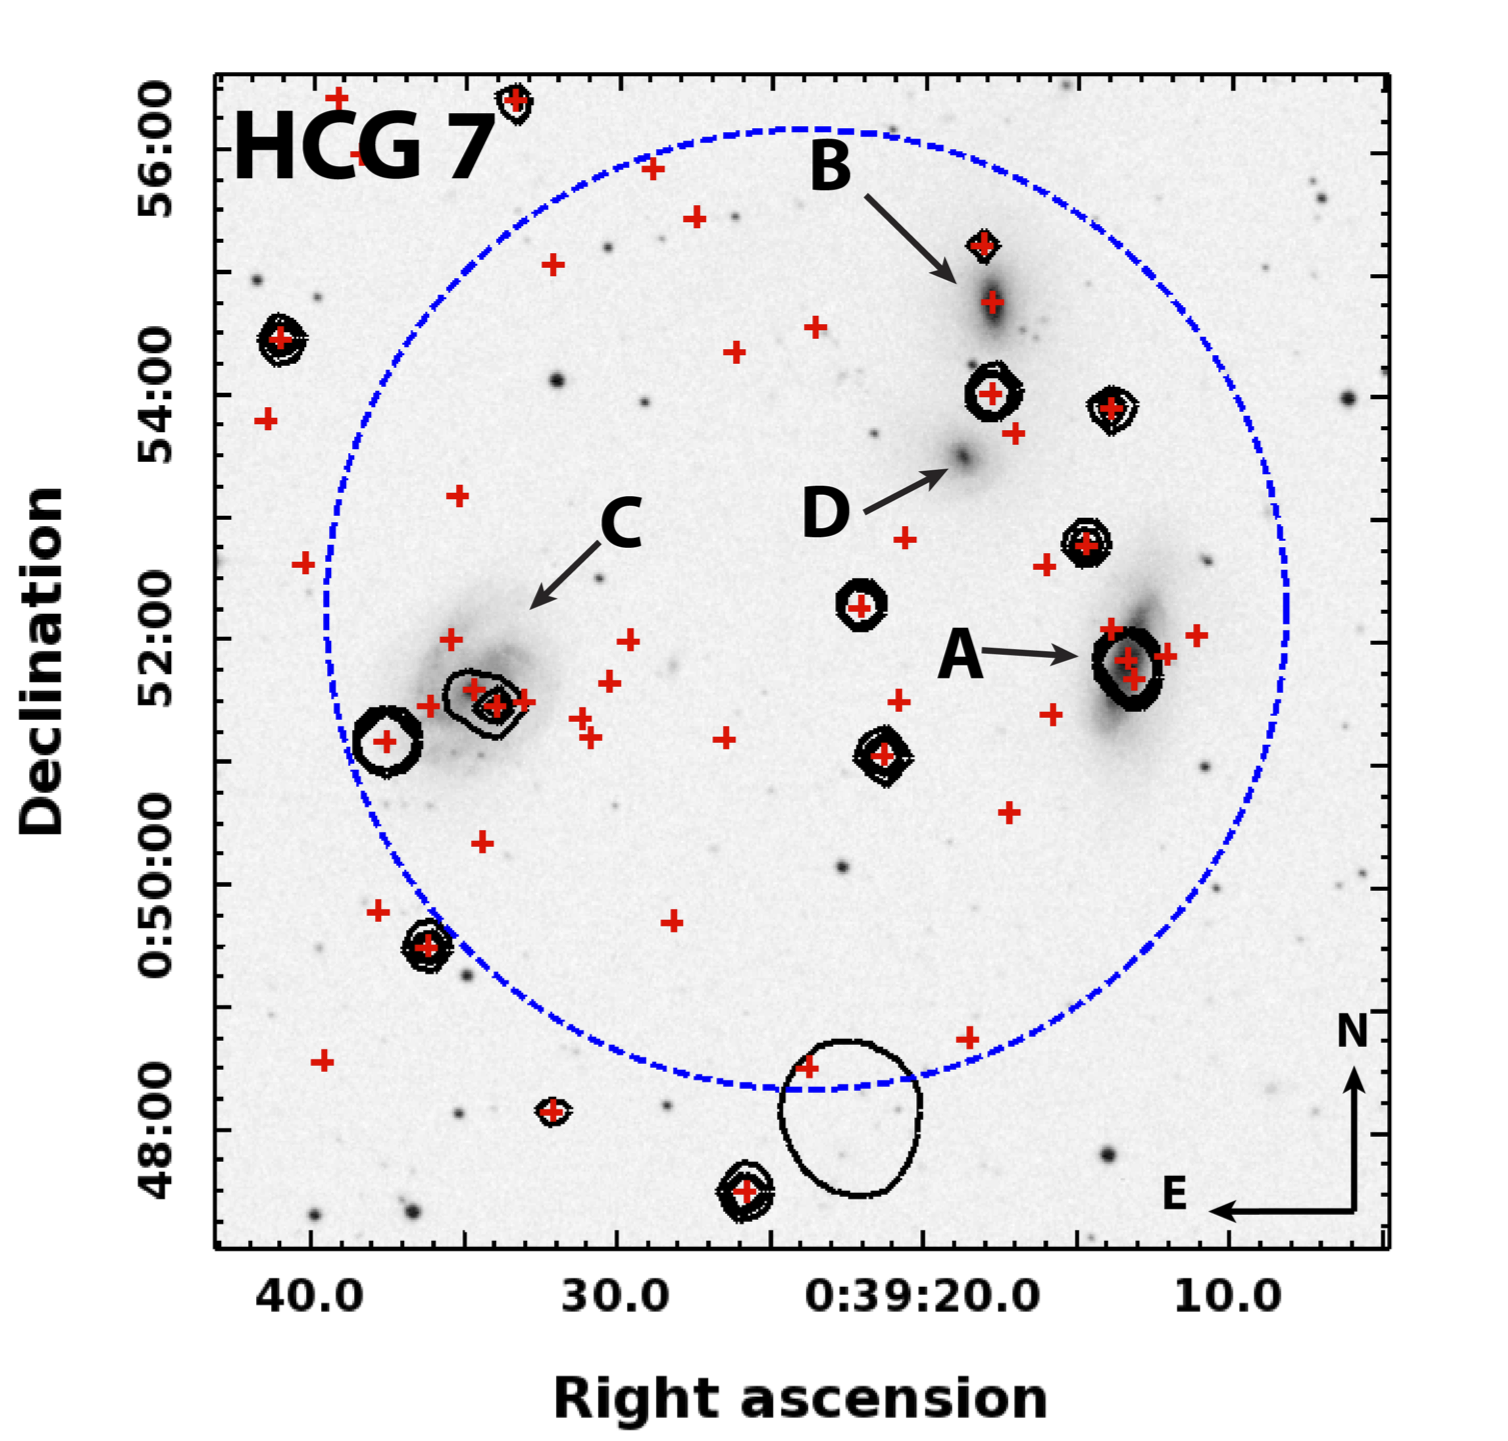
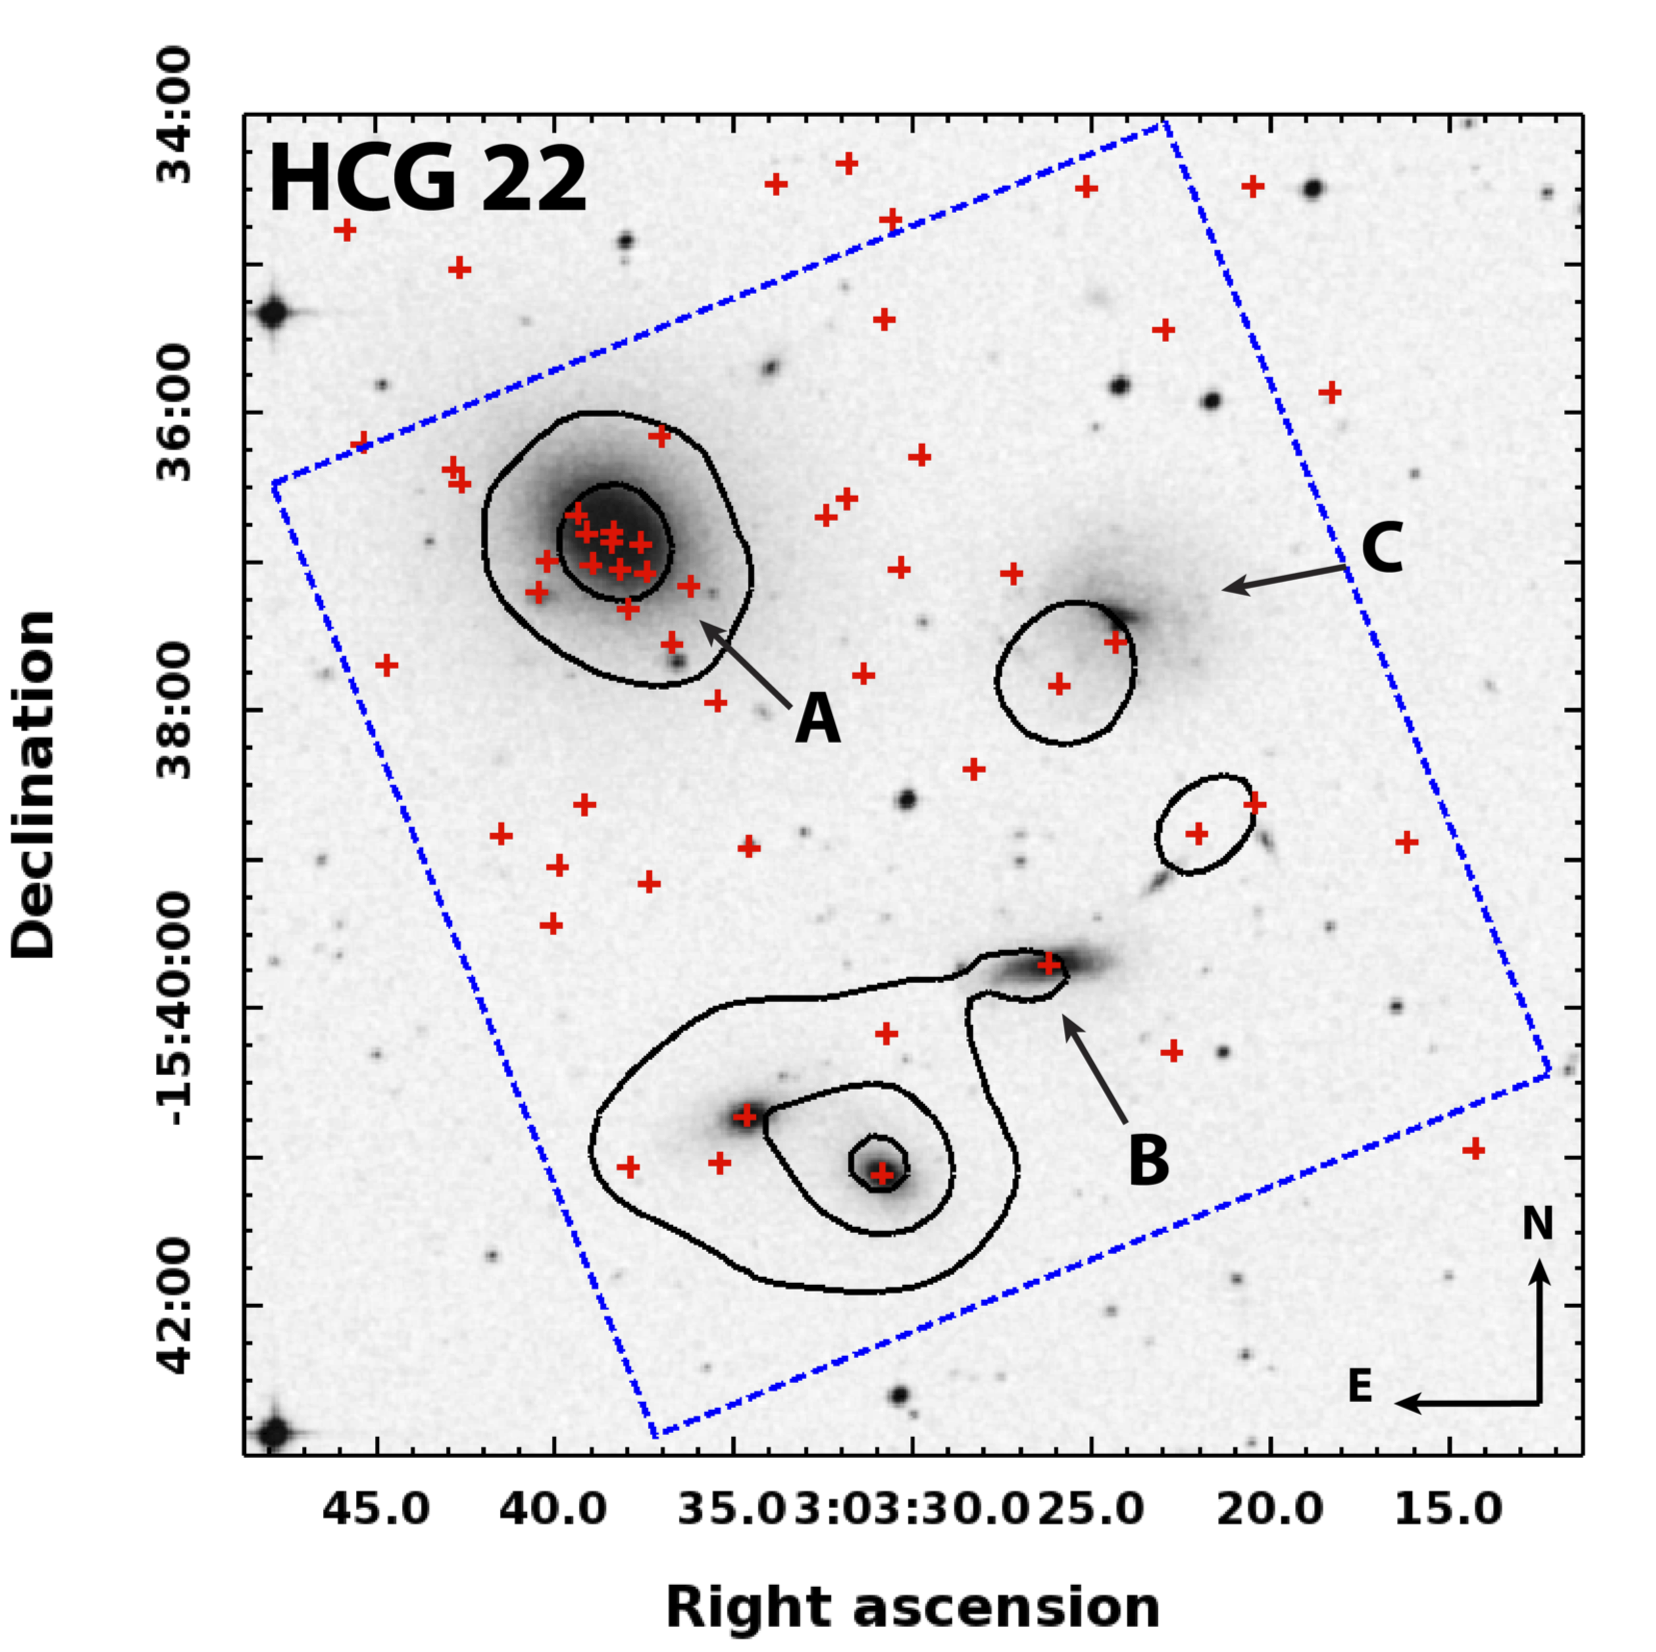
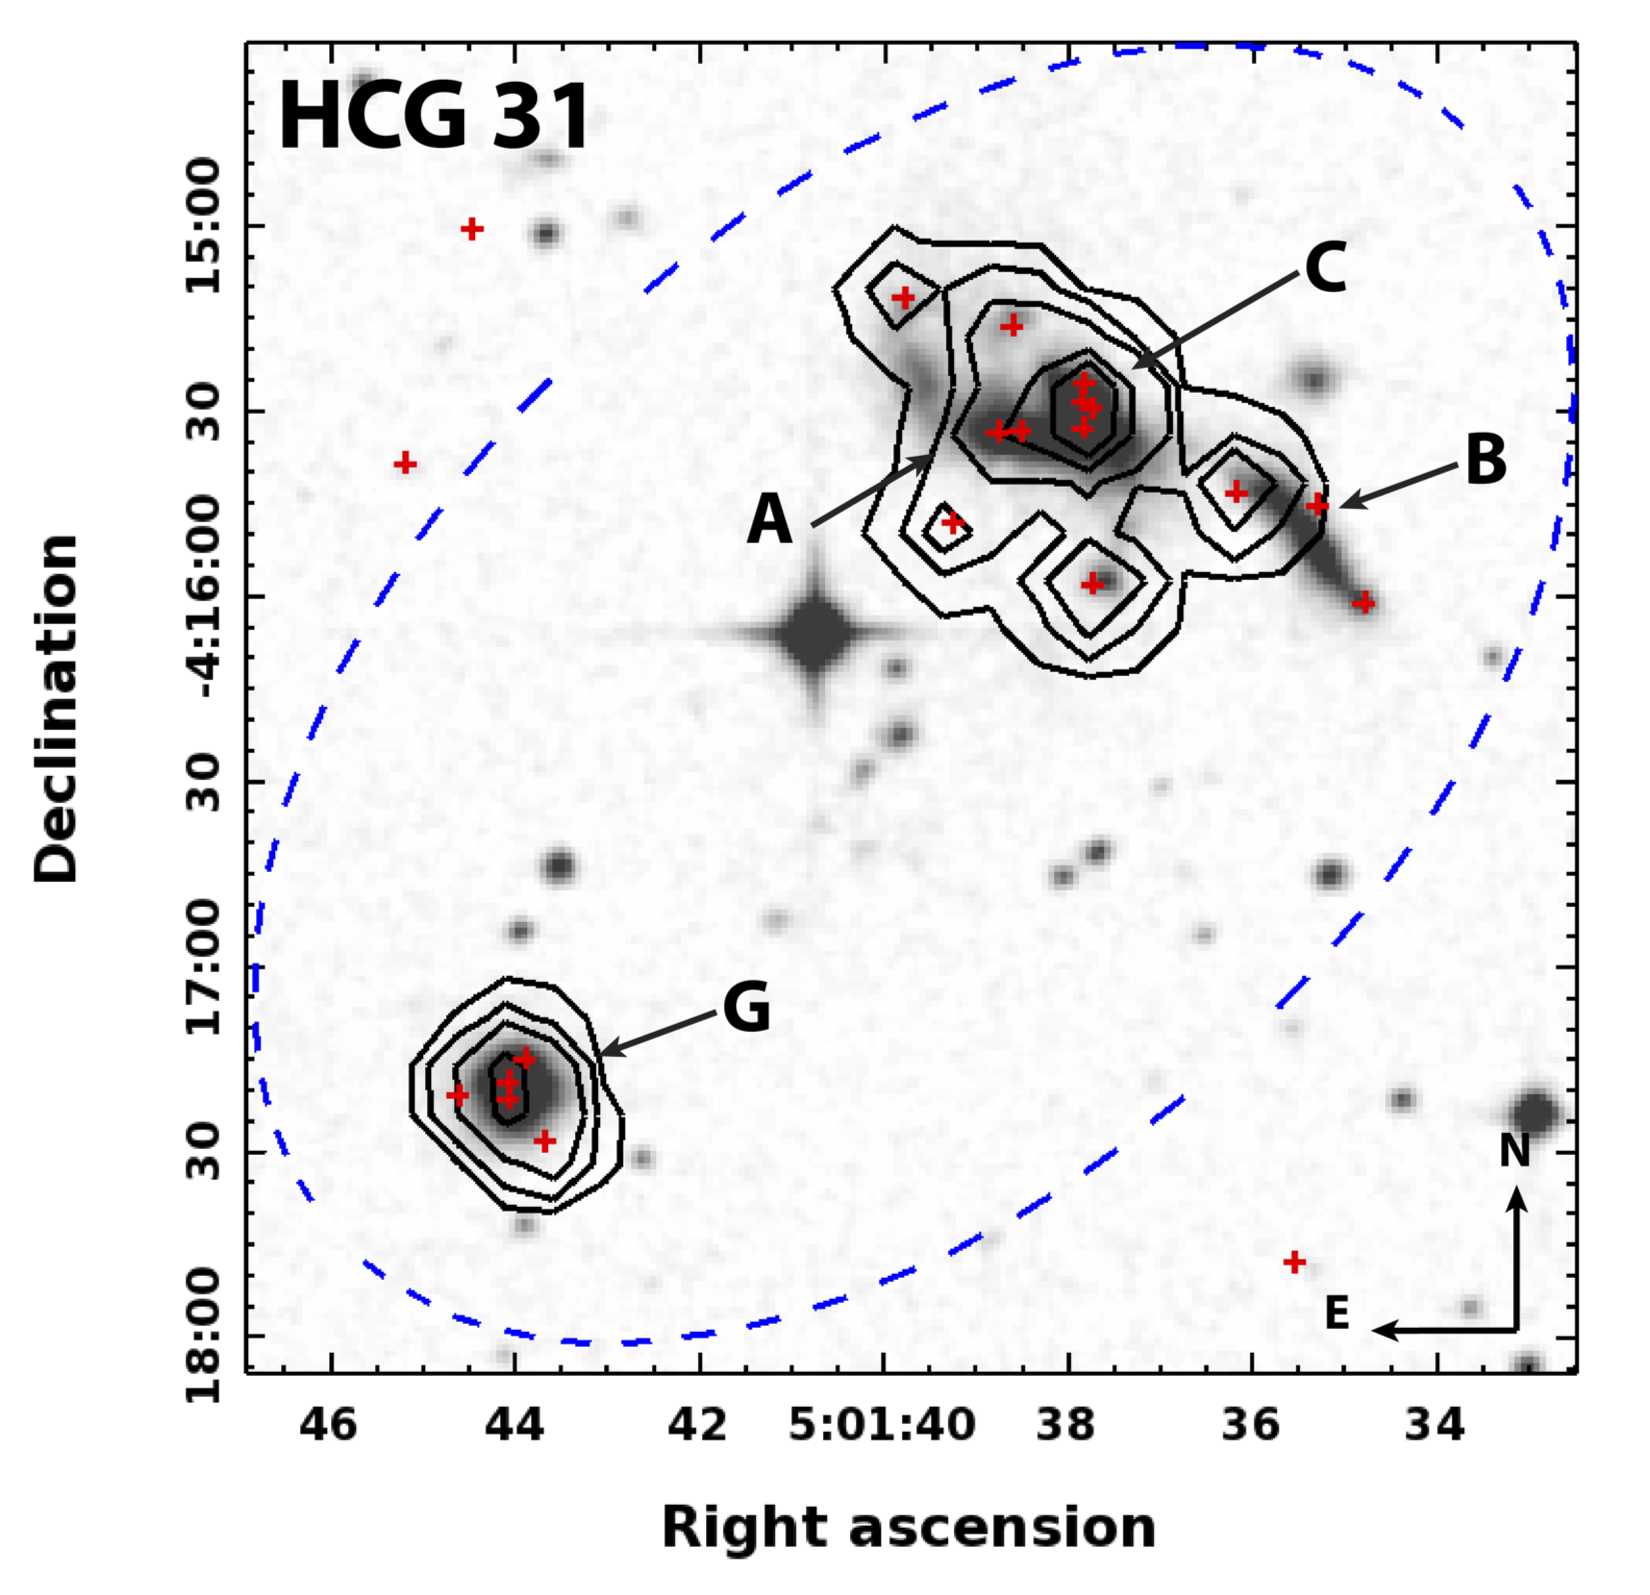
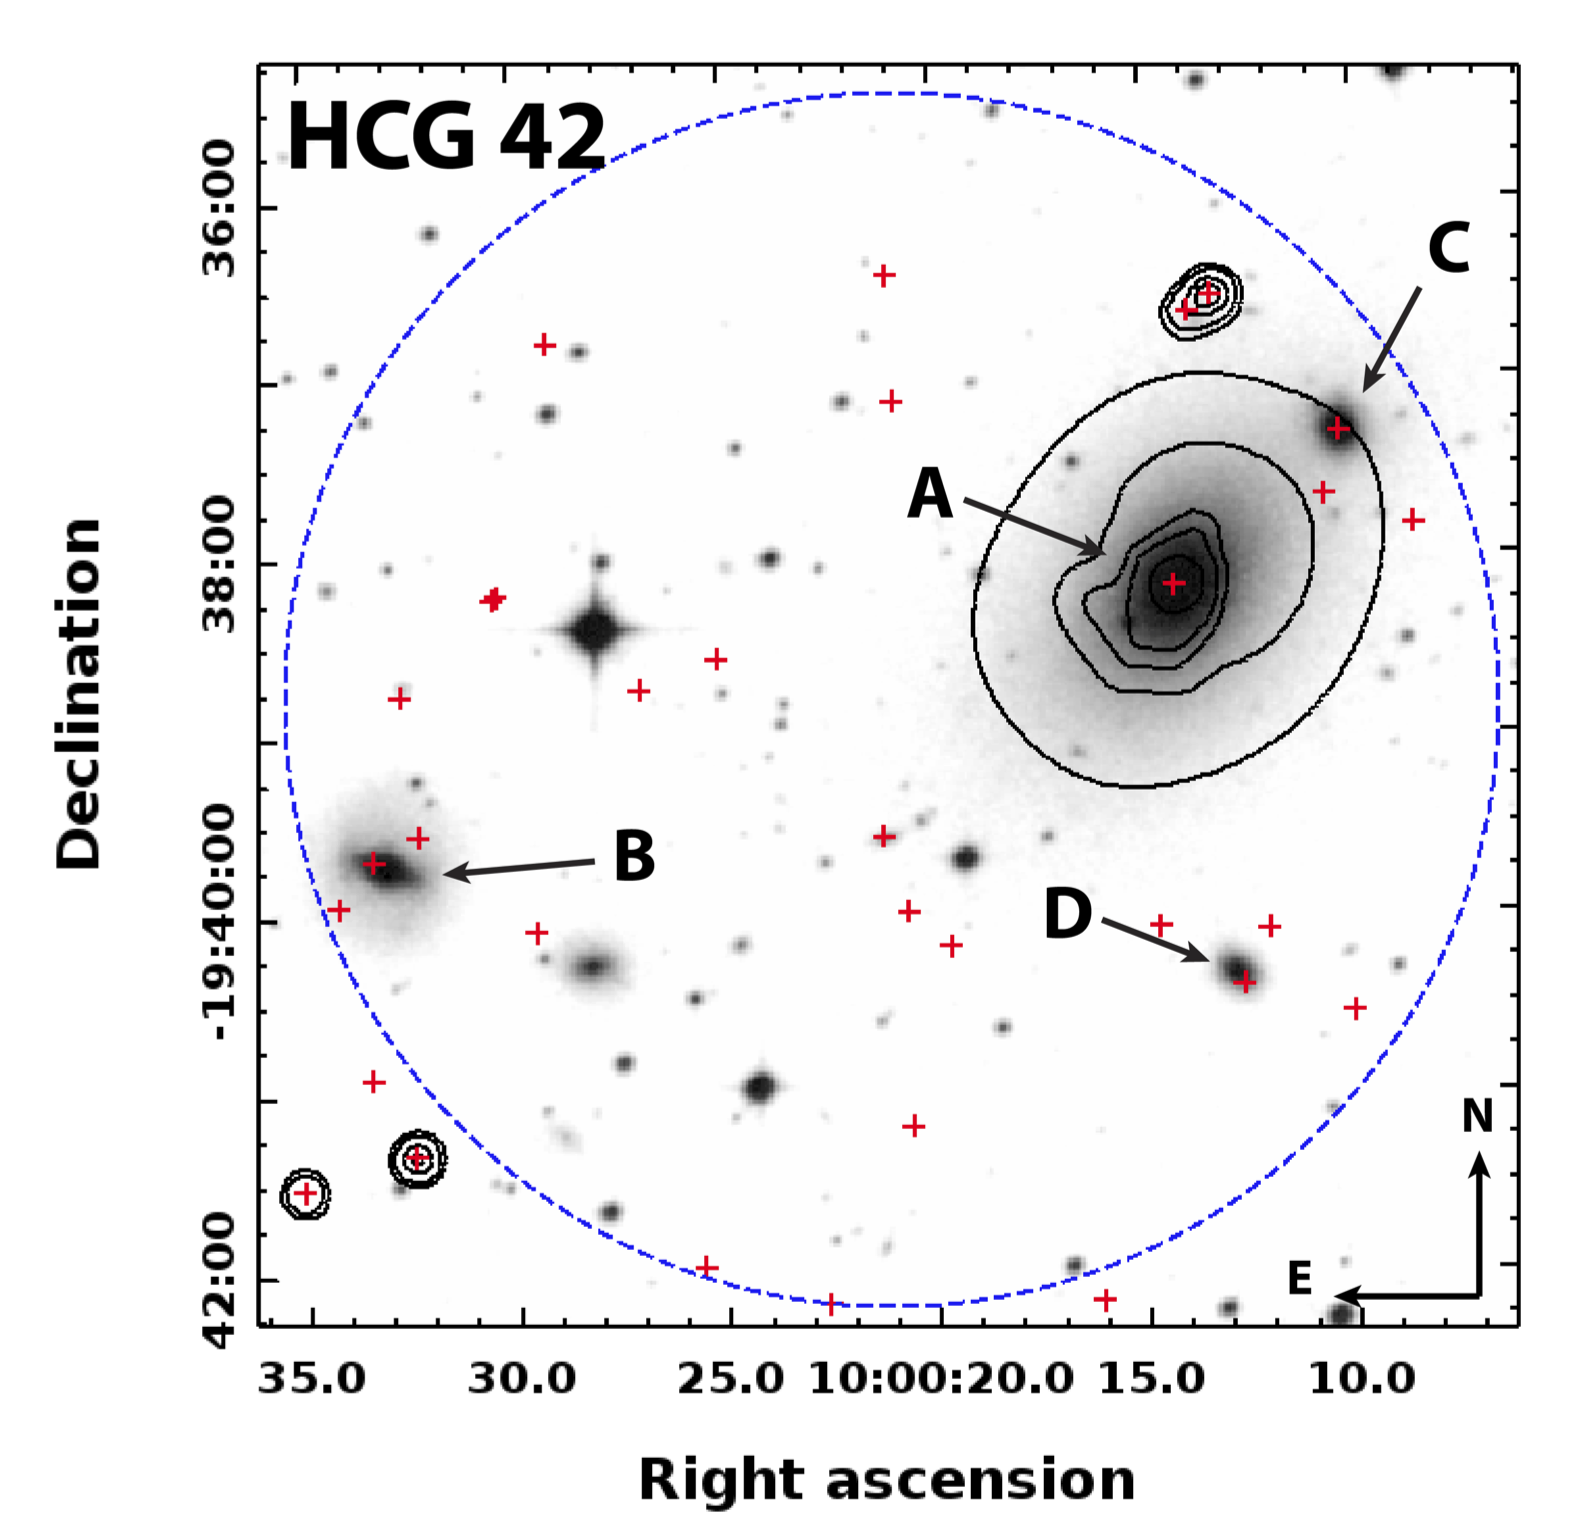
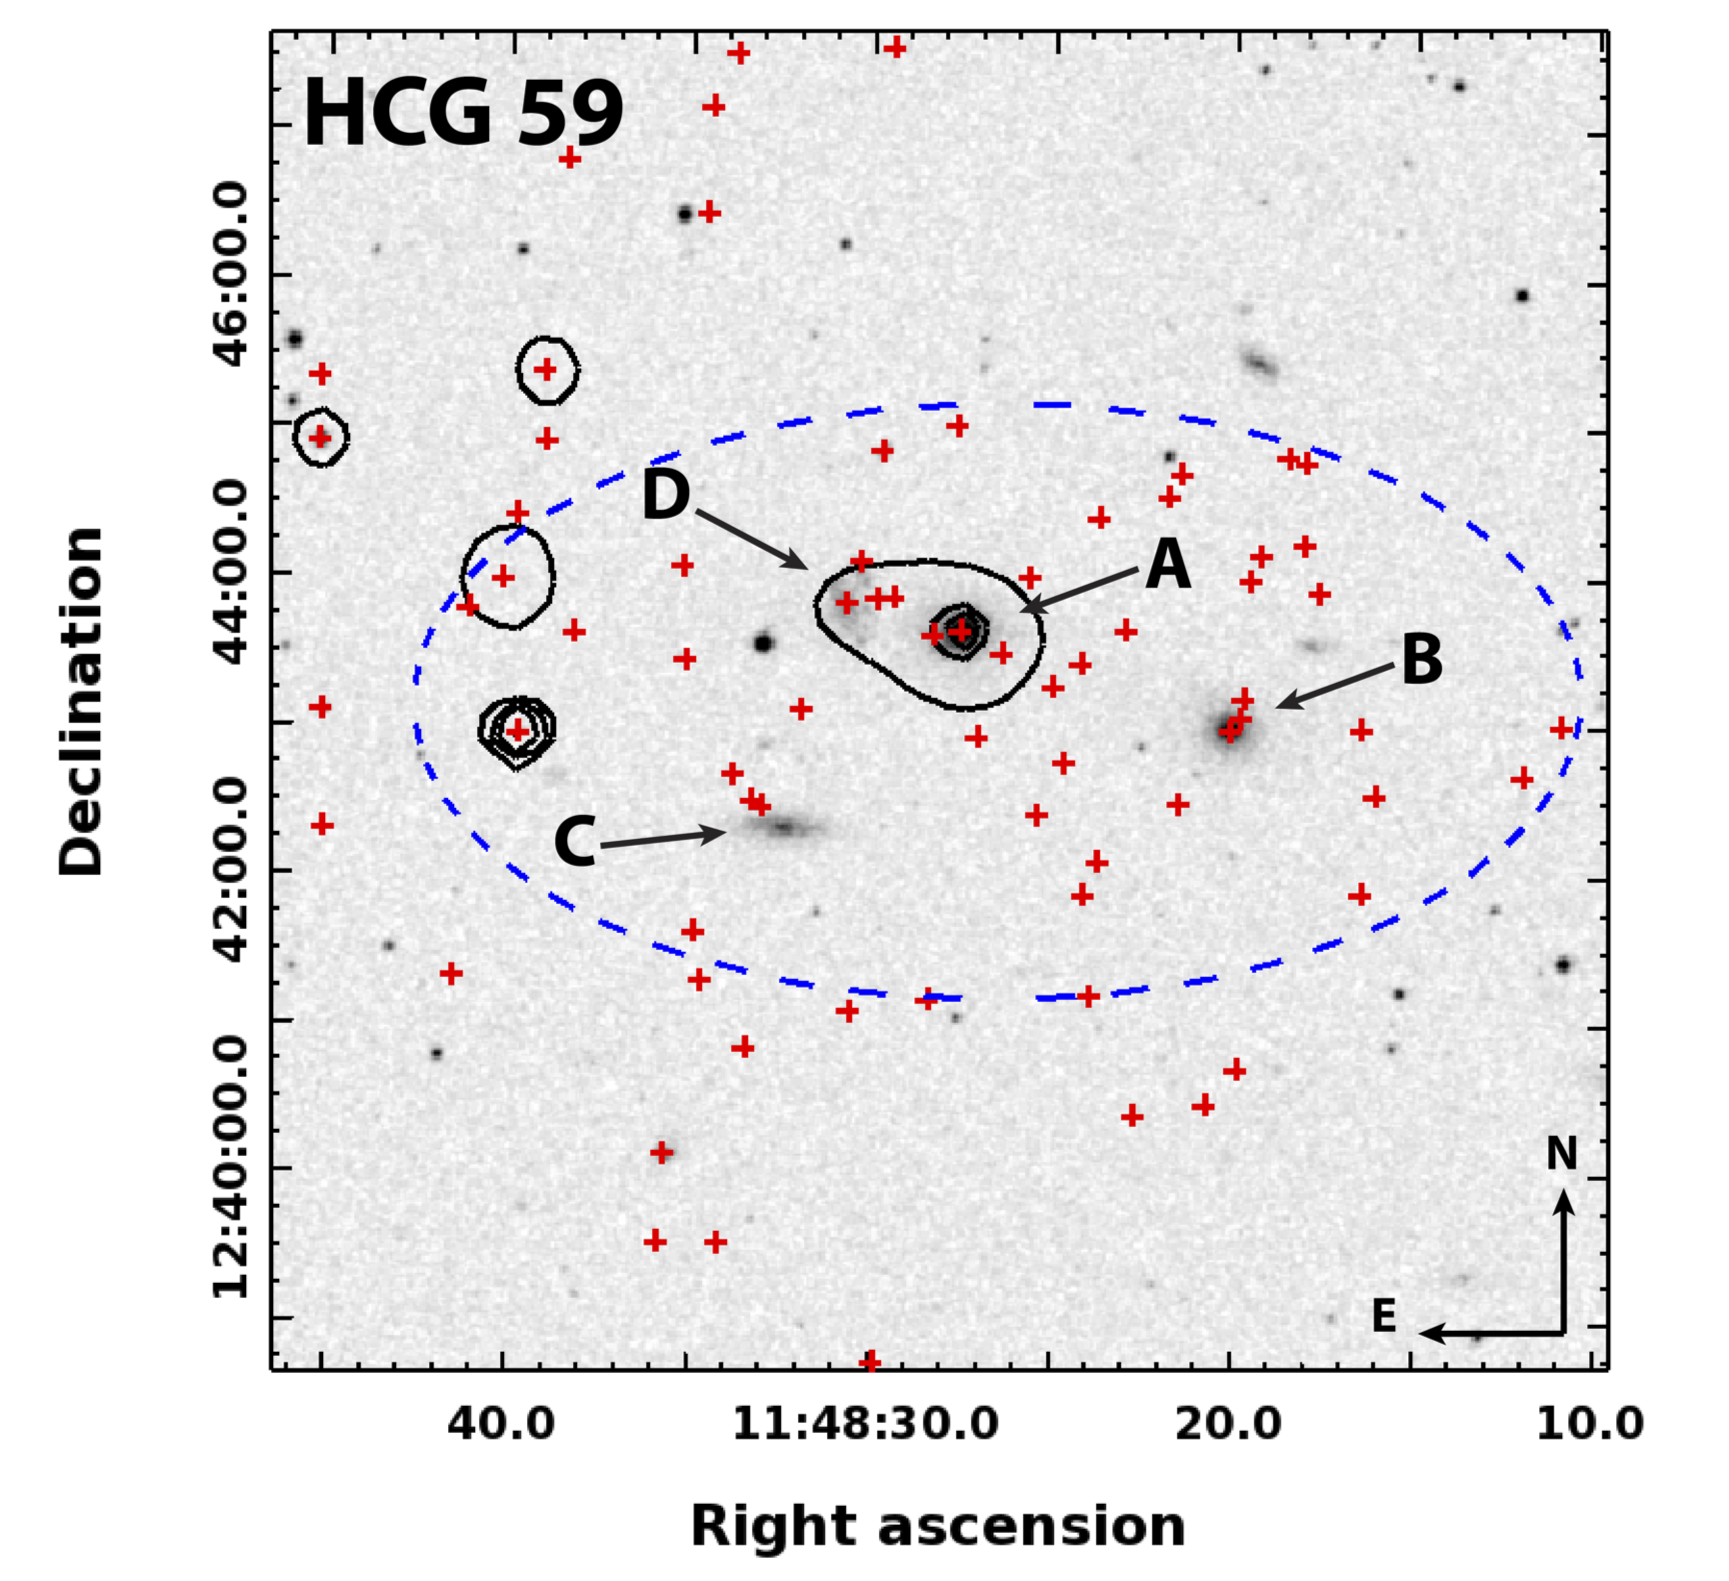
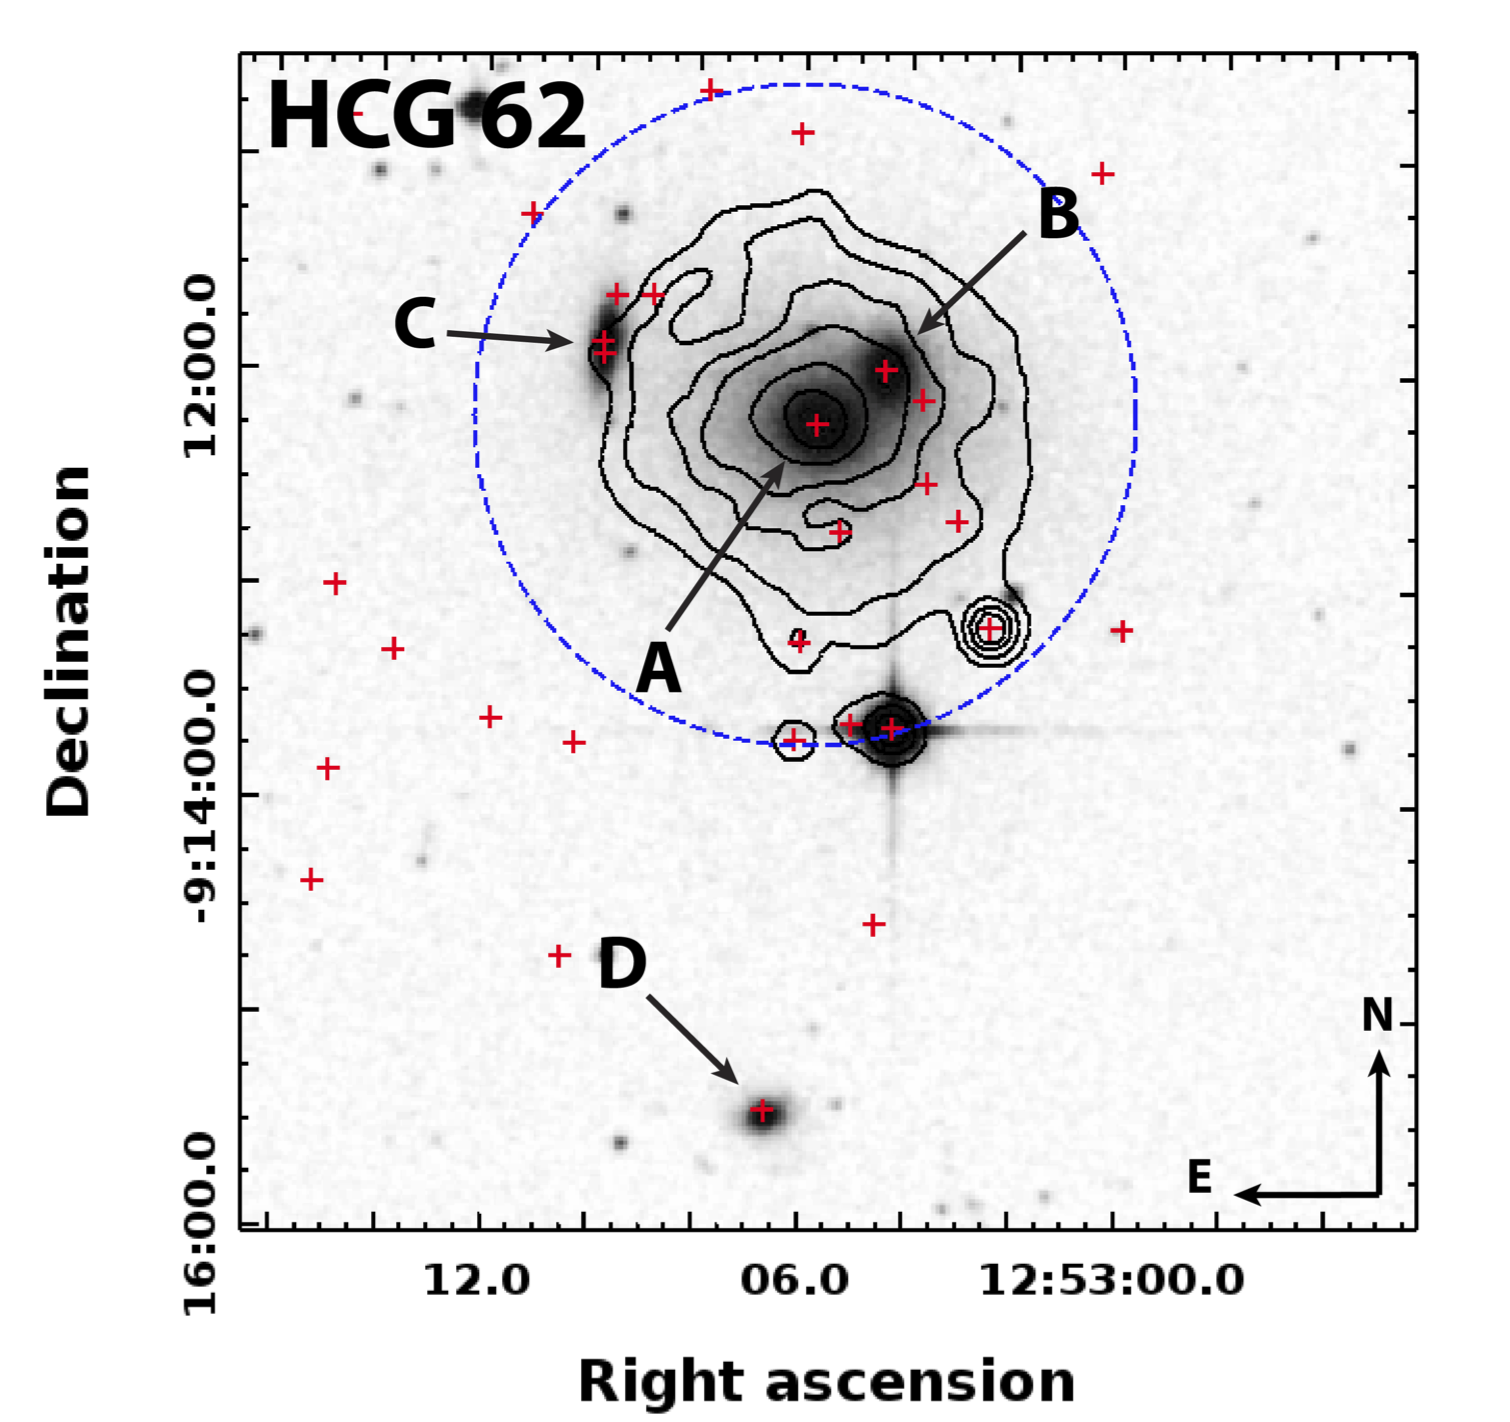
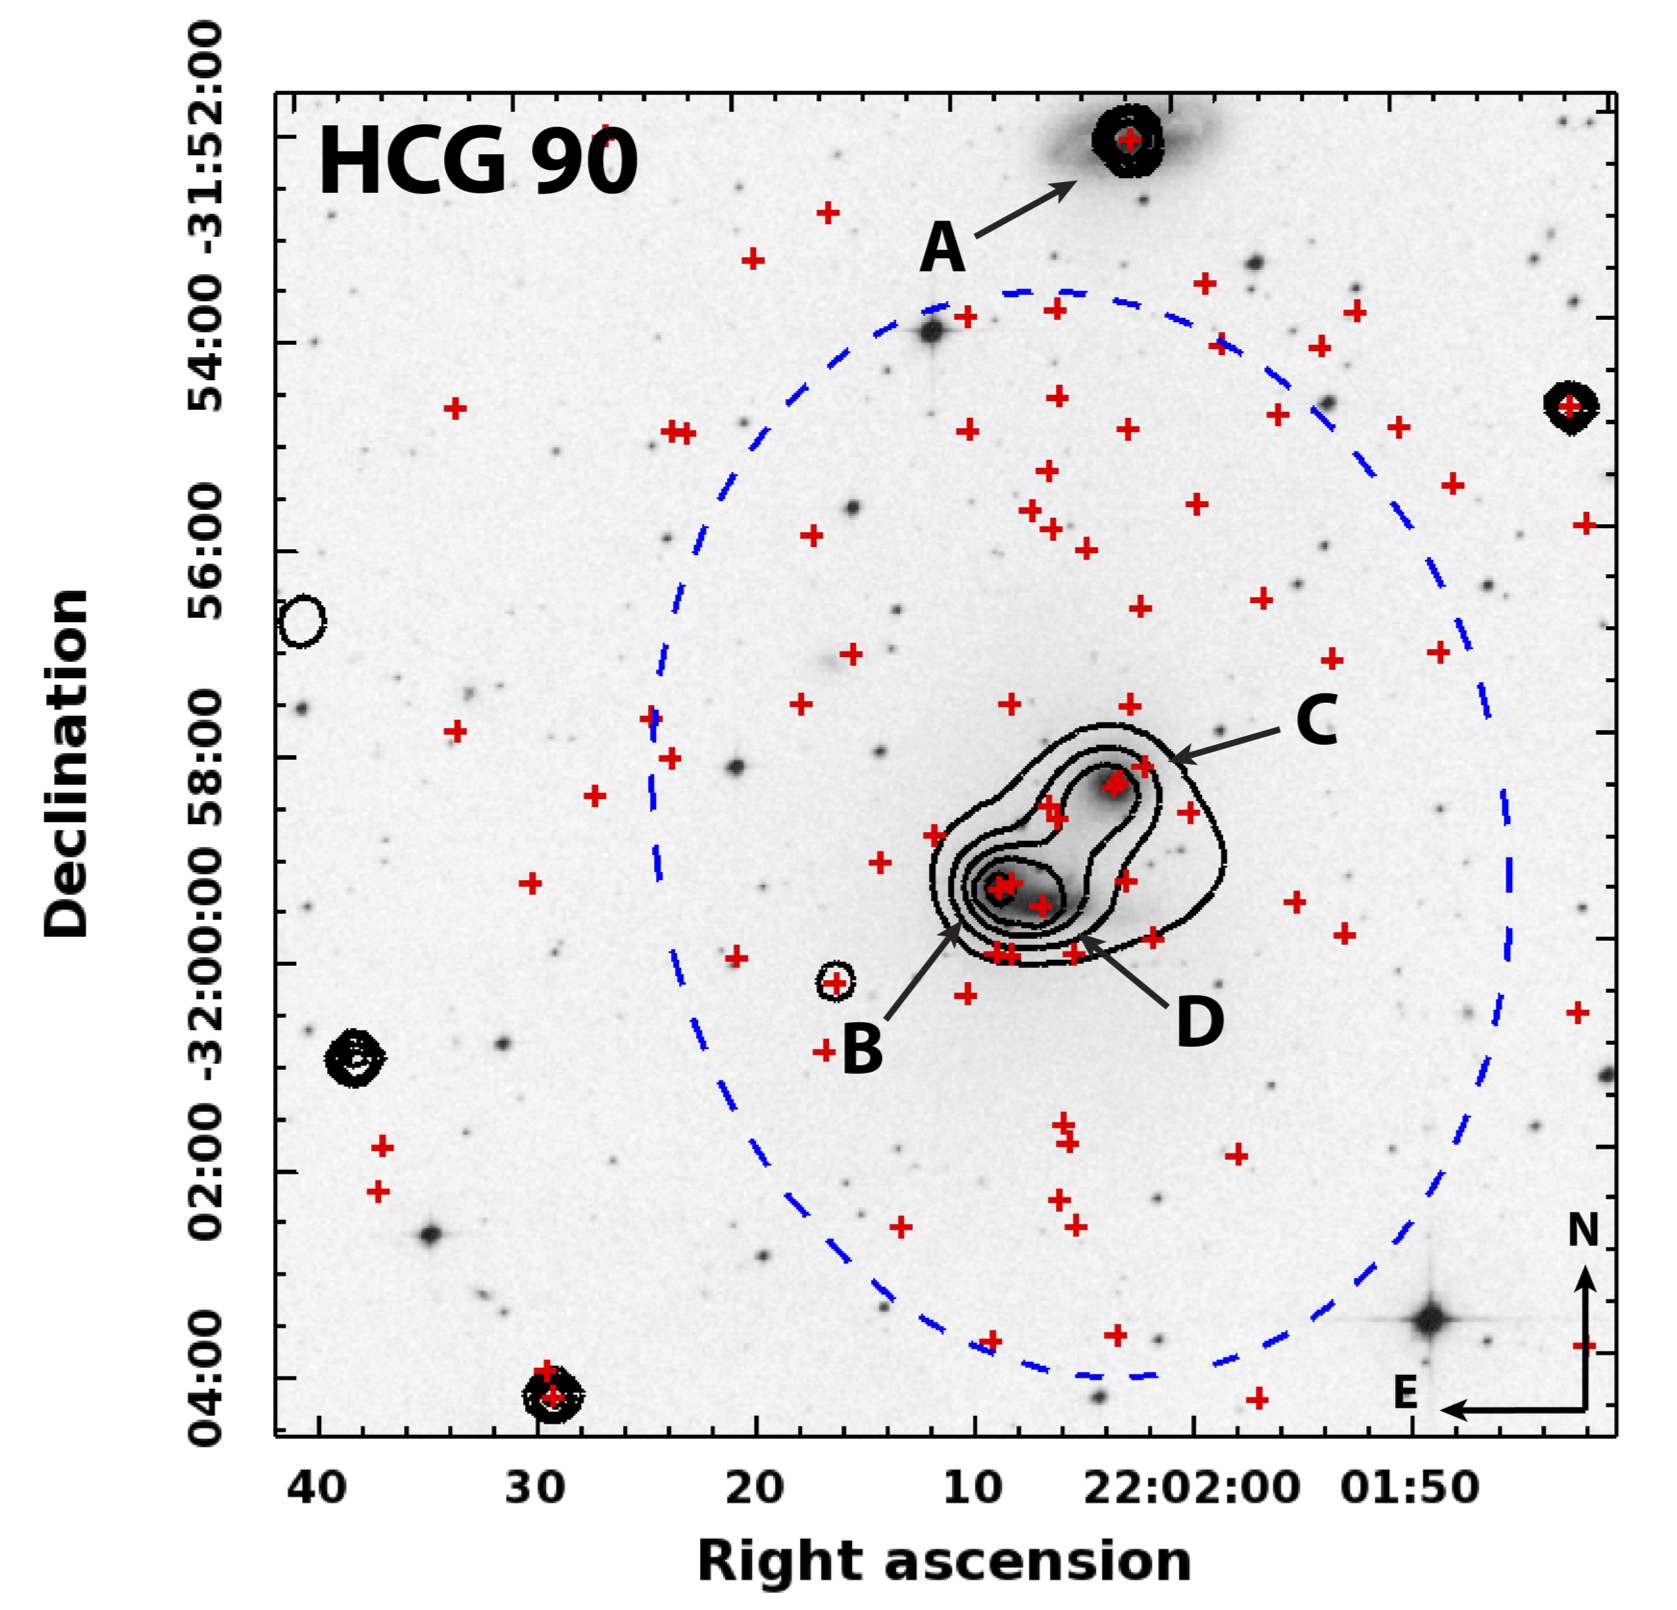
We identify hot diffuse gas in seven of nine groups (HCGs 16, 31, 42, 59, 62, 90, and 92) in our X-ray sample. Of the detected groups, diffuse emission in HCG 31 has not been reported in previous studies. Both of the two groups without detections, HCGs 7333A deeper 49 ks XMM observation (PI: Belsole) of this group exists, but no results have been published at the time of this writing. A brief inspection of the data shows several dozen point sources and large-scale diffuse emission across the field of view of the EPIC camera (5 times the angular size of HCG 7). The sensitivity of XMM to cool, extended gas complicates the interpretation of this emission as either related to the group or part of the SXRB. Results from this and other XMM data will be included in subsequent papers. and 22, have low to negligible star formation without much evidence of strong tidal interactions in the past few Gyr (e.g., Konstantopoulos et al. 2010). In the detected groups, the temperatures are all fairly similar (0.6–0.72 keV not including the hot component of HCG 62 or the anomalously low temperature of HCG 59, which is very poorly constrained), while the range in X-ray luminosities spans – erg s-1. The morphology of the hot gas ranges from isolated around individual group members to common X-ray halos (e.g., HCGs 16 and 62, respectively), as well as gas bridges connecting galaxies (HCGs 59 and 90; see §4.1). In Figures 1–7, we plot all values derived from model fits for multiple observations that could not be merged prior to fitting.
Table 3 lists relevant information about each of the groups in our sample. Included in the table are the group redshift and 3K CMB velocity, the calculated velocity dispersion, number of main group members, the number of galaxies used in the velocity dispersion calculation, the number of E/S0 type galaxies that are not considered dwarf members, the specific star formation rate from Tzanavaris et al. (2010), the total H i mass from Verdes-Montenegro et al. (2001) and Borthakur et al. (2010), the dynamical mass determined from the group velocity dispersion and mean two galaxy separation taken from Hickson et al. (1992), and the group H i evolutionary type defined by Johnson et al. (2007) (see §4.3 for a full description). We will continually refer back to these data throughout the figures and discussion that follow.
The nine groups in our sample were also observed with ROSAT and the results presented in Ponman et al. (1996). We compare our temperatures and luminosities derived from fitting the extracted spectra from the Chandra data with those also detected by Ponman et al. (1996) (i.e., HCGs 16, 42, 62, 90 and 92) in Table 4. Rather than directly compare the luminosities, we calculate the fluxes of the sources, which removes the dependence of the assumed cosmology. The redshifts used in the flux calculation for the ROSAT data are the same as those listed in the redshift column of Table 3. Note that Ponman et al. (1996) give errors in the luminosity and temperature at the 1 level. For the temperature in HCG 62, we use the luminosity-weighted average of the two plasma temperatures, while the fluxes in HCGs 62 and 92 are based on the average of the luminosities weighted by total counts in the different Chandra obsIDs, therefore the percent errors on these values seem quite large because of the compounding of errors from multiple measurements. In all cases, the luminosity of the X-ray emission from the ROSAT data is found to be brighter in the Ponman et al. (1996) study. When comparing the temperatures we determined against those from Ponman et al. (1996), we find that HCGs 62 and 90 are consistent between the two studies, while HCG 16 is significantly hotter, and HCGs 42 and 92 are significantly cooler than previously reported. The mean temperature of the groups detected in both studies is 0.70 and 0.72 keV with standard deviations of 0.25 and 0.14 keV in Ponman et al. (1996) and this study, respectively. The temperature discrepancies are likely due to the difference in the PSF of ROSAT PSPC instrument compared to the Chandra ACIS camera. Specifically, the detection and subtraction of point sources in the diffuse emission is much more robust using Chandra data, and point sources contaminating the extracted spectrum would alter the peak of the emission leading to an incorrect estimation of the hot gas temperature. We also note that Ponman et al. (1996) attempted to subtract the diffuse X-ray contribution of the individual group members and interpolate over the ‘holes’. This, combined with distinctions in the extraction regions and the responses of the ROSAT PSPC and Chandra ACIS instruments, may explain the differences in the results.
4.1 Gas Distribution and Morphology
Figure 1 shows the smoothed diffuse X-ray emission in the CGs included in our study. To construct the X-ray maps, we smoothed the level 2 events files in the range of 0.5–2 keV using the adaptive smoothing csmooth algorithm. Pixels with S/N above the stowed background were smoothed with a Gaussian kernel with smoothing scales between 2 and 10 pixels. From the figures, we note that the hot gas in compact groups exhibits varied morphologies including small halos around one or several galaxies, plumes centered on particular group members, tidal bridges, and large common halos encompassing most of the group.
The maps were qualitatively assessed by eye to categorize the observed X-ray emission as either associated with the environment or the individual group members. Of the nine CGs included in our study, we do not detect diffuse emission from HCGs 7 and 22. From those groups detected with Chandra, only HCG 62 has emission that permeates the IGM, while HCG 42 has a bright X-ray halo centered on the brightest group galaxy (i.e., 42A). We consider these two groups indicative of systems with X-ray emission similar in morphology to clusters. The other groups, HCGs 16, 31, 59, 90, and 92 (excepting the shock front in the case of HCG 92), are those in which the hot gas is associated with the individual galaxies. Mulchaey (2000) noted that previous X-ray telescopes did not have the requisite spatial resolution to separate the intragroup gas from the galaxy-linked emission; however, the resolution of Chandra is well suited to this task. Futhermore, we join Tamburri et al. (2012), who presented a Chandra study of HCG 79 (also known as “Seyfert’s Sextet”), in speculating that perhaps many compact groups exhibit galaxy-linked X-ray emission rather than a hot intragroup medium associated with the environment. Throughout the remainder of the paper, unless explicitly stated, we discuss the galaxy- and environment-linked diffuse X-ray emission together as they fit into a larger picture of group evolution, i.e., from dynamically unevolved systems with X-ray emission confined to the galaxies to more evolved systems with a single X-ray halo. We stress that it is difficult to disentangle the galaxy- and group-linked emission in the data as this distinction is not always clear, as in the emission surrounding HCG 42A.

.png
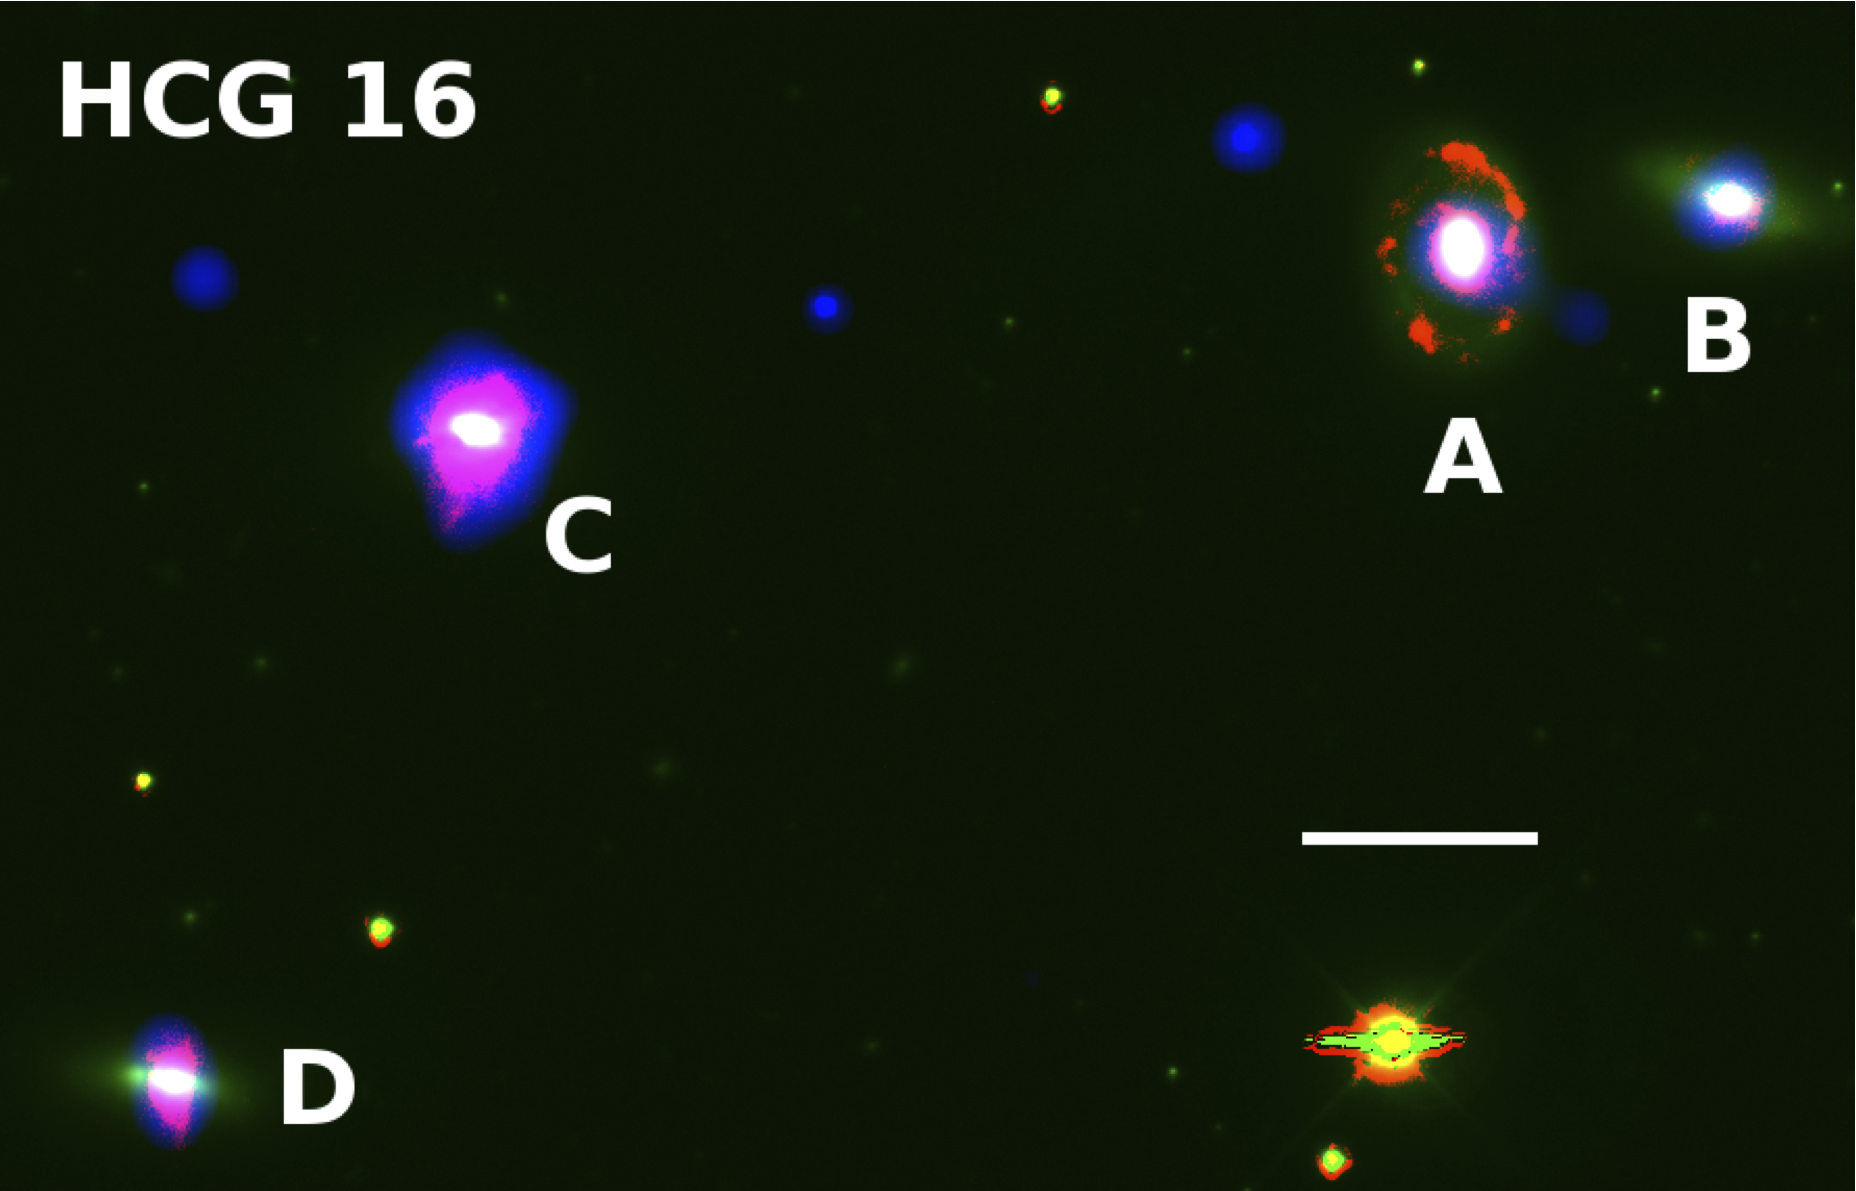
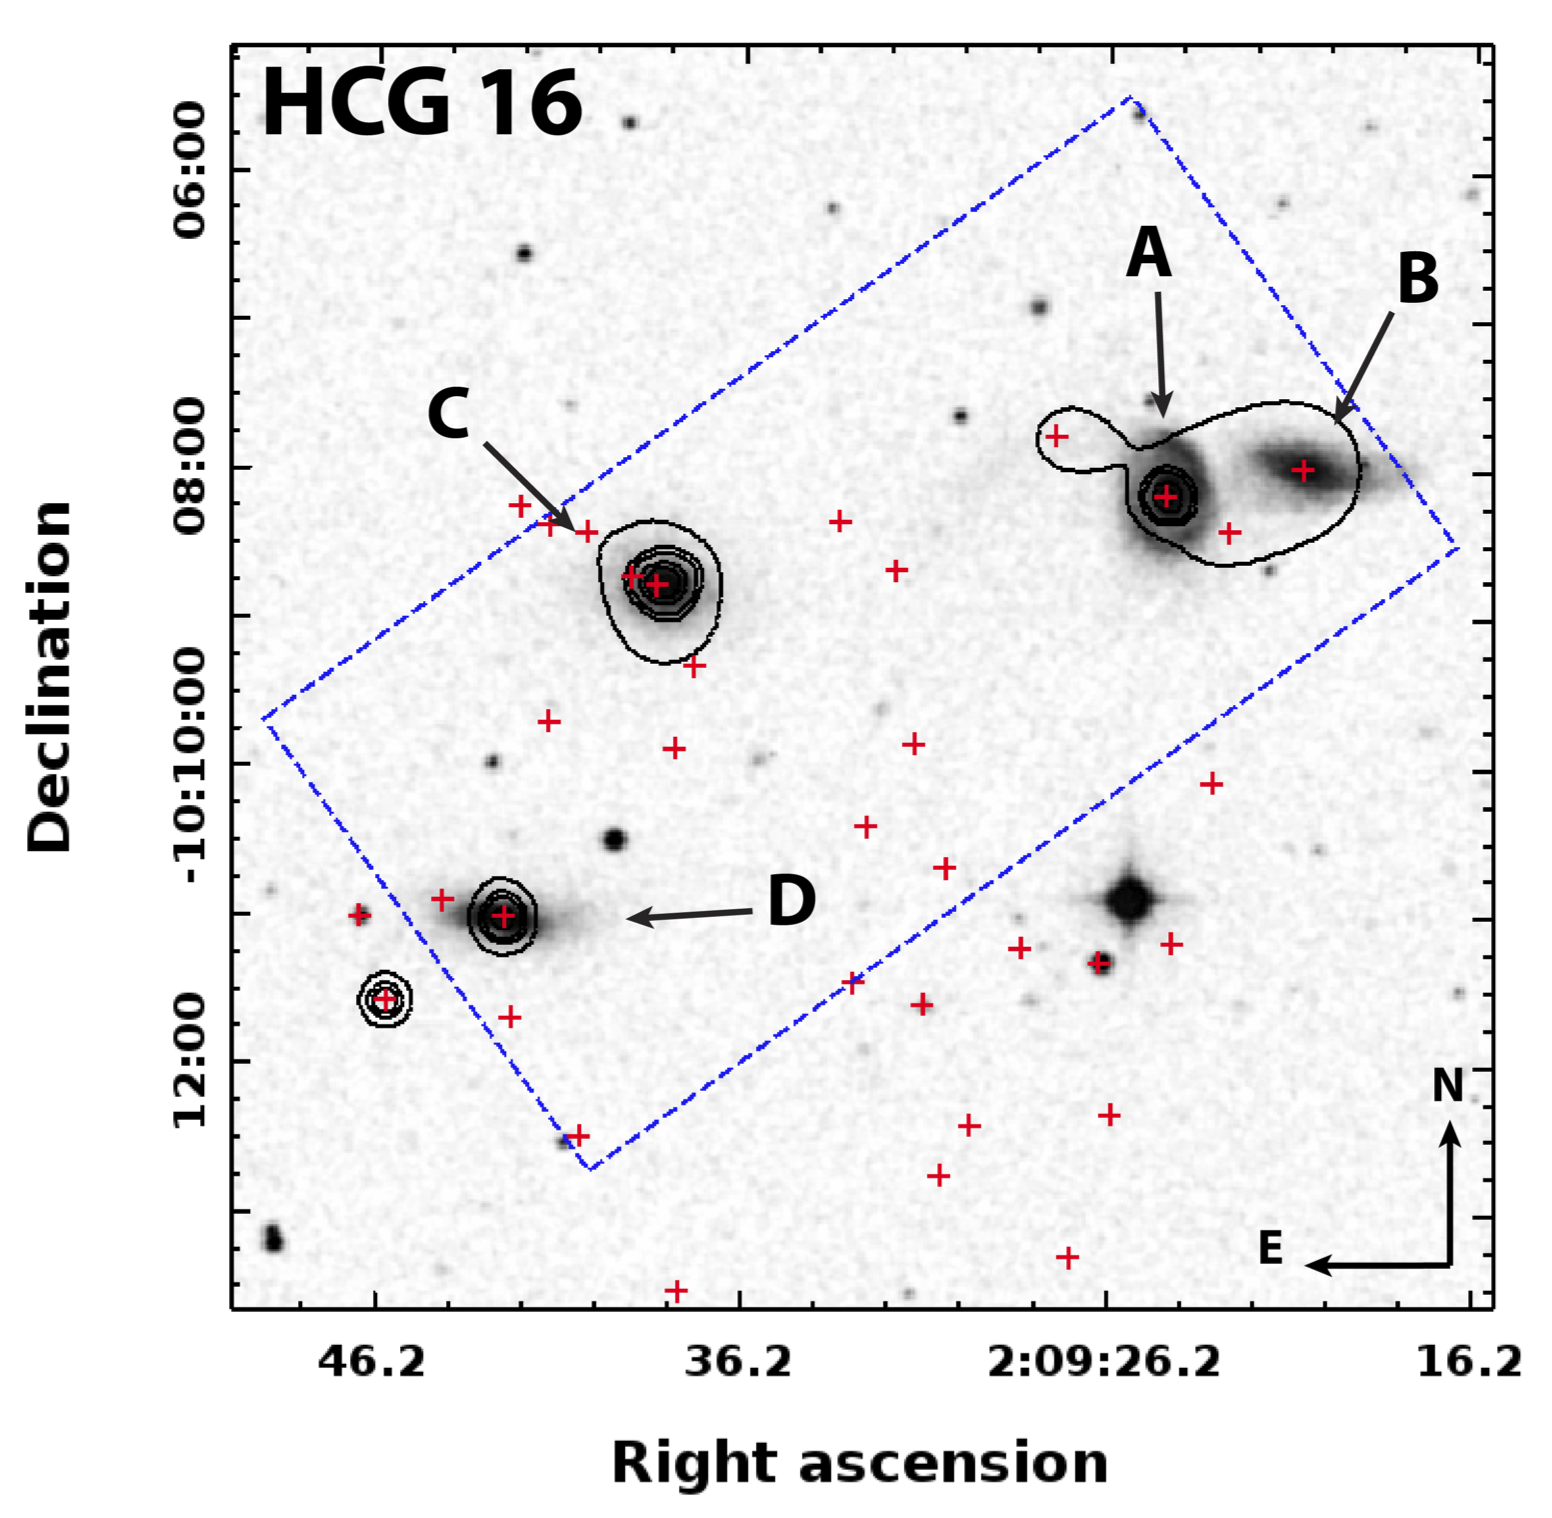
In the specific case of HCG 16, the group contains two members (C and D) with hot gas plumes that are coincident with extended H emission (see Figure 2). Both galaxies show clear signs of recent interactions (e.g., disturbed velocity fields; gas/stellar disk misalignments; Mendes de Oliveira et al. 1998; a common H i envelope surrounding the group; Verdes-Montenegro et al. 2001) and are strong starbursts with SFRs of 14 and 17 M⊙ yr-1, respectively, and SSFRs of yr-1 (Ribeiro et al., 1996; Tzanavaris et al., 2010). Rich et al. (2010) used integral field spectroscopy to demonstrate that the motions of the gas and the optical emission-line profiles of 16D are indicative of an M82-like superwind due to the intense starburst within the galaxy, and that 16D and M82 share some similar properties (e.g., metallicity, , ). Based on its high star formation rate and extended emission-line gas, 16C may represent a second M82-like starburst in the HCG 16 group, possibly triggered by a recent ( Gyr) tidal interaction with 16A similar to the encounter between M81 and M82 220 Myr ago (Gottesman & Weliachew, 1977; Konstantopoulos et al., 2009). Furthermore, Jeltema et al. (2008) found evidence for a weak soft X-ray bridge connecting galaxies 16A and B indicating a recent tidal interaction between these group members as well.
Further examining the morphology of the hot gas and its relation to the galaxies in the compact groups, we find that the gas in low dynamical mass ( M⊙) groups with low velocity dispersions ( km s-1) is concentrated around the individual group members, while gas in relatively higher mass systems with larger velocity dispersions begins to resemble a common envelope.
4.2 The and Relations Re-visited
Previous work has examined the relationships between the X-ray luminosity and both the plasma temperature and the cluster/group velocity dispersion in systems of galaxies (e.g., Ponman et al. 1996; Mulchaey & Zabludoff 1998; Wu et al. 1999; Helsdon & Ponman 2000; Osmond & Ponman 2004; Mulchaey et al. 2003). The cluster data have been found to show very little scatter in and space. However groups, with fainter X-ray luminosities, have been found to exhibit a larger spread potentially due in part to uncertainties in the measurements, or because they are not virialized systems (see below). We merge the cluster data from Wu et al. (1999) and Zhang et al. (2011) for comparison to the CGs. Prior to merging, we first adjusted the Wu et al. (1999) data to our assumed cosmology, while Zhang et al. (2011) used the same cosmology as that assumed in this paper. When comparing the cluster data to the compact groups in space, we only include the 176 clusters with uncertainties in both and temperature. This same criterion, with respect to velocity dispersion rather than temperature, is applied to the cluster data when comparing the groups and clusters in space, resulting in 142 clusters in this sample. We note that the Zhang et al. (2011) clusters are measured to (i.e., the radius at which the average density falls to 500 times the critical density at that redshift), and the extraction regions used in this work vary between 26% and 69% of . It is unclear to what radius the Wu et al. (1999) clusters were measured, however the authors state that they used a model to correct all of their data to the same fraction of the virial radius.
Figure 3 shows the relationship for the groups and the clusters from Wu et al. (1999) and Zhang et al. (2011). Using linear regressions described by Akritas & Bershady (1996), we fit the clusters in space not including the compact groups. For this fit, we use the orthogonal distance regression (ODR) fitting method, which finds , where and are in units of erg s-1 and keV, respectively. Examining Figure 3, we find that HCGs 31, 42, 59, and 92 agree with the cluster relation within the errors. We note that HCG 62 lies slightly above the the cluster relation (i.e., it is brighter for its temperature). HCGs 7, 16, 22, and 90 lie below the relation from the clusters.
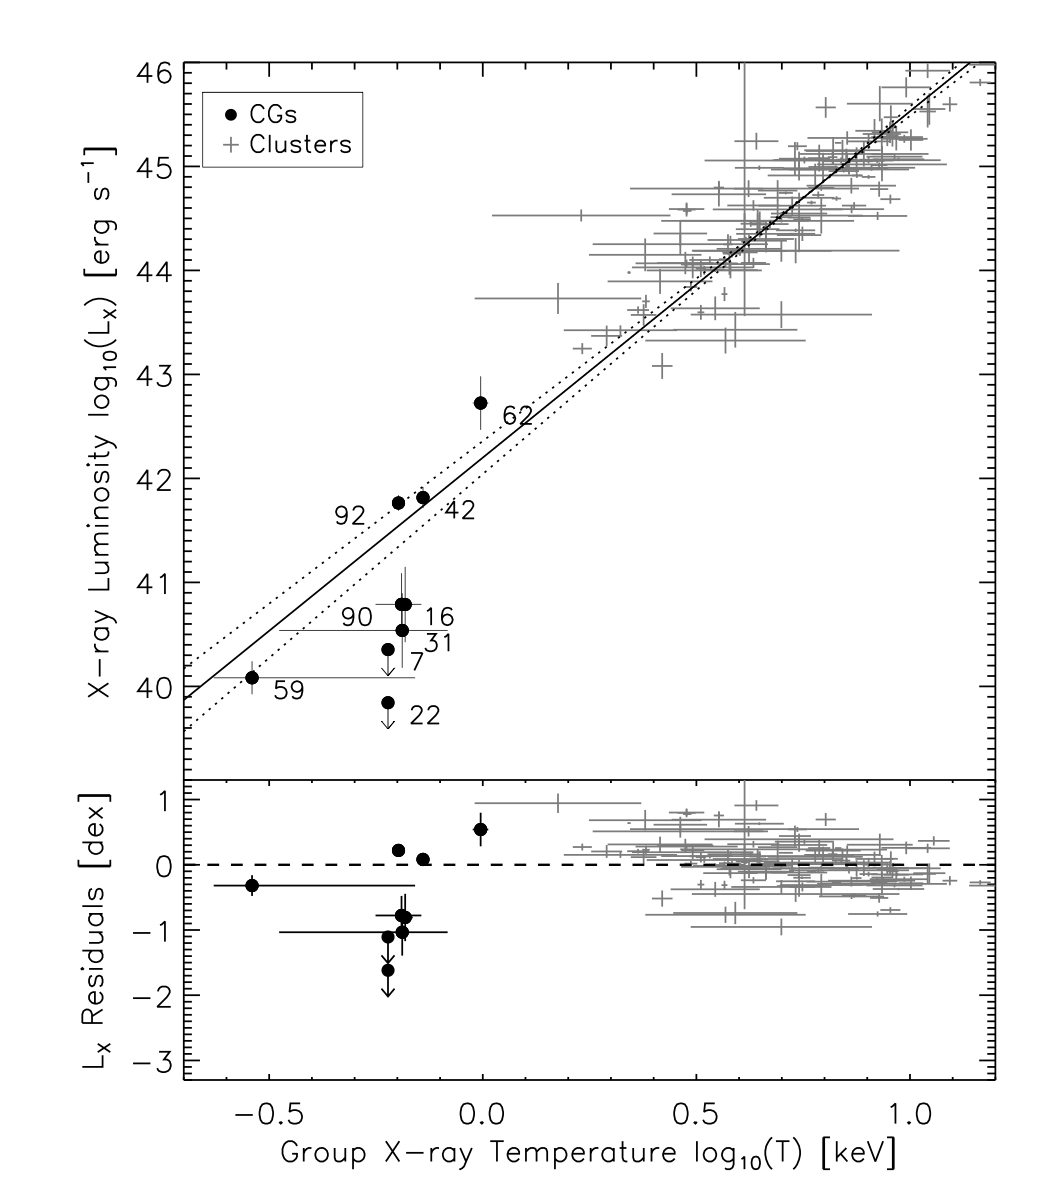
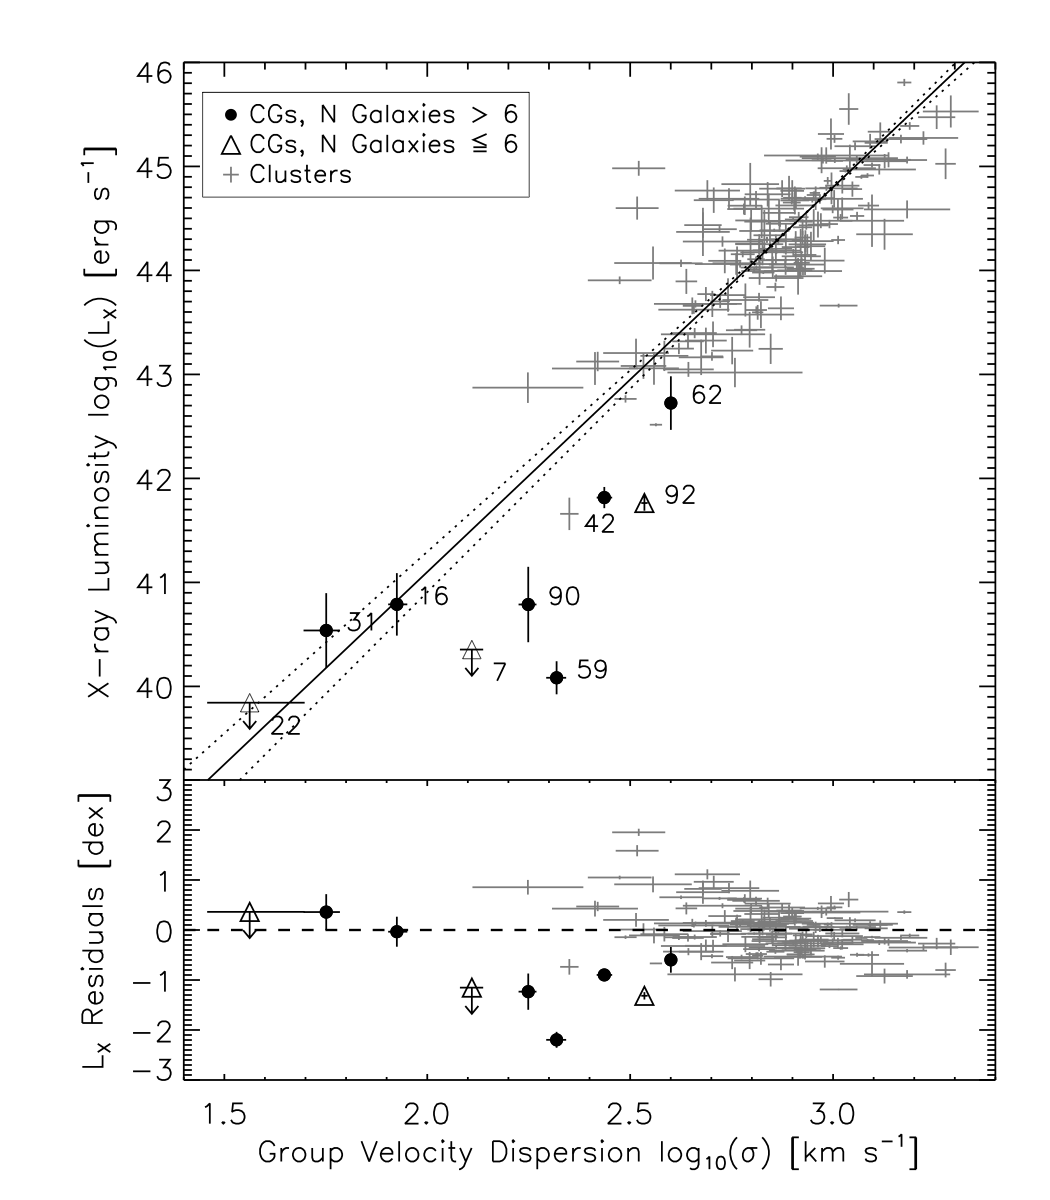
Figure 4 shows the relation for the groups in our sample. Velocity dispersions were calculated using the most accurate velocities available from NED for the CG members including additional known group members primarily from the large spectroscopic surveys of de Carvalho et al. (1997), Zabludoff & Mulchaey (1998), and Zabludoff & Mulchaey (2000) (see Table 3 for full velocity references). Velocity errors for individual group members were typically km s-1. Again, we compare our compact group data with the cluster data taken from Wu et al. (1999) and Zhang et al. (2011) using a linear least-squares fit. We chose this type of fit because the ODR method used in the diagram showed strong systematics in the residuals of the cluster data. The resulting best fit is , where and are in units of erg s-1 and km s-1. We find that two of our CGs (HCGs 16, 31) agree with the relation from the galaxy clusters within errors, while HCG 62 is similar to the clusters within the scatter. In the cases of HCGs 16 and 31, this agreement is likely coincidental because the relation is predicted from the Virial theorem to be , and the bulk of the hot gas in these systems is clearly due to star formation. We do note, however, that for groups in which dynamical processes are increasingly important in heating the gas (i.e., HCGs 42, 59, 62, 90, and 92), there does appear to be a monotonic increase in the X-ray luminosity with increasing velocity dispersion, albeit with some scatter.
Ponman et al. (1996) hypothesized that higher temperatures for a given than would be expected from the cluster relation for compact groups could be a result of the injection of energy into the IGM from galactic winds, while Ponman et al. (1999) suggested that the observed deviation of the galaxy group X-ray luminosities from the established cluster scaling relations could be explained by preheating of the IGM by supernovae. In the preheating model, heating of the gas in the IGM occurs early in the lifetimes of groups and similarly steepens the relation for these systems. Despite groups such as HCG 16 where star formation may play a more prominant role, the existence of X-ray brighter groups (i.e., HCGs 42) below the scaling relation for clusters indicates that galaxy winds alone are unlikely to explain the observed deviation. However, the observed dichotomy in X-ray gas morphology (i.e., galaxy- vs. environment-linked emission) may indicate that the low-mass, low velocity dispersion systems are dynamically unevolved and have shallow potential wells that are unable to heat any neutral gas that has been liberated from the group members. In these systems, the role of individual galaxies may be more important in heating gas through local (e.g., star formation, superwinds, and accretion) rather than global processes (e.g., virialization). As systems accrete more mass or as the system relaxes, the potential well will deepen and the contribution of individual group members to the diffuse X-ray emission should lessen.
After attempting to subtract the X-ray emission associated with the group members in HCGs, Ponman et al. (1996) found that the relation was flattened compared to the clusters (i.e., the rate of change in as a function of was slower for groups than for clusters), similar to the dell’Antonio et al. (1994) Einstein study of rich groups444While dell’Antonio et al. (1994) did not subtract the galaxy-linked emission from their data, they did avoid using data in instances where the hot gas was clearly associated with only galaxies and not the group environment., as well as a subsequent study of CGs by Helsdon & Ponman (2000). The morphology of the hot gas in CGs may provide an explanation for the groups that disagree with the and relations derived from galaxy clusters. As discussed in §4.1, the hot IGM that permeates HCG 62 and the X-ray bright halo centered on HCG 42A have morphologies that are qualitatively similar to the hot gas observed in the cluster environment, i.e., where the gas has been heated by virialization. In the remaining groups, the only diffuse X-ray emission we detect is associated with the individual galaxies rather than the group environment itself. This suggests that the gas is not in hydrostatic equilibrium within the group, and therefore the temperature and luminosity of the total X-ray gas in the system does not trace the group potential as it does in the galaxy clusters.
For completeness, we compare our sample of compact groups to studies of the X-ray scaling relations in both normal (i.e., those that are not compact) and fossil groups. With respect to the relationship, Khosroshahi et al. (2007) and Harrison et al. (2012) noted that fossil groups match well with both clusters and normal groups. Only three of the compact groups presented in our study (HCGs 42, 62, and 92) agree well with the cluster scaling relation within the scatter, though HCG 92 is dominated by emission from a strong shock. The remaining CGs at keV fall below the best fit to the cluster data. In space, Rines & Diaferio (2010) showed that normal groups did not deviate from the relation for clusters, while Khosroshahi et al. (2007) found that fossil groups are consistent with the best fit to the cluster data, though more X-ray luminous than the normal groups in their sample. Our sample of compact groups fall systematically below the observed relation for clusters with the exceptions of HCGs 16 and 31, which are dominated by vigorous star formation. This may be in agreement with the interpretation of merging systems being X-ray underluminous for their velocity dispersions (e.g., Rasmussen et al. 2006; Popesso et al. 2007). We caution the reader that in most cases the velocity dispersions of the groups are measured from very few galaxies, therefore they likely do not accurately represent the three dimensional dispersions that are assumed by the relation.
Based on the discrepancies between the compact groups and the X-ray cluster scaling relations, we postulate that systems similar to the low-mass, X-ray faintest groups in our study should not be considered analogs to clusters, with the possible exception of HCG 62, which lies close to the cluster data in both and within the scatter. It is important to note that this dissimilarity between the low-mass groups and clusters does not preclude these systems from becoming more cluster-like if they somehow become similar to the more massive, rich groups in our sample (e.g., by accreting additional members and continuing strong interactions to liberate gas into the IGM). However, it is unlikely that rich groups today formed from poor groups like those observed in the current epoch. Therefore the exact mechanism whereby the poor groups in our sample could become more cluster-like remains unknown. We do note, however, that there could be extended, faint emission that is undetectable in the available data (e.g., the X-ray IGM of HCG 16; Belsole et al. 2003). Deeper observations may reveal cooler, lower luminosity gas associated with entire groups rather than the galaxies, which could shed light on the relationship between poor groups and more cluster-like systems.
4.3 Comparison of the X-ray Data with H i Gas
Previous work has shown that relatively H i rich compact groups contain galaxies that exhibit mid-IR colors dominated by star formation with correspondingly high SSFRs measured from UV+24 m fluxes, while groups deficient in H i have more quiescent colors and low SSFRs (Johnson et al., 2007; Walker et al., 2010, 2012; Tzanavaris et al., 2010). This suggests an evolutionary sequence of compact groups in which the H i gas is processed either through star formation or ionization by the group potential (the velocity dispersions imply virial temperatures of 0.08–0.3 keV; Verdes-Montenegro et al. 2001; Johnson et al. 2007). Therefore, we expect that the most H i abundant groups should have very weak diffuse X-ray emission, while the H i poor groups should have the brightest X-ray luminosities. Furthermore, the morphology of the H i gas may dictate how it is processed, i.e., through star formation or by virialization in the IGM in CGs with neutral gas confined to the galaxies or stripped into the IGM, respectively (cf. Konstantopoulos et al. 2010). Throughout this section, we use the H i abundance type notation from Johnson et al. (2007). Types I, II, and III indicate decreasing H i abundance relative to the group dynamical mass, respectively. Johnson et al. (2007) quantitatively define these H i mass types as (I) log(M)/log(M, (II) )/log(M, and (III) log(M)/log(M. The H i evolutionary types for each group are listed in the last column of Table 3.
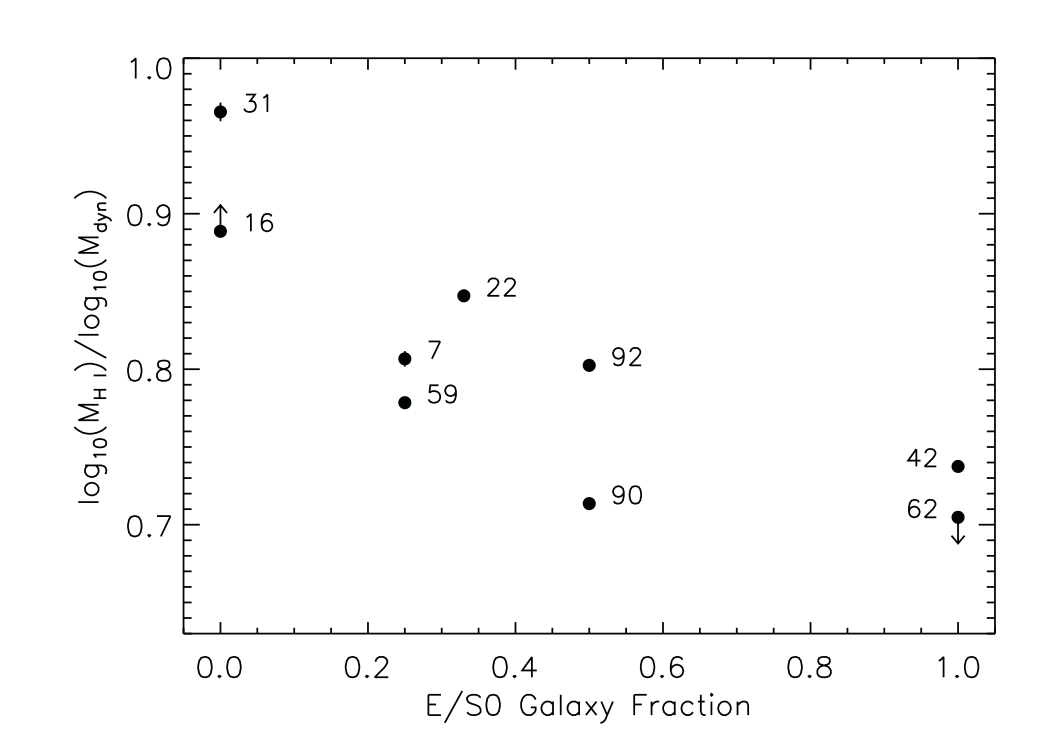
We calculate the H i to dynamical-mass ratios for the CGs in our sample using the most precise velocities available from NED, the two galaxy median separators from Hickson et al. (1992), and total group H i masses from Green Bank Telescope, Arecibo Observatory, and Effelsberg 100 m Antenna single dish measurements by both Verdes-Montenegro et al. (2001) and Borthakur et al. (2010)555The H i masses of HCGs 16 and 62 are lower and upper limits, respectively. The lower limit of the mass in HCG 16 is due to the large angular size of the H i envelope, which extends beyond the Green Bank Telescope beam.. Subtypes based on the morphology of the H i gas, which we qualitatively assessed from VLA observations, are included as part of the proposed evolutionary sequence of compact groups (Konstantopoulos et al., 2010). Type A groups are those in which the neutral gas is confined to the individual group members, while Type B groups have H i gas distributed between the galaxies and not centered on any particular member(s). We first test the use of the H i to dynamical-mass ratio as a descriptor for group evolutionary state by comparing it to the group E/S0 galaxy fraction for the main galaxies. Using the H i mass to dynamical-mass ratio to characterize the evolutionary state is preferred over the E/S0 fraction because the mass ratio is a continuous distribution, while the E/S0 fraction values are discrete due to the small number of relatively massive members in each group. To quantify the relationship, we used the ASURV statistical package (Lavalley et al., 1992), which implements the methods presented in Isobe et al. (1986), to compute the Spearman rank correlation coefficient. This test measures how well the data are fit by a single monotonic function. From Figure 5, we find that the H i mass normalized by the group dynamical mass decreases with increasing E/S0 galaxy fraction (67% probability from Spearman test). This result is expected if the H i to dynamical-mass ratio is indeed a tracer of the evolutionary state of the system.
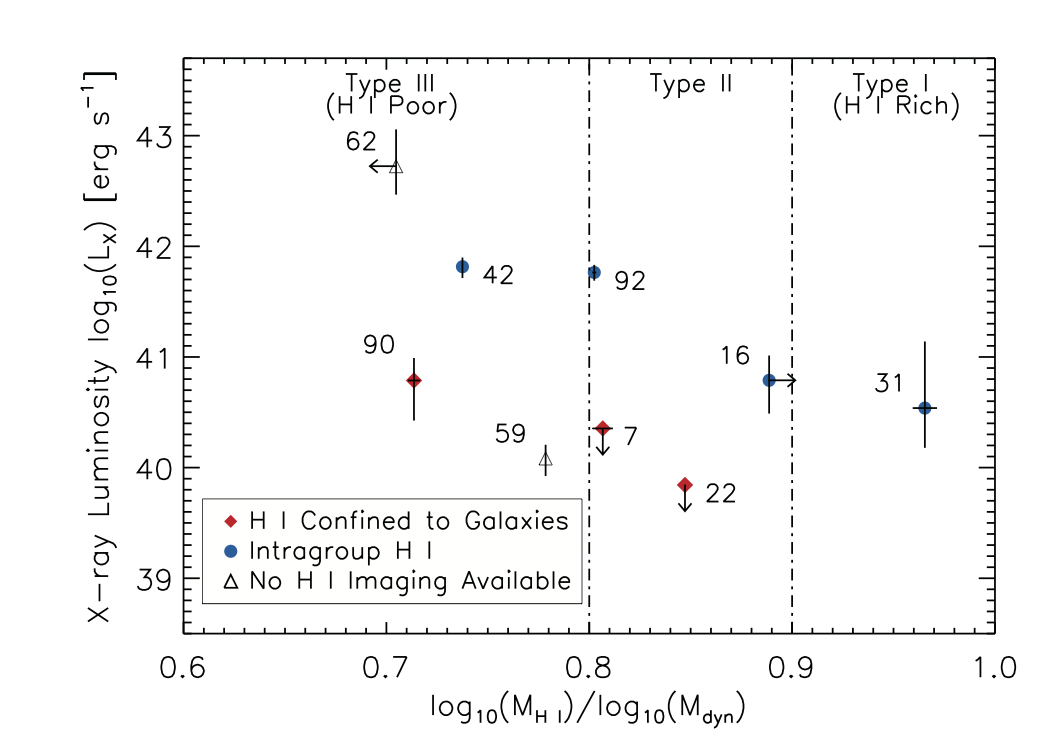
When we examine how changes with H i mass ratio, we observe that the H i poor Type III HCGs 42, 59, 62, and 90 are X-ray brighter compared to more H i rich groups as expected if the gas has been processed by star formation or heated by the group potential. Of the Type II groups, we note that HCG 92 appears to be nearly as bright as the H i poor CGs, probably due to the shock front created by the high velocity intruder galaxy in the group (e.g., Trinchieri et al. 2003; O’Sullivan et al. 2009). The only H i rich Type I in our study is HCG 31, which contains diffuse X-ray emission linked to star formation activity. Figure 6 shows the X-ray luminosity as a function of the H i mass ratio. From the figure, we can see that compared to the hot gas in other Type III groups, HCGs 59 and 90 are 1–2 orders of magnitude fainter than the remaining H i -poor HCGs. In the case of HCG 90, this could stem from the exclusion of galaxy A from the X-ray analysis due to its bright Seyfert 2 nucleus (see Appendix A), however it is unlikely that including the diffuse emission from 90A would increase the total group luminosity by an order of magnitude to bring it to the level of the brighter Type III groups.
From Figure 6, we note that if we include the H i distribution subtypes of the groups, then there may be two distinct trends between the total diffuse X-ray luminosity and the H i evolutionary type. Specifically, the Type A groups (H i confined to galaxies) appear to be consistently less luminous in X-rays compared to Type B groups (H i in the IGM). Based on this tentative result, it is reasonable to predict that HCG 62 should have any remaining H i dispersed throughout its IGM, while H i gas in HCG 59 should be mostly contained in and around its group members. However, we note that this result is preliminary and that more data are required to quantitatively assess the likelihood that the two H i gas morphologies are distinct populations in X-ray luminosity. If we assume these H i morphology classifications for HCGs 59 and 62 to increase the number of data points in each sample to the minimum required, a two sample K-S test gives a 95% probability that the H i subtypes are two distinct populations in X-ray luminosity. To examine how our assumption concerning the H i subtypes of HCGs 59 and 62 influenced the test, we perform a second K-S test in which we switch the H i morphology classifications for these groups (i.e., HCG 59 has intragroup H i, while 62 has H i only in the galaxies). This results in an 12% probability that the two H i morphologies represent distinguishable populations in . Due to the small sample size, we cannot determine if this distinction is statistically significant, and further data are required to clarify this phenomenon.
We note that the mix of galaxy morphologies in the groups complicates the comparison of the H i and X-ray gas. However, Verdes-Montenegro et al. (2001) and Borthakur et al. (2010) reported on the observed H i masses in these groups and the predicted H i masses based on the group member luminosities and morphologies using relations from Haynes & Giovanelli (1984) who examined H i in a sample of isolated galaxies. From this, we can compute H i deficiencies for the groups in our sample, where deficiency describes the ratio of the H i mass observed to that predicted (in contrast to our use of H i rich and poor, which describes the relative neutral gas mass normalized to the dynamical mass). Using the nomenclature of Borthakur et al. (2010) (i.e., “heavily” deficient, “slightly” deficient, and normal groups contain , between and , and of their predicted H i, respectively) we find that the X-ray fainter groups are either heavily deficient (7, 22, and 90) or normal (59) groups, while the brightest groups are either slightly deficient (16, 31, 62666This group is likely heavily deficient as its H i mass is actually an upper limit and the ratio of the limit to the predicted value is 35% (Verdes-Montenegro et al., 2001)., and (92) or normal (42) groups.
Because the gas is not in hydrostatic equilibrium (as indicated by the diffuse X-ray morphology; see §4.1), and in many cases linked to the individual group members rather than the environment, we cannot use the temperature to calculate the group hot gas mass (such a procedure assumes hydrostatic equilibrium in three dimensions). However, if we did assume that the gas is in hydrostatic equilibrium, then the narrow range of temperatures implies a similarly narrow range of masses (Fabricant et al., 1980). The X-ray contours in Figure 1 make this unconvincing due to the extremely large number densities and/or metal abundances necessary to make the hot gas masses of groups such as HCG 16 similar to ones such as HCGs 90 or 62. If we instead hypothesize that the X-ray gas mass is proportional to the bolometric X-ray luminosity, i.e., that there exists a relation for groups (as in Zhang et al. 2011 for clusters), then we can compare the relative X-ray luminosities of the groups as a proxy for their relative hot gas masses. That the X-ray fainter groups for a given H i mass ratio are deficient in H i and that all of the CGs have similar X-ray temperatures suggests two scenarios: either (1) additional X-ray gas has too low surface brightness to detect in the available data, or (2) some fraction of it is missing from the groups. If the H i was not converted to hot gas, then where is the missing gas in compact groups? The least massive groups in our sample have velocity dispersions that correspond to virial temperatures of only 0.08 keV, however if the gas is cooler than the virial theorem implies, then it may be in the form of a diffuse UV intragroup medium. Further data are required to fully explore this phenomenon.
4.4 Diffuse X-ray Emission and Specific Star Formation Rates
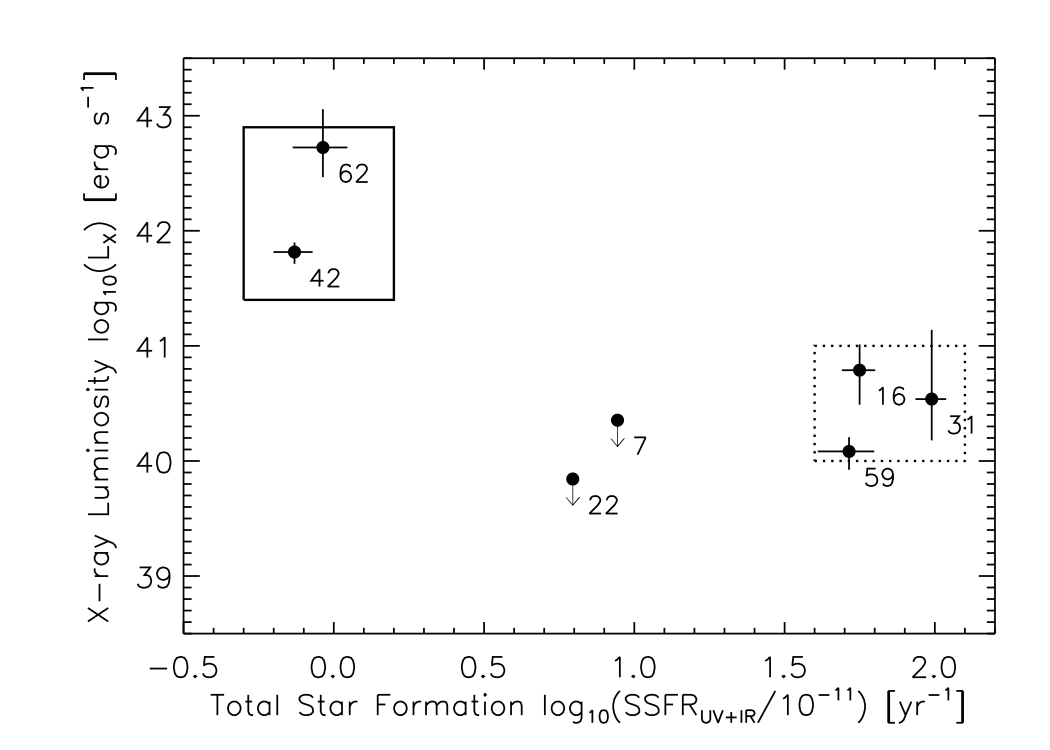
We also compare the X-ray emission of seven groups in our sample to the total group SSFRs for the main group members calculated from the UV+24 m fluxes measured by Tzanavaris et al. (2010) with corrections from Tzanavaris (2012, private communication) in Figure 7, and find that there is a distinction in for detected groups on either side of the SSFR gap (data are not available for HCGs 90 and 92). We exclude dwarf group members with measured SSFRs because HCG 31 is the only CG in our sample that has such measurements of its dwarf population, which increases the total group SSFR by several orders of magnitude due to the combination of relatively low to moderate SFRs and small stellar masses in star-forming dwarf galaxies. In our sample, CGs containing star-forming galaxies all share similar X-ray luminosities and are 1–2 orders of magnitude fainter than groups with low total SSFRs. This may indicate an “X-ray gap” analogous to the SSFR and mid-IR color gaps found by Tzanavaris et al. 2010 and Walker et al. 2010, 2012. We note that HCGs 7 and 22 have SSFRs that lie within the gap range of yr-1, and neither has any detected diffuse X-ray emission.
The brighter values associated with the low SSFR groups are due to the advanced evolutionary stage of these environments. HCGs 42 and 62 have very low H i to dynamical-mass ratios, while simultaneously their relatively massive galaxies are entirely E/S0 types. From the evolutionary scenario presented by Verdes-Montenegro et al. (2001), and the fact that compact environments are favorable to the tidal stripping of gas from galaxies (Freeland et al., 2009), we should expect that these older compact groups have removed the cool gas from the galaxies and heated it in the intragroup medium. Conversely, the star-forming groups HCGs 16, 31, and 59 have relatively faint X-ray emission associated with them. These groups also all exhibit only galaxy-linked emission, as expected from their relatively young evolutionary states. Finally, neither of the intermediate SSFR groups, HCGs 7 and 22, are detected by Chandra. From the figure, we find that there are two possible evolutionary scenarios with respect to the total group SSFR: (1) the groups move from the lower right portion of Figure 7 to the upper left, i.e., star-forming and X-ray fainter to quiescent and X-ray brighter, though perhaps not monotonically; or (2) there exists at least one more evolutionary track in which star formation in CG galaxies declines while gas is not stripped from the disks and/or heated. In particular, studies of groups similar to HCGs 7 and 22 may provide further insight.
5 Summary
We detect diffuse X-ray emission in seven of nine of the CGs in our sample with temperatures ranging from 0.6–0.72 keV and bolometric X-ray luminosities between and erg s-1. The groups exhibit a wide range of velocity dispersions (56–343 km s-1), (0.70–0.97), and morphological fractions from spiral-only groups to systems rich with E/S0 galaxies.
Based on the hot gas morphologies, we find that the X-ray emission likely arises due to both local processes (i.e. star formation, nuclear activity, and tidal interactions) and global processes (i.e., heating by the group potential). In dynamically unevolved (i.e., low-mass, low velocity dispersion) systems, the observable diffuse X-ray emission is dominated by local processes. The X-ray brighter groups (for a given H i mass ratio) have emission that stems from both an extended diffuse component (i.e., a true intragroup medium) and galaxy-linked emission, while emission detected in the X-ray fainter groups is only associated with the individual galaxies.
HCGs 31, 42, 59, and 92 have X-ray luminosities in agreement with the predicted values from the scaling relation from clusters, though the error in the temperatures of HCGs 31 and 59 are large. Furthermore, HCGs 16 and 31 agree with the relation. In both and , HCG 62 appears to lie within the scatter of the cluster data and is similar to fainter clusters. The agreement between HCGs 16 and 31 with the relation are likely coincidental because the scaling relation is predicted from the Virial theorem (i.e., ), and the X-ray emission from these two systems is clearly dominated by star formation rather than virilization. When the groups disagree with the cluster scaling relations, particularly in space, this indicates that the groups are not simply scaled-down analogs to galaxy clusters. Furthermore, given that the hot gas in the low-mass (i.e., low velocity dispersion) systems is found to be isolated to the group members rather than throughout the intragroup medium, we conclude that galaxy clusters are not a proper comparison class of objects for these groups (noting the possible exception of HCG 62).
We also find that there may be a relationship between and how the H i gas is distributed: preliminary evidence suggests that CGs with gas stripped from the galaxies are brighter in X-rays than groups with H i confined to the members, possibly due to strong multi-galaxy interactions that dispersed neutral gas into the intragroup medium and triggered star formation. However, the X-ray faintest groups are also more heavily deficient in H i implying that there may be some fraction of missing gas, possibly too cool to emit in X-rays or with too low surface brightness to detect. Finally, we note that groups dominated by local heating mechanisms have high UV+24 m specific star formation rates, while groups with gas heated by the group potential have low SSFRs. The values of between these two categories spans 2 orders of magnitude and may indicate the presence of an “X-ray gap” in CGs similar to the SSFR and mid-IR color gaps found by Tzanavaris et al. (2010) and Walker et al. (2010, 2012).
The faintest groups appear to be at very early stages in their evolution, perhaps coming together for the first time as is indicated by their low fractions of E/S0 galaxies. The influence of multi-galaxy interactions on liberating neutral gas from the galaxies and depositing it into the intragroup medium early in the group lifetime (e.g., as seen in HCG 16) appears to have an effect on the ability of these groups to evolve into more cluster-like systems with respect to the hot gas distribution (e.g., HCG 62).
5.1 Future Work
Expanding the sample with appropriate observations of groups from the Chandra and XMM-Newton archives is the logical next step. This will give us a larger sample with which to study the relation between the hot gas and the evolution of group environment (e.g., how the X-ray luminosity varies with H i mass ratio). Furthermore, continuing to examine the differences between compact, loose, and fossil groups will demonstrate how efficient the compact environment processes gas. Inclusion of multiwavelength data will help to facilitate comparison of the hot gas to gas in cooler states (e.g., cold molecular). HCG 16 in particular is an interesting group worth more study; the presence of two potential M82-like superwinds in a single system presents an interesting case study for tidally induced star formation and how superwinds drive hot gas into the intragroup medium.
Appendix A Notes on Individual Groups
In addition to the unique aspects of the X-ray analysis and properties of the diffuse emission, we also list the center RA and Dec, shape, and dimensions of the extraction region for each group.
HCG 7.—Diffuse emission in this group was not detected above the background in the Chandra data. The circular extraction region with radius 39 was centered at RA = 00h39m23s.9 and Dec = +00∘ 52 15 4.
HCG 16.—The shallow observation of this group prevented detection of a true intragroup medium (i.e., the erg s-1 IGM, corrected to our cosmology, found by Belsole et al. 2003 with 45 ks of XMM data); however, hot gas associated with the individual galaxy members was detected. The extracted spectrum corresponds to the area surrounding galaxies A, B, C, and D, but does not include galaxy X, which is far removed from the group center and located far from the S3 aimpoint of the observation. The rectangular 7237 extraction region was centered at RA = 02h09m33s.0 and Dec = –10∘ 09 05 8 with PA = 36∘.
HCG 22.—Diffuse emission in this group was not detected above the background in the Chandra data. The rectangular 6569 extraction region was centered at RA = 03h03m30s.1 and Dec = –15∘ 39 27 3 with PA = 22∘. We note that this region includes a background pair of galaxies to the southeast of the main group members, however any emission from this pair is negligible and does not adversely effect the upper limit on the X-ray luminosity of HCG 22.
HCG 31.—The S/N of the detection is only marginally above the threshold required for a detection (S/N), and therefore the properties of the hot gas in this system are poorly constrained. However, this is the first detection of diffuse X-ray emission in this group. The extraction region covers the massive group members and the southern tidal tail where the majority of star formation is occurring within the group (Gallagher et al., 2010). Based on the reservoir of H i gas in the group, Gallagher et al. (2010) predicted that conversion of 75% of the neutral gas into stellar mass over a 150 Myr episode of star formation would generate erg s-1 of X-ray emission, however this is an order of magnitude below the observed value of from the Chandra data. The elliptical 2113 extraction region was centered at RA = 05h01m39s.7 and Dec = –04∘ 16 15 8 with PA = 44∘.
HCG 42.—We extracted spectra from both the region around galaxy A, where the diffuse X-ray emission is most readily apparent, and from a region containing all of the massive group members. However, the count rates obtained from both extraction regions were consistent within errors. Therefore, we find that the majority of the X-ray emission in the system is associated with galaxy A. To ensure that we do not exclude any extended emission, we compare our value with that derived from ROSAT PSPC data using the extended radius of the X-ray emission from Mulchaey & Zabludoff (1998). This radius corresponds to the distance at which the X-ray emission falls to 20% of its peak value; in HCG 42, this radius is 8′. Comparison with the flux extracted from the ROSAT data shows that our value of the flux within our extraction region matches that obtained with an 8′ radius. The circular extraction region with radius 34 was centered at RA = 10h00m21s.0 and Dec = –19∘ 38 48 5.
HCG 59.—As for HCG 31, the X-ray emission from this group is extremely weak; however, the S/N is sufficient to classify this group as a detection. Due to the low S/N, the values derived from model fits to the extracted spectra are poorly constrained. Though it is unlikely that the value of the temperature could span two orders of magnitude (as indicated by the upper 90% confidence error estimate), we include this error in subsequent figures for consistency. The 392 elliptical extraction region was centered at RA = 11h48m26s.5 and Dec = 12∘ 43 10 2 with PA = 0.3∘.
HCG 62.—Previous work has found that there are cavities in the X-ray emission around HCG 62 (the result of AGN jets and lobes due to the Seyfert 2 nucleus in galaxy A) that lack high frequency radio emission, but do have powerful low frequency emission (Dong et al., 2010; Gitti et al., 2010; Giacintucci et al., 2011; O’Sullivan et al., 2011). The extraction region does not include galaxy D, which is far to the south with respect to the other group members, and has negligible X-ray emission. During model fitting, we found that a model with a single MEKAL component was insufficient to properly fit the observed spectrum, therefore we model this group with two separate plasmas. We note that Mulchaey & Zabludoff (1998) found that the diffuse emission extends much farther from the group center than is evident in the Chandra data, and well beyond the FOV of the ACIS CCDs. Using the extended X-ray emission radius of 242 from Mulchaey & Zabludoff (1998), we found that our measured absorbed flux was a factor of 3.1 lower than that found from the ROSAT PSPC data and thus correct our measurements by this amount. Note that we apply this correction to both components of the emission in addition to the total luminosity, therefore the luminosities of the hot and cold component should be considered upper limits. In Figure 3, we separately plot both the cooler and hotter components. The circular extraction region with radius 15 was centered at RA = 12h53m06s.0 and Dec = –09∘ 12 11 6.
HCG 90.—The spectral extraction region for this group is centered on galaxies B, C, and D that are currently interacting with one another and are embedded within a halo of diffuse optical light (White et al., 2003). The region excludes the brightest member (90A), which is located 69 (68 kpc) from the other three massive, interacting group members and contains a powerful Seyfert 2 nucleus. This bright AGN complicates analysis of the diffuse emission with bright readout streaks and substantial pileup on the I3 CCD. The 5341 elliptical extraction region was centered at RA = 22h02m04s.5 and Dec = –31∘ 58 51 9 with PA = 100∘.
HCG 92.—The known primary source of heating for the hot gas is a shock front caused by the high velocity intruder galaxy NGC 7318B as it moves at 850 km s-1 through the intragroup medium (Pietsch et al., 1997). Numerous interactions have occurred in the group in the past 500 Myr leading to tidal tails and debris (e.g., Fedotov et al. 2011; Hwang et al. 2012). These frequent interactions in the group likely caused gas to be stripped from the member galaxies and be deposited into the intragroup medium (Moles et al., 1997; Guillard et al., 2012). We note that the presence of the shock in the intragroup medium could have non-thermal X-ray emission that is not included in the MEKAL model fit. The circular extraction region with radius 25 was centered at RA = 22h35m59s.5 and Dec = 33∘ 58 03 2.
References
- Akritas & Bershady (1996) Akritas, M. G., & Bershady, M. A. 1996, ApJ, 470, 706
- Anders & Grevesse (1989) Anders, E., & Grevesse, N. 1989, Geochim. Cosmochim. Acta, 53, 197
- Arnaud (1996) Arnaud, K. A. 1996, in Astronomical Society of the Pacific Conference Series, Vol. 101, Astronomical Data Analysis Software and Systems V, ed. G. H. Jacoby & J. Barnes, 17
- Arnaud & Raymond (1992) Arnaud, M., & Raymond, J. 1992, ApJ, 398, 394
- Arnaud & Rothenflug (1985) Arnaud, M., & Rothenflug, R. 1985, A&AS, 60, 425
- Belsole et al. (2003) Belsole, E., Sauvageot, J.-L., Ponman, T. J., & Bourdin, H. 2003, A&A, 398, 1
- Borthakur et al. (2010) Borthakur, S., Yun, M. S., & Verdes-Montenegro, L. 2010, ApJ, 710, 385
- Broos et al. (2010) Broos, P. S., Townsley, L. K., Feigelson, E. D., et al. 2010, ApJ, 714, 1582
- Chartas et al. (2002) Chartas, G., Gupta, V., Garmire, G., et al. 2002, ApJ, 565, 96
- da Costa et al. (1998) da Costa, L. N., Willmer, C. N. A., Pellegrini, P. S., et al. 1998, AJ, 116, 1
- de Carvalho et al. (1997) de Carvalho, R. R., Ribeiro, A. L. B., Capelato, H. V., & Zepf, S. E. 1997, ApJS, 110, 1
- de Vaucouleurs et al. (1991) de Vaucouleurs, G., de Vaucouleurs, A., Corwin, Jr., H. G., et al. 1991, Third Reference Catalogue of Bright Galaxies. Volume I: Explanations and references. Volume II: Data for galaxies between 0h and 12h. Volume III: Data for galaxies between 12h and 24h. (Springer-Verlag)
- dell’Antonio et al. (1994) dell’Antonio, I. P., Geller, M. J., & Fabricant, D. G. 1994, AJ, 107, 427
- Diaferio et al. (1994) Diaferio, A., Geller, M. J., & Ramella, M. 1994, AJ, 107, 868
- Dong et al. (2010) Dong, R., Rasmussen, J., & Mulchaey, J. S. 2010, ApJ, 712, 883
- Fabricant et al. (1980) Fabricant, D., Lecar, M., & Gorenstein, P. 1980, ApJ, 241, 552
- Falco et al. (1999) Falco, E. E., Kurtz, M. J., Geller, M. J., et al. 1999, PASP, 111, 438
- Fedotov et al. (2011) Fedotov, K., Gallagher, S. C., Konstantopoulos, I. S., et al. 2011, AJ, 142, 42
- Fixsen et al. (1996) Fixsen, D. J., Cheng, E. S., Gales, J. M., et al. 1996, ApJ, 473, 576
- Freeland et al. (2009) Freeland, E., Stilp, A., & Wilcots, E. 2009, AJ, 138, 295
- Freeman et al. (2002) Freeman, P. E., Kashyap, V., Rosner, R., & Lamb, D. Q. 2002, ApJS, 138, 185
- Gallagher et al. (2001) Gallagher, S. C., Charlton, J. C., Hunsberger, S. D., Zaritsky, D., & Whitmore, B. C. 2001, AJ, 122, 163
- Gallagher et al. (2010) Gallagher, S. C., Durrell, P. R., Elmegreen, D. M., et al. 2010, AJ, 139, 545
- Giacintucci et al. (2011) Giacintucci, S., O’Sullivan, E., Vrtilek, J., et al. 2011, ApJ, 732, 95
- Gitti et al. (2010) Gitti, M., O’Sullivan, E., Giacintucci, S., et al. 2010, ApJ, 714, 758
- Gottesman & Weliachew (1977) Gottesman, S. T., & Weliachew, L. 1977, ApJ, 211, 47
- Guillard et al. (2012) Guillard, P., Boulanger, F., Pineau des Forêts, G., et al. 2012, ApJ, in press
- Harrison et al. (2012) Harrison, C. D., Miller, C. J., Richards, J. W., et al. 2012, ApJ, 752, 12
- Haynes & Giovanelli (1984) Haynes, M. P., & Giovanelli, R. 1984, AJ, 89, 758
- Helsdon & Ponman (2000) Helsdon, S. F., & Ponman, T. J. 2000, MNRAS, 315, 356
- Helsdon et al. (2001) Helsdon, S. F., Ponman, T. J., O’Sullivan, E., & Forbes, D. A. 2001, MNRAS, 325, 693
- Hickox & Markevitch (2006) Hickox, R. C., & Markevitch, M. 2006, ApJ, 645, 95
- Hickson (1982) Hickson, P. 1982, ApJ, 255, 382
- Hickson et al. (1992) Hickson, P., Mendes de Oliveira, C., Huchra, J. P., & Palumbo, G. G. 1992, ApJ, 399, 353
- Huchra et al. (1993) Huchra, J., Latham, D. W., da Costa, L. N., Pellegrini, P. S., & Willmer, C. N. A. 1993, AJ, 105, 1637
- Huchtmeier (1994) Huchtmeier, W. K. 1994, A&A, 286, 389
- Huchtmeier (1997) —. 1997, A&A, 325, 473
- Hwang et al. (2012) Hwang, J.-S., Struck, C., Renaud, F., & Appleton, P. N. 2012, MNRAS, 419, 1780
- Isobe et al. (1986) Isobe, T., Feigelson, E. D., & Nelson, P. I. 1986, ApJ, 306, 490
- Jeltema et al. (2008) Jeltema, T. E., Binder, B., & Mulchaey, J. S. 2008, ApJ, 679, 1162
- Johnson et al. (2007) Johnson, K. E., Hibbard, J. E., Gallagher, S. C., et al. 2007, AJ, 134, 1522
- Jones et al. (2009) Jones, D. H., Read, M. A., Saunders, W., et al. 2009, MNRAS, 399, 683
- Jones et al. (2003) Jones, L. R., Ponman, T. J., Horton, A., et al. 2003, MNRAS, 343, 627
- Kaastra (1992) Kaastra, J. S. 1992, An X-Ray Spectral Code for Optically Thin Plasmas, Internal SRON-Leiden Report dd. 1992-12-03
- Kaastra (1993) —. 1993, Legacy, 3, 16
- Kaastra & Liedahl (1995) Kaastra, J. S., & Liedahl, D. A. 1995, Legacy, 6, 16
- Kalberla et al. (2005) Kalberla, P. M. W., Burton, W. B., Hartmann, D., et al. 2005, A&A, 440, 775
- Karachentsev (2005) Karachentsev, I. D. 2005, AJ, 129, 178
- Kereš et al. (2005) Kereš, D., Katz, N., Weinberg, D. H., & Davé, R. 2005, MNRAS, 363, 2
- Khosroshahi et al. (2007) Khosroshahi, H. G., Ponman, T. J., & Jones, L. R. 2007, MNRAS, 377, 595
- Konstantopoulos et al. (2009) Konstantopoulos, I. S., Bastian, N., Smith, L. J., et al. 2009, ApJ, 701, 1015
- Konstantopoulos et al. (2010) Konstantopoulos, I. S., Gallagher, S. C., Fedotov, K., et al. 2010, ApJ, 723, 197
- Konstantopoulos et al. (2012) —. 2012, ApJ, 745, 30
- Lavalley et al. (1992) Lavalley, M. P., Isobe, T., & Feigelson, E. D. 1992, in Bulletin of the American Astronomical Society, Vol. 24, Bulletin of the American Astronomical Society, 839–840
- Liedahl et al. (1995) Liedahl, D. A., Osterheld, A. L., & Goldstein, W. H. 1995, ApJ, 438, L115
- Lodders (2003) Lodders, K. 2003, ApJ, 591, 1220
- Mamon (1986) Mamon, G. A. 1986, ApJ, 307, 426
- Mendel et al. (2011) Mendel, J. T., Ellison, S. L., Simard, L., Patton, D. R., & McConnachie, A. W. 2011, MNRAS, 418, 1409
- Mendes de Oliveira et al. (2005) Mendes de Oliveira, C., Coelho, P., González, J. J., & Barbuy, B. 2005, AJ, 130, 55
- Mendes de Oliveira et al. (1998) Mendes de Oliveira, C., Plana, H., Amram, P., Bolte, M., & Boulesteix, J. 1998, ApJ, 507, 691
- Mendes de Oliveira et al. (2006) Mendes de Oliveira, C. L., Temporin, S., Cypriano, E. S., et al. 2006, AJ, 132, 570
- Meurer et al. (2006) Meurer, G. R., Hanish, D. J., Ferguson, H. C., et al. 2006, ApJS, 165, 307
- Mewe et al. (1985) Mewe, R., Gronenschild, E. H. B. M., & van den Oord, G. H. J. 1985, A&AS, 62, 197
- Mewe et al. (1986) Mewe, R., Lemen, J. R., & van den Oord, G. H. J. 1986, A&AS, 65, 511
- Moles et al. (1997) Moles, M., Sulentic, J. W., & Marquez, I. 1997, ApJ, 485, L69
- Monnier Ragaigne et al. (2003) Monnier Ragaigne, D., van Driel, W., Schneider, S. E., Balkowski, C., & Jarrett, T. H. 2003, A&A, 408, 465
- Mulchaey (2000) Mulchaey, J. S. 2000, ARA&A, 38, 289
- Mulchaey et al. (2003) Mulchaey, J. S., Davis, D. S., Mushotzky, R. F., & Burstein, D. 2003, ApJS, 145, 39
- Mulchaey & Zabludoff (1998) Mulchaey, J. S., & Zabludoff, A. I. 1998, ApJ, 496, 73
- Nishiura et al. (2000) Nishiura, S., Shimada, M., Ohyama, Y., Murayama, T., & Taniguchi, Y. 2000, AJ, 120, 1691
- Osmond & Ponman (2004) Osmond, J. P. F., & Ponman, T. J. 2004, MNRAS, 350, 1511
- O’Sullivan et al. (2011) O’Sullivan, E., Giacintucci, S., David, L. P., et al. 2011, ApJ, 735, 11
- O’Sullivan et al. (2009) O’Sullivan, E., Giacintucci, S., Vrtilek, J. M., Raychaudhury, S., & David, L. P. 2009, ApJ, 701, 1560
- Paturel et al. (2003) Paturel, G., Theureau, G., Bottinelli, L., et al. 2003, A&A, 412, 57
- Pietsch et al. (1997) Pietsch, W., Trinchieri, G., Arp, H., & Sulentic, J. W. 1997, A&A, 322, 89
- Ponman et al. (1996) Ponman, T. J., Bourner, P. D. J., Ebeling, H., & Böhringer, H. 1996, MNRAS, 283, 690
- Ponman et al. (1999) Ponman, T. J., Cannon, D. B., & Navarro, J. F. 1999, Nature, 397, 135
- Popesso et al. (2007) Popesso, P., Biviano, A., Böhringer, H., & Romaniello, M. 2007, A&A, 461, 397
- Rasmussen & Ponman (2009) Rasmussen, J., & Ponman, T. 2009, in Astronomical Society of the Pacific Conference Series, Vol. 419, Galaxy Evolution: Emerging Insights and Future Challenges, ed. S. Jogee, I. Marinova, L. Hao, & G. A. Blanc, 415
- Rasmussen et al. (2006) Rasmussen, J., Ponman, T. J., Mulchaey, J. S., Miles, T. A., & Raychaudhury, S. 2006, MNRAS, 373, 653
- Rasmussen et al. (2008) Rasmussen, J., Ponman, T. J., Verdes-Montenegro, L., Yun, M. S., & Borthakur, S. 2008, MNRAS, 388, 1245
- Ribeiro et al. (1996) Ribeiro, A. L. B., de Carvalho, R. R., Coziol, R., Capelato, H. V., & Zepf, S. E. 1996, ApJ, 463, L5
- Rich et al. (2010) Rich, J. A., Dopita, M. A., Kewley, L. J., & Rupke, D. S. N. 2010, ApJ, 721, 505
- Rines & Diaferio (2010) Rines, K., & Diaferio, A. 2010, AJ, 139, 580
- Small et al. (1999) Small, T. A., Ma, C.-P., Sargent, W. L. W., & Hamilton, D. 1999, ApJ, 524, 31
- Sun et al. (2009) Sun, M., Voit, G. M., Donahue, M., et al. 2009, ApJ, 693, 1142
- Tamburri et al. (2012) Tamburri, S., Trinchieri, G., Wolter, A., et al. 2012, A&A, in press
- Theureau et al. (1998) Theureau, G., Bottinelli, L., Coudreau-Durand, N., et al. 1998, A&AS, 130, 333
- Tovmassian et al. (2006) Tovmassian, H., Plionis, M., & Torres-Papaqui, J. P. 2006, A&A, 456, 839
- Trinchieri et al. (2003) Trinchieri, G., Sulentic, J., Breitschwerdt, D., & Pietsch, W. 2003, A&A, 401, 173
- Tully (1987) Tully, R. B. 1987, ApJ, 321, 280
- Tzanavaris et al. (2010) Tzanavaris, P., Hornschemeier, A. E., Gallagher, S. C., et al. 2010, ApJ, 716, 556
- Verdes-Montenegro et al. (2005) Verdes-Montenegro, L., Del Olmo, A., Yun, M. S., & Perea, J. 2005, A&A, 430, 443
- Verdes-Montenegro et al. (2001) Verdes-Montenegro, L., Yun, M. S., Williams, B. A., et al. 2001, A&A, 377, 812
- Walker et al. (2012) Walker, L. M., Johnson, K. E., Gallagher, S. C., et al. 2012, AJ, 143, 69
- Walker et al. (2010) —. 2010, AJ, 140, 1254
- White et al. (2003) White, P. M., Bothun, G., Guerrero, M. A., West, M. J., & Barkhouse, W. A. 2003, ApJ, 585, 739
- Wilms et al. (2000) Wilms, J., Allen, A., & McCray, R. 2000, ApJ, 542, 914
- Wu et al. (1999) Wu, X.-P., Xue, Y.-J., & Fang, L.-Z. 1999, ApJ, 524, 22
- Zabludoff & Mulchaey (1998) Zabludoff, A. I., & Mulchaey, J. S. 1998, ApJ, 496, 39
- Zabludoff & Mulchaey (2000) —. 2000, ApJ, 539, 136
- Zhang et al. (2011) Zhang, Y.-Y., Andernach, H., Caretta, C. A., et al. 2011, A&A, 526, A105