Biophysical properties and computational modeling of calcium spikes in serotonergic neurons
of the dorsal raphe nucleus
Henry C. Tuckwell†
1 Max Planck Institute for Mathematics in the Sciences
Inselstr. 22, 04103 Leipzig, Germany
† Correspondence: tuckwell@mis.mpg.de
Abstract
Serotonergic neurons of the dorsal raphe nuclei, with their extensive innervation of nearly the whole brain have important modulatory effects on many cognitive and physiological processes. They play important roles in clinical depression and other psychiatric disorders. In order to quantify the effects of serotonergic transmission on target cells it is desirable to construct computational models and to this end these it is necessary to have details of the biophysical and spike properties of the serotonergic neurons. Here several basic properties are reviewed with data from several studies since the 1960s to the present. The quantities included are input resistance, resting membrane potential, membrane time constant, firing rate, spike duration, spike and afterhyperpolarization (AHP) amplitude, spike threshold, cell capacitance, soma and somadendritic areas. The action potentials of these cells are normally triggered by a combination of sodium and calcium currents which may result in autonomous pacemaker activity. We here analyse the mechanisms of high-threshold calcium spikes which have been demonstrated in these cells the presence of TTX. The parameters for calcium dynamics required to give calcium spikes are quite different from those for regular spiking which suggests the involvement of restricted parts of the soma-dendritic surface as has been found, for example, in hippocampal neurons.
Abbreviations: DRN SE, dorsal raphe nucleus, serotonergic.
Keywords: Serotonin; dorsal raphe nucleus; computational model; spikes.
1 Introduction
The spiking activity of neurons in the dorsal raphe nucleus has been studied experimentally for many years (Aghajanian and Haigler, 1974; Baraban and Aghajanian, 1980) with particular emphasis on pacemaker-like firing. Serotonergic neurons in the dorsal and other raphe nuclei, innervate many brain regions and influence many cognitive, emotional and physiological processes. They have been implicated in the pathophysiology of major depressive and other stress-related psychiatric disorders. The therapeutical effects of selective serotonin re-uptake inhibitors indicates the key role of serotonin in depression.
The involvement of serotonergic neurons arises through a variety of physiological, neurophysiological and endocrine processes. Included in the targets of serotonergic neurons of the DRN are the hippocampus, amygdala, locus coeruleus, prefrontal cortex (PFC) and the paraventricular nucleus of the hypothalamus. Serotonergic input from the raphe into the hippocampus is important for regulating hippocampal neurogenesis (Balu and Lucki, 2009). Bambico et al. (2009) found changes in spontaneous 5-HT neuron single-spike firing activity after chronic uncontrollable stress, and changes in the number of spontaneously-active 5-HT neurons.
There are many excellent reviews of the properties of these cells including, in chronological order, Jacobs and Fornal (1995), Azmitia and Whitaker-Azmitia (1995), Aghajanian and Sanders-Bush (2002), Lanfumey et al. (2005), Lowry et al. (2008), Calizo et al. (2011), Del Cid-Pellitero and Garzón (2011), Hale and Lowry (2011), Hayes and Greenshaw (2011), Sakai (2011), Maximino (2012) and Savli et al. (2012). It is manifest that the spiking activity of the DRN SE neurons is of prime importance in maintaining serotonin levels throughout the brain. In this article our focus is on the a quantitative modeling of this activity which is considered essential in order to understand the factors which control serotonin release and subsequent effects on target cells.
2 Biophysical and electrophysiological properties of DRN SE neurons
In this section we tabulate findings on many of the biophysical, anatomical and electrophysiological properties of DRN SE neurons, as these properties are important in the construction and verification of computational models.
2.1 Input resistance
| Location | Input resistance (M) | Reference (1st au), remarks |
|---|---|---|
| DRN, rat | Range 30-76 | Aghajanian (1982) |
| DRN, rat | 190 13 | Crunelli (1983) |
| DRN, rat | Ave, 94; range 40-230 | Vandermaelen (1983) |
| DRN rat | 150-400 | Aghajanian (1984), slice, CH |
| DRN, rat | Range 200-400 | Aghajanian (1985) |
| DRN, rat | Ave, 143, Range 60-300 | Segal (1985) |
| DRN, rat | Ave, 143, Range 150-400 | Burlhis (1987) |
| NRM, rat | 186 9 | Pan (1990) |
| NRM, g pig | 255 50 | Pan (1990) |
| DRN, rat | 74 32 | Hájós (1996), non bursting |
| DRN, rat | 86 33 | Hájós (1996), bursting |
| CRN, rat | 1600 200 | Bayliss (1997) |
| DRN, rat | 175 23 | Li (2001) |
| DRN, rat | 230.1 8.8 | Liu (2002) |
| DRN, rat | 241.5 29.2 | Kirby et al., (2003) |
| DRN, MRN rat | 637 32, 688 35 | Beck (2004) |
| DRN, rat | 252 20 | Scuveé-Moreau (2004) |
| DRN, rat | 234 2.5 | Liu (2005) |
| DRN, mouse | 427.7 to 580.9 | Macri (2006), WT and KO, 3 types |
| vmDRN, mouse | 432.4 34.9 | Crawford (2010) |
| lwDRN, mouse | 592.0 70.2 | Crawford (2010) |
| DRN, rat | 223.8 5.4 | Ogaya (2011) |
| vmDRN, rat | 600 | Calizo (2011) |
| lwDRN, rat | 500 | Calizo (2011) |
| dmDRN, rat | 550 | Calizo (2011) |
| MRN, rat | 750 | Calizo (2011) |
2.2 Resting membrane potential
| Location | in mV | Reference (1st au), remarks |
|---|---|---|
| DRN, rat | -57.7 1.1 | Crunelli (1983) |
| DRN, rat | -59 2.9 | Segal (1985) |
| DRN, rat | -65 | Freedman (1987), 1 cell |
| DRN, rat | -60 | Williams (1988) |
| NRM, rat | -75 to -50 | Pan (1990) |
| NRM, g pig | -70 to -52 | Pan (1990) |
| DRN, rat | Approx -60 | Penington (1991) dissoc. cell |
| DRN, rat | -65 | Pan (1994), 1 cell |
| CRN, rat | -49.7 1.0 | Bayliss et al. (1997) |
| DRN, rat | -68 13 | Li (2001) |
| DRN, rat | -62.4 1.4 | Liu (2002) |
| DRN, rat | -67.8 1.4 | Kirby (2003) |
| DRN, rat | 63.0 1.7 | Beck (2004) |
| MRN, rat | 66.0 1.6 | Beck (2004) |
| DRN, mouse | -55.3 to -54.6 | Macri (2006), WT and KO, 3 types |
| vmDRN, mouse | -66.2 2.1 | Crawford (2010) |
| lwDRN, mouse | -63.3 1.9 | Crawford (2010) |
| vmDRN, rat | -64.5 | Calizo (2011) |
| lwDRN, rat | -70 | Calizo (2011) |
| dmDRN, rat | -75 | Calizo (2011) |
| MRN, rat | -64.5 | Calizo (2011) |
2.3 Membrane time constant
| Location | in ms | Reference (1st au), remarks |
|---|---|---|
| DRN, rat | 25.6 | Crunelli (1983), one cell |
| DRN, rat | 20 to 39 | Segal (1985) |
| CRN, rat | 42.6 | Bayliss (1997), estimated from and C |
| DRN, rat | 7.4 1.4 | Li (2001) |
| DRN, rat | 21.7 | Liu (2002), estimated from Figure 1A |
| DRN, rat | 21.4 4.4 | Kirby (2003) |
| DRN, rat | 51 3.0 | Beck (2004) |
| MRN, rat | 44 2.2 | Beck (2004) |
| DRN, mouse | 13.9 to 19.5 0.5 | Macri (2006), WT and KO, 3 types |
| vmDRN, mouse | 23.4 1.9 | Crawford (2010) |
| lwDRN, mouse | 30.6 2.4 | Crawford (2010) |
| vmDRN, rat | 49.9 | Calizo (2011) |
| lwDRN, rat | 53.5 | Calizo (2011) |
| dmDRN, rat | 49.3 | Calizo (2011) |
| MRN, rat | 43.8 | Calizo (2011) |
2.4 Firing rate
| Location | Firing rate (Hz) | Reference (1st au), remarks |
|---|---|---|
| DRN rat | 0.33-0.67 | Aghajanian (1968), in vivo, CH |
| DRN rat | 1-2 | Sheard (1972), CH, large reduction with amitriptyline |
| DRN rat | 0.5-2 | Aghajanian (1974), inhibited by LSD |
| DRN rat | 1.3 (mean, 46 units) | Mosko (1974) CH |
| 0.68-1 (10), 1.01-2 (14), (10) | ||
| DRN rat | 0.5-2.5 | Gallager (1976), CH |
| DRN cat | 0.5-5 | McGinty (1976), in vivo, quiet waking, Exc Histos. |
| W 2.4 , SWS 1.3 , REM 0.2 | ||
| DRN rat | 0.8-2.5 | Mosko (1976), slice. Histograms of ISIs |
| DRN rat | 0.25-2 | Aghajanian (1978), CH, suppressed by sciatic n. stimulation |
| DRN cat | 2.82 | Trulson (1979), freely moving |
| DRN rat | 1.7 (1 cell) | Aghajanian (1982) CH, ceased spiking with LSD |
| DRN rat | 1.1( 1 cell) | Crunelli (1983), slice |
| DRN rat | 1-3.5 | Vandermaelen (1983), slice, PE applied |
| DRN rat | 0.5-5, mean 2 | Chu (1984), most cells inhibited by ethanol |
| DRN rat | 0.5-3 | Sprouse (1987), CH |
| DRN rat | 0.5-1.5 | Park (1987) |
| DRN, MRN rat | 0.1-3 | Hájós (1995), in vivo, CH, 270 of 372 non bursting |
| DRN rat | 1-4 | Hájós (1996), in vivo, regular (non bursting) |
| DRN rat | 1.2 (31) | Hájós, Sharp (1996), in vivo, CH, regular (non bursting) |
| 1.0 (22) | bursting, 49.2 % spikes in bursts | |
| DRN rat | 0.968 (23) | Kinney (1997), CH, control. HISTOS |
| 0.417 | clomipramine treated neonates, ’depressed’ | |
| CRN rat | 1.3 (24) | Bayliss (1997), slice |
| DRN cat | 3 | Jacobs (1999), quiet waking, less during sleep |
| stressors (acute), no change | ||
| DRN rat | 1.18 | Kirby (2000), in vivo, Halothane |
| predominantly inhibited by CRF | ||
| DRN rat | ISI 120 ms | Li (2001), slice, 0.3 nA |
| ISI 85 ms 0.4 nA; ISI 75 ms 0.5 nA | ||
| DRN rat | 1.67 (24) | Allers (2003), in vivo, range 0.37-3.0 |
| Location | Firing rate (Hz) | Reference (1st au), remarks |
|---|---|---|
| DRN rat | 0.8 (3); 0 (14) | Kirby (2003), slice, spontaneous |
| 0.4 (5) | elicited by PE | |
| DRN dog | 1.18 (19) | Wu (2004), in vivo, REM off, active waking |
| 0.32 (19) | REM off, non-REM sleep | |
| 0.07 (19) | REM off, REM sleep | |
| 1.42 (16) | REM-reduced, active waking | |
| 0.81 (16) | REM-reduced, non-REM sleep | |
| 0.57 (16) | REM-reduced, REM sleep) | |
| For other cell types see Table 2 in Wu (2004) | ||
| DRN rat | 1-5 | Waterhouse (2004) freely moving, quiet rest |
| DRN rat | 1.1 | Liu (2005), slice, PE 3 M |
| MRN rat | 0.52 (41) | Judge (2006), slice, PE 1 M, inhib by 5-HT |
| DRN rat | 1.21 (42) | Judge (2006), slice, PE 1 M, inhib by 5-HT |
| MBR rat | 5.40 (10) | Kocsis (2006), in vivo, U, during hippocampal theta |
| 4.69 (10) | non hippocampal theta | |
| DRN rat | 1.4 (10) | Hájós (2007),CH, bursting, range 0.4-4.1 |
| ISI 7.7 in bursts | 14.7 % of spikes in bursts, has HISTOS | |
| DRN rat | 0.1-3.5 | Bambico (2009), in vivo, CH, control |
| ISI Gaussian, HISTOS | ||
| Decreased 35.4% | CUS group (101), ISI bimodal, more bursts | |
| vmDRN mouse | 1.1 (7) | Crawford (2010), slice, PE 1 M |
| lwDRN mouse | 2.2 (6) | Crawford (2010), slice, PE 1 M |
| DRN rat | 2.1 (8) regular | Schweimer (2010), in vivo, isoflurane, U |
| some excited by footshock, some no change | ||
| 1.5 (11) bursting | some excited, some no change, some inhibited by FS |
2.5 Spike duration
There have been many recordings of spiking activity in serotonergic neurons of the DRN and other raphe nuclei. A distinguishing feature of spikes in such neurons is their long duration, usually taken to mean with magnitude equal or greater than about 2 ms. Other cells in the DRN, principally presumed to be inhibitory GABA-ergic neurons, have characteristically shorter spike durations, around 1 ms (Liu et al, 2002; Liu et al, 2005). Some early recordings did not give spike durations (Trulson and Jacobs, 1979; Crunelli et al, 1983; Aghajanian 1985; Segal, 1985) and several more recent data on spike durations have been obtained for extracellular recordings (Allers and Sharp, 2003; Waterhouse et al., 2004; Kocsis et al., 2006; Urbain et al. 2006; Nakamura et al. 2008; Schweimer and Ungless, 2010; Sakai, 2011). There are also data for embryonic or neonatal animals (Li and Bayliss, 1998; Moruzzi et al., 2009). Representative results for intracellular recordings are given in Table XX. These were either given explicitly or estimated (denoted by an asterisk) from figures in the manuscripts. The definition of spike duration differs from author to author and the method of evaluation has also been reported in the Table if it is available. Also stated are factors which lead to a lengthening of the spike duration such as EGTA or in some cases TTX which, presumably, leads to purely calcium spikes. Temperature also influences spike duration as noted in the original work of Hodgkin and Huxley (1952). In experiments where the temperature was not at room temperature (20-25∘C) the temperature is included in the Table entry.
| Location | Duration (ms) | Reference (1st au), remarks |
|---|---|---|
| DRN, rat | 2.9∗ | Park (1982), at -50 mV, antidromic |
| DRN, rat | 2 | Aghajanian (1982), 35-37∘C |
| DRN rat | 2 | Aghajanian (1984), slice, CH |
| NRM, rat & g pig | 1.5 | Pan (1990), at threshold, 37∘C |
| DRN, rat | 10∗ | Penington (1991), TTX, EGTA 10mM, Dissoc cell |
| DRN, rat | 3.3∗ | Penington (1992), at -50 mV, EGTA 11 mM, Dissoc cell |
| DRN, rat | 1.25 0.16 | Hájós (1996), at half amplitude |
| CRN, rat | 5.5 | Bayliss (1997), at half amplitude, EGTA 0.2 mM |
| DRN, rat | 3.6 1.2 | Li (2001), at base, 34-35∘C |
| DRN, rat | 0.99 0.01 | Liu (2002), at half amplitude |
| DRN, rat | 2.0 | Kirby (2003), 35∘C |
| DRN, MRN rat | 2.0,2.1 0.1 | Beck (2004), 32∘C, EGTA 0.02 mM, ventromedial DR |
| DRN, rat | 3.0 0.3 | Marinelli (2004), at threshold, 34∘C, EGTA 11 mM |
| DRN dog | 1.64 0.06 | Wu (2004), cells off during REM |
| DRN dog | 1.44 0.06 | Wu (2004), cells active when awake |
| DRN, mouse | 3.8 to 4.6 | Macri (2006), at threshold, EGTA 11 mM |
| DRN rat | 2.3 0.3 | Hájós (2007), bursting cells, range 1.4-4.0 |
| vmDRN mouse | 1.8 0.1 | Crawford (2010), at half amplitude, EGTA 0.02 mM |
| vmDRN rat | 2.1 | Calizo (2011) |
| lwDRN, rat | 2.2 | Calizo (2011) |
2.6 Spike amplitudes and AHP
The definition employed for spike amplitude varies. A natural choice is from resting potential to the peak voltage of the spike, but many authors use the difference between peak voltage and threshold. Similarly for the AHP amplitude. If the definition has been stated in the article, it is mentioned in the table. If it has been estimated from a figure then the first definition has been employed. Spike amplitude can be quite variable, one factor being dendritic morphology (Petterson and Einevoll, 2008).
| Location | Spike amplitude | AHP amplitude | Reference (1st au), remarks |
| DRN, rat | 62 to 80 | Aghajanian (1982) | |
| DRN, rat | 70 | 10 | Crunelli (1983) |
| DRN, rat | 92 | 16 | Aghajanian (1985) |
| DRN rat | 87 | 10 | Burlhis (1987) |
| DRN rat | 85 to 95 | - | Freedman (1987) |
| NRM rat | 83 | 14.2 | Pan (1990) |
| CRN rat | 74 | 13 | Bayliss (1997) |
| DRN rat | 73 | 12 | Liu (2002) |
| DRN rat | 61.4 | 15.9 | Kirby (2003) |
| DRN rat | 69 | 16 | Beck (2004), from threshold |
| MRN rat | 72 | 20 | Beck (2004), from threshold |
| DRN mouse | 66.4 to 71.7 | 19.9 to 21.4 | Macri (2006) |
| vmDRN mouse | 56.6 | 29.4 | Crawford (2010), from threshold |
| lwDRN mouse | 62.2 | 33.7 | Crawford (2010), from threshold |
| vmDRN, rat | 71.2 | 14.8 | Calizo (2011) |
| lwDRN, rat | 90 | 15.7 | Calizo (2011) |
| dmDRN, rat | 82.5 | 12.9 | Calizo (2011) |
| MRN, rat | 75 | 21.3 | Calizo (2011) |
2.7 Threshold
Voltage threshold for action potentials is that membrane potential at which the sharp depolarizing phase of a spike occurs. Such a threshold is usually around 10 mV above resting potential. Data on spike thresholds in serotonergic neurons of the DRN are sparse although there are some published results which give such quantities as around -20 mV, which makes their interpretation difficult, as resting potentials themselves are around -60 mV. The few available results which are compatible with the above definition are given in the following table.
| Source | Threshold (mV) | Remarks |
|---|---|---|
| Burlhis (1987), rat DRN | -60 | Depolarizing pre-spike potential |
| -40 | High threshold spike () | |
| Hájós (1996), rat DRN | -44 | Bursting and non-bursting cells |
| Kirby (1997) rat DRN | -54.9 | Resting potential -67.8 |
| Macri (2006), mouse DRN, type 1 | -43.6 | Resting potential -54.6 |
2.8 Estimates of capacitance
Estimates of cell capacitance can be made from measured currents in response to a given change of voltage or deduced from either anatomical (surface area) or electrophysiological measurements of input resistance and time constant.
2.8.1 Direct measurement
There have been very few reports of capacitances of DRN cells. For a dissociated rat serotonergic neuron, Penington and Fox (1995) gave a capacitance of 0.02 nF. Bayliss et al. (1997) reported a value of 26.6 0.09 pF for 32 cells in rat caudal raphe nucleus, but these cells had a very high average input resistance compared with other sets of results (see Table 1). For mouse DRN Macri et al. (2006) found capacitances between 30 and 55 pF. For 38 cells in rat DRN, Marinelli et al. (2004) obtained a capacitance of 39 3 pF. Considering the hyperpolarizing response to 0.20 nA current injection in a rat DRN cell given in Figure 1 of Liu et al. (2002), a crude estimate of the capacitance is 280 pF, which is greater than any of the values estimated from time constant and input resistance listed in Table 7.
2.8.2 Estimates from surface area
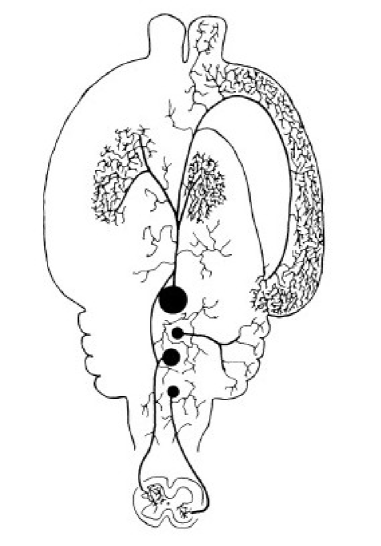
Visualizations of complete serotonergic (SE) neurons are not feasible because of their extensive axonal arborizations, but a useful schematic is shown in Figure 1 taken from Maeda et al. (1989).
There have been numerous morphological studies of the somadendritic parts of these cells (for example, Pfister and Danner, 1980; Diaz-Cintra et al., 1981; Descarries et al., 1982; Park et al., 1982; Imai et al., 1986; Park, 1987; Li et al., 2001; Allers and Sharp, 2003; Hajós et al., 2007; Calizo et al., 2011). The term “soma area” is used in various ways. In one early study of rat DRN SE neurons, Descarries et al. (1982) gave a seemingly small cell body area of 251 , but this was cross-sectional area, which is made clear by the fact that the volume was 2999 so that, assuming, as did Descarries et al., a spherical shape gives a diameter of 17.9 . Such a geometry gives a soma surface area of 1006 .
A clear image of rat DRN SE neuronal cell bodies, dendrites and proximal axonal branches appeared in Allers and Sharp (2003) and from this study the soma may be approximately considered a prolate ellipsoid. The surface area of such an ellipsoid with semi-axes of is
| (1) |
where
| (2) |
With the estimates of axes and this gives a soma area of 1375 . From the same source the dendritic surface area is estimated approximately as 2500 which gives a total SD area of 3875 .
Detailed morphological data on three kinds of cells in male rats of ages 30, 90 and 220 days were presented by Diaz-Cintra et al. (1981). Considering the results for the fusiform type (those with the largest cell bodies) in 30 day old rats leads to the area estimates in the following table TZ. Here two sets of results are given based on mean values and mean + 1 standard deviation. The soma areas are calculated assuming prolate spheroids, as in the above formula. The dendritic areas are divided into primary and secondary as in Diaz-Cintra et al. (1981), for which length and diameter at midpoint were given. Spines have not been taken into account and the calculated areas are approximate only but indicative. In Calizo et al. (2011) total dendritic lengths were given but not diameters. In the estimate of dendritic area the same decomposition given by Diaz-Cintra et al. (1981) in terms of primary and secondary dendrites as well as diameters were employed.
It can be seen that the estimated soma area, the total dendritic area and the total SD area, using the mean properties of Diaz-Cintra et al. (1981) are not far from the values estimated for the Allers and Sharp (2003) neuron. Further, using the mean + 1 standard deviation for the properties of the Diaz-Cintra et al. (1981), leads to estimates which are very similar to those for the vmDR data of Calizo et al. (2011). The range of SD areas so obtained is from about 3900 to 11600 . The fraction of total surface area which is somatic has values 0.27, 0.19, 0.35 and 0,22 with an average value of 0.26. Clearly if one used figures less than the means of Diaz-Cintra et al. (1981), the SD area would be perhaps as small as 2500 . In summary, the SD area of the serotonergic cells in the DRN has an approximate estimated mean value of 3900 , with a lower limit around 2500 and an upper limit of around 11600 .
| Quantity | Means | Means + 1SD | Allers (2003) | Calizo (2011) |
|---|---|---|---|---|
| Diaz (1981) | Diaz (1981) | vmDR | ||
| Soma area | 1073 | 2197 | 1375 | 2400 |
| Primary dendtites | 1888 | 6148 | 6083 | |
| Secondary dendrites | 953 | 3300 | 2675 | |
| SD total area | 3914 | 11645 | 3875 | 11158 |
| Fraction soma | 0.27 | 0.19 | 0.35 | 0.22 |
| Fraction dendrites | 0.73 | 0.81 | 0.65 | 0.78 |
Using the standard figure of per sq cm, the estimated area from the Allers and Sharp (2003) study would give a capacitance of about 0.039 nF. The same value is obtained from the average data, as explained above, in Diaz-Cintra et al. (1981). Using the smallest estimated area, the capacitance would be about 0.025 nF (whole cell) and using the largest area, C would be about 0.116 nF.
2.8.3 Capacitance from time constant and input resistance
One may use time constants and input resistances as given in Tables tz and fg to obtain an approximate estimate of from the formula . This can sometimes yield accurate results (Reyes et al., 1994). Using this approach gives the estimates in the following table.
| Source (1st au) | C in pF | Source (1st au) | C in pF |
|---|---|---|---|
| Crunelli, DRN rat (1983) | 135 | Macri, DRN mouse (2006) | 34 |
| Segal, DRN rat (1985) | 210 | Crawford, vmDRN mouse (2010) | 53 |
| Li, DRN rat (2001) | 40 | Crawford, lwDRN mouse (2010) | 52 |
| Liu, DRN rat (2002) | 94 | Calizo, vmDRN rat (2011) | 83 |
| Kirby, DRN rat (2003) | 87 | Calizo, lwDRN rat (2011) | 108 |
| Beck, DRN rat (2004) | 80 | Calizo, dmDRN rat (2011) | 89 |
| Beck, MRN rat (2004) | 64 | Calizo, MRN rat (2011) | 59 |
Not including the possible outlier of 206 pF, the range of these estimates in rat DRN is from 40 pF to 135 pF with an average of 89.5 pF.
2.8.4 Summary of estimates of capacitance
Table FF summarizes the various results obtained by the three different methods (Measurement, Deduction from area, ). Most of these estimates are heuristically obtained and will doubtless be superseded when more detailed measurements are made.
| Quantity | Measurement | Estimate from areas | From |
|---|---|---|---|
| Mean | 39 pF | 55 pF | 89.5 pF |
| Most likely | 39 pF | ||
| Range | 39 pF | 25-116 pF | 40-135 pF |
To construct a computational model of a ”typical” non-dissociated DRN serotonergic neuron, one might employ a capacitance of 40 pF, a total area of 4000 , and a soma area of 1000 . For modeling a larger cell, these quantities could be chosen as 90 pF, 9000 and 1800 , respectively.
3 Computational modeling of calcium spikes in TTX
In their pioneering study of the electrophysiology and ionic basis of pacemaking of presumed serotonergic neurons of the dorsal raphe nucleus, Burlhis and Aghajanian (1987) performed several “anodal break” experiments. In one of these TTX was applied to block fast sodium currents and under the application of a steady depolarizing current of 0.15 nA there were obtained spikes, called high-threshold calcium spikes. For the cell in which such spikes were depicted (see Figure 3D of Burlhis and Aghajanian, 1987), the interspike interval (ISI) was about 300 ms and the spike amplitude was about 75 mV. These data may be compared with the usual spike properties of an ISI of around 1000 ms and a spike amplitude around 90 mV. High and low threshold calcium spikes in these neurons with TTX were also demonstrated by Penington et al. (1991).
In a forthcoming article (Tuckwell and Penington, 2012) a computational model for spiking in DRN SE neurons is developed which contains 7 voltage-dependent ion currents, , a leak current, , a calcium-activated potassium current and a calcium- and voltage-activated potassium current , BK and SK denoting big and small channel conductances. The model is completed with calcium dynamics, in which there are sources due to the calcium currents as well as buffering and pumping.
The differential equation for the membrane potential can be written
| (3) |
where C is the capacitance, is the initial value of , taken to be the resting membrane potential, . and an applied current is added. Depolarizing currents are negative, all voltages are in mV, and is in ms so that if is in nA, then the membrane capacitance is in nF. For the , Hodgkin-Huxley type (1952) formulations are used generically and generally, each component current being taken as a product of activation and inactivation variables, a maximal conductance, , and a driving force which is where is usually at or near the Nernst equilibrium potential.
For noninactivating currents there is an activation variable raised to a certain power , not necessarily an integer, so that
| (4) |
If the current inactivates, then the current contains an inactivation variable which is usually raised to the power 1 so
| (5) |
For the calcium dependent currents the activation variables depend on, or also on, calcium ion concentration.
For each , activation and inactivation variables are determined by differential equations
| (6) |
| (7) |
where and are steady state values which depend on voltage. The quantities and are time constants which may also depend on voltage and/or calcium concentration. For an account of the dynamics of many types of current Destexhe and Sejnowski (2001).
The differential equation describing the evolution of the internal calcium ion concentration is similar to that employed by Rybak et al. (1997),
| (8) |
where the fraction of calcium which is bound is
| (9) |
being the dissociation constant. In (8), and are (relatively) high-threshold L-type and N-type calcium currents, CSF is a calcium source factor, F is Faraday’s constant, v is the volume of the internal shell housing internal calcium ions, is the pump strength and is the pump half-activation concentration. Concentrations are in mM.
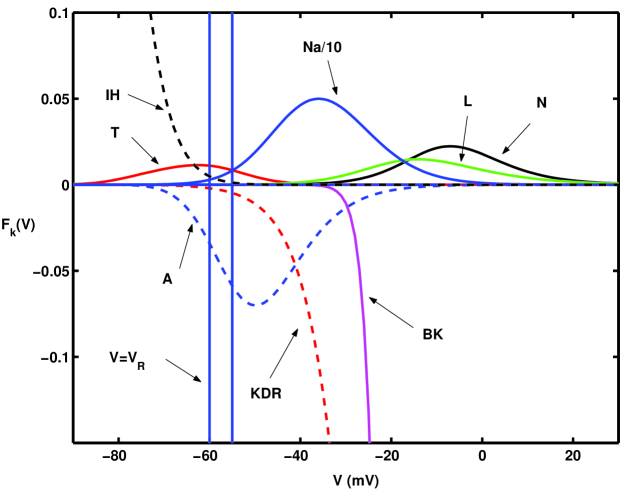
In order to ascertain approximately if a given set of parameters will result in spiking, define for each voltage-dependent channel type, ,
| (10) |
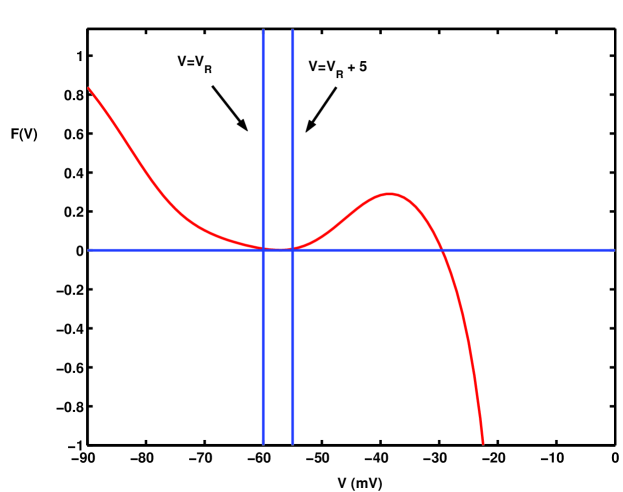
being the contribution of the -th current at steady state. Here and are the powers to which the activation and inactivation variables are raised. In all cases encountered, is either 0 (no inactivation) or 1. For the full model, including fast sodium current, with no applied current, spiking can be spontaneous and in such a case the functions are shown plotted against in Figure 2. The total source function
| (11) |
is shown in Figure 3. It can be seen that for in an interval containing the resting potential, which makes the deriviative of positive at rest, so that no stimulus is required to make the cell fire. The curve is similar to the cubic in the Fitzhugh-Nagumo model. Although is an approximate necessary condition for firing, it is not sufficient as will be seen shortly.
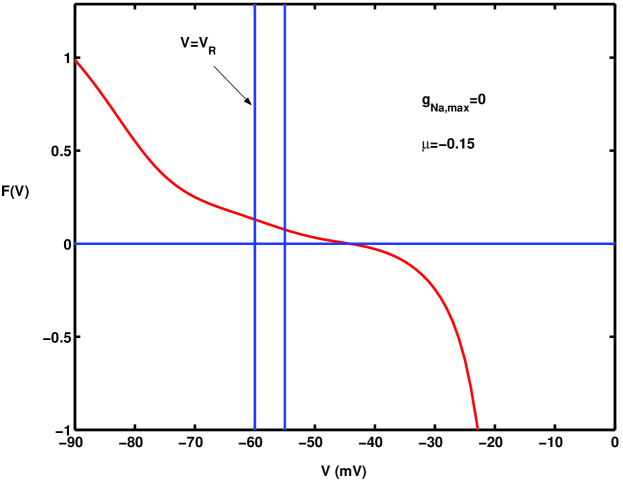
When there is no fast sodium current, as is the case when TTX is applied, and when , as in the experiment described above by Burlhis and Aghajanian (1987), the resulting function is as depicted in Figure 4. Here all the parameters of all the other component currents are the same.
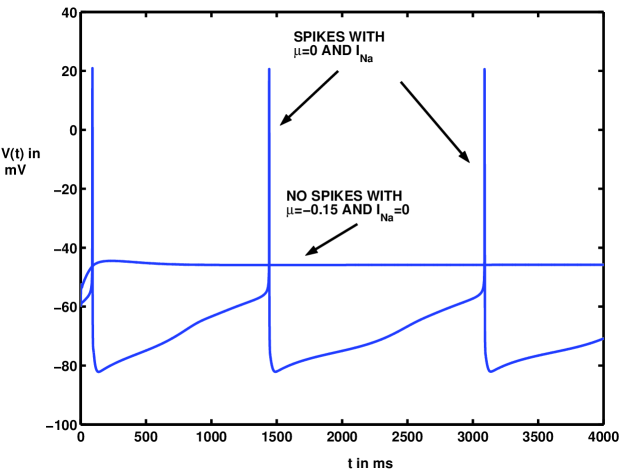
In Figure 5 are shown plots of the contrasting voltage responses versus time for the two cases of source functions depicted in Figures 3 and 4. For the case with sodium current and no applied current, the cell spontaneously fires action potentials in a pacemaker-like fashion with an ISI of about 1600 ms. In the case of no sodium current and an applied depolarizing current, it is still the case that in a large interval containing the rest point, but there are no spikes. There is a depolarization to -44.5 mV from the resting value of -60 mV, followed by a very slow decline to -45.8 mV at 4000 ms. Clearly, in order to obtain spikes (calcium spikes) for the model in the absence of fast sodium current, changes in other parameters is necessary.
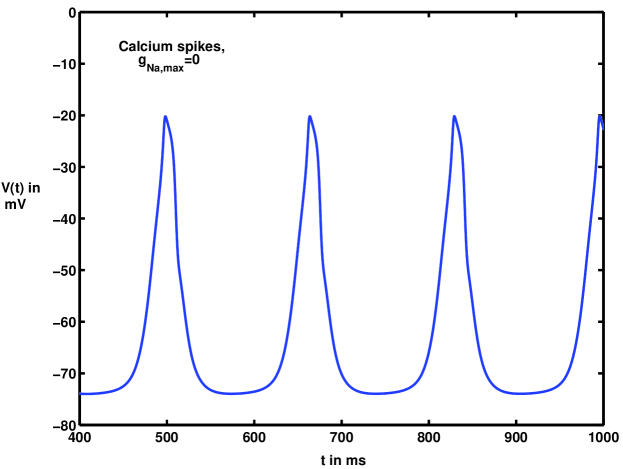
The following changes were found to give rise to calcium spikes. Since without the sodium current, the depolarizing effect of the T-type current could not lead to sufficient opening of the high-threshold N-type and/or L-type channels as they were, the steady state activation and inactivation functions of the N-type current,
| (12) |
| (13) |
were shifted by putting rather than -10 mV and rather than -45 mV. This would put the N-type current in reach of the response to the T-type current. Note that the values and had been employed in producing regular spiking in Tuckwell and Penington (2012). To increase the N-type current, its maximal conductance was increased by 50% to 0.06237 S. The steady state acivation and inactivation functions of all other component currents were unchanged. However, the maximal conductance of the T-type current was increased by a factor of 2 to =0.4505 S whereas the A-type potassium conductance was decreased by a factor of 4 to 0.1875 S. Two parameters controlling calcium dynamics required significant change. Firstly, the calcium source factor CSF was reduced to 0.135 from 0.7 and finally, an extremely large adjustment was required in the calcium pump strength by multiplying it by 30 to a value of 0.000011719 mM per ms. With these changes the calcium spikes depicted in Figure 6 were obtained with an ISI of about 170 ms and an amplitude of about 54 mV.
4 Discussion
In the first part of this article we have summarized many biophysical and physiological properties of DRN SE neurons, taken from various electrophysiological and morphological studies performed in the last 40 or so years. Such a summary is expected to be useful in the construction of computational models for these cells. These models, when they include the many neurotransmitters and neuromodulators which influence these cells, including glutamate, GABA, corticotropin-releasing factor, orexin, substance P and norepinephrine, will play an impoprtant role in understanding the key role of serotonergic neuron activity in controlling many known behavioral, physiological, cognitive and psychiatric phenomena. Some important circuits are the reciprocal connection between the DRN several other brain structures including the locus coeruleus, the hippocampus, the hypothalamus and the prefrontal cortex. For reviews see the references given in the Introduction.
Secondly we have used a computational model of these cells to see if it could generate, as observed experimentally, calcium spikes when sodium current is blocked by TTX. In the original model (Tuckwell and Penington, 2012) there are over 90 parameters, many of which were estimated from voltage-clamp data. It has been demonstrated that with changes to the properties of N-type calcium current, which made it more readily excitable and with a somewhat larger conductance, calcium spikes were obtained similar to those obtained experimentally. The T-type current was also augmented and the opposing A-type potassium current was decreased. There was a fine-tuning effect for the A- and T-type conductances. If the A-type conductance was too small, the amplitude of the spikes increased as well as the maxima of the internal concentration. Increasing the T-type conductance countered this effect, If the A-type conductance was too large, then internal decreased along with spike amplitude. The calcium pump strength and the value of CSF in (8) were the two parameters that had to be changed considerably in order to obtain stable calcium spiking. If the calcium pump was too weak then the ISI increased with time and concentration increased to non-physiological values. If were too large, then the spike amplitude decreased steadily. If CSF was too large (above 0.135) then the internal calcium concentration steadily increased. The reason for the necessity of such large changes in the parameters and CSF needed to elicit a regular train of calcium spikes is probably anatomical. The model is for a single compartment and it is likely ´that calcium spikes are generated in the dendrites which would result in quite different calcium dynamics, although the experimental observations are made at the soma. The large strength of the calcium pump is in accordance with the requirement of a relatively small time constant of decay of internal calcium needed to generate calcium spikes in a model of hippocampal neurons (Traub et al., 1991) where such spikes were in fact dendritic in origin.
5 Acknowledgement
This article is dedicated to the memory of Professor Luigi M. Ricciardi, advisor and friend. I also thank the Max Planck Institute and Professor Dr Juergen Jost for support and Professor Laura Sacerdote of the University of Torino for her role in the organization of the BIOCOMP 2012 meeting in Vietri and this volume.
References
- [1]
- [2] Aghajanian, GK (1985). Modulation of a transient outward current in serotonergic neurones by -adrenoreceptors. Nature 315, 501-503.
- [3] Aghajanian GK, Foote WE, Sheard MH (1968) Lysergic acid diethylamide: sensitive neuronal units in the midbrain raphe. Science 161, 706-708.
- [4] Aghajanian GK, Vandermaelen CP (1982) Intracellular recordings from serotonergic dorsal raphe neurons: pacemaker potentials and the effect of LSD. Brain Res 238, 463-469.
- [5] Aghajanian GK, Haigler HJ (1974) L-Tryptophan as a selective histochemical marker for serotonergic neurons in single-cell recording studies. Brain Res 81, 364-372.
- [6] Aghajanian GK, Wang RY, Baraban J (1978) Serotonergic and non-serotonergic neurons of the dorsal raphe: reciprocal changes in firing induced by peripheral nerve stimulation. Brain Res 153, 169-175.
- [7] Aghajanian GK, LAKOSKI JM (1984) Hyperpolarization of serotonergic neurons by serotonin and LSD: studies in brain slices showing increased K+ conductance. Brain Res 305, 181-185.
- [8] Allers KA Sharp T (2003). Neurochemical and anatomical identification of fast and slow-firing neurones in the rat dorsal raphe nucleus using juxtacellular labelling methods in vivo. Neuroscience 122, 193-204.
- [9] Azmitia EC, Whitaker-Azmitia, PM (1995) Anatomy. Cell Biology and Maturation of the Serotonergic System: Neurotrophic Implications for the Actions of Psychotrophic Drugs In: Psychopharmacology: the fourth generation of progress (Bloom FE, Kupfer DJ, eds), pp 461–469. New York: Raven.
- [10] Balu DT, Lucki I (2009) Adult hippocampal neurogenesis: Regulation, functional implications, and contribution to disease pathology. Neurosci Biobehav Rev 33, 232-252.
- [11] Bambico FR, Nguyen N-T, Gobbi G (2009) Decline in serotonergic firing activity and desensitization of 5-HT1A autoreceptors after chronic unpredictable stress. Eur Neuropsychopharmacology 19, 215-228.
- [12] Barfod ET, Moore AI, Lidofsky SD (2001) Cloning and functional expression of a liver isoform of the small conductance -activated K channel SK3. Am J Physiol Cell Physiol 280, C836-C842.
- [13] Baraban JM, Aghajanian GK (1980) Suppression of firing activity of 5-HT neurons in the dorsal raphe by alpha-adrenoceptor antagonists. Neuropharmacology 19, 355-363.
- [14] Bayliss DA Li Y-W Talley EM (1997). Effects of serotonin on caudal raphe neurons: activation of an inwardly rectifying potassium conductance. J Neurophysiol 77, 1349-1361.
- [15] Beck SG Pan Y-Z Akanwa AC Kirby LG (2004). Median and dorsal raphe neurons are not electrophysiologically identical. J Neurophysiol 91, 994-1005.
- [16] Burlhis TM Aghajanian GK (1987). Pacemaker potentials of serotonergic dorsal raphe neurons: contribution of a low-threshold Ca2+ conductance. Synapse 1, 582-588.
- [17] Calizo LH, Akanwa A, Ma X, Pan Y-Z, Lemos JC, Craige C, Heemstra LA, Beck SG (2011) Raphe serotonin neurons are not homogenous: electrophysiological, morphological and neurochemical evidence. Neuropharmacology 61, 524-543.
- [18] Chu N-S (1984) Responses of midbrain raphe neurons to ethanol. Brain Res 311, 348-352.
- [19] Crawford LK, Craige CP, Beck SG (2010) Increased intrinsic excitability of lateral wing serotonin neurons of the dorsal raphe: a mechanism for selective activation in stress circuits. J Neurophysiol 103, 2652-2663.
- [20] Crunelli V, Forda S, Brooks PA, Wilson KCP, Wise JCM, Kelly JS (1983) Passive membrane properties of neurones in the dorsal raiphe and periaqueductal grey recorded in vitro. Neuroscience Letters 40, 263-268.
- [21] Del Cid-Pellitero E, Garzón M (2011) Medial prefrontal cortex receives input from dorsal raphe nucleus neurons targeted by hypocretin1/ orexina-containing axons. Neurosci 172, 30-43.
- [22] Descarries L, Watkins KC, Garcia S, Beaudet A (1982) The serotonin neurons in nucleus raphe dorsalis of adult rat: a light and electron microscope radioautographic study. J Comp Neurol 207, 239-254.
- [23] Destexhe A Sejnowski TJ (2001). Thalamocortical assemblies. OUP, Oxford UK.
- [24] Diaz-Cintra S, Cintra L, Kemper T, Resnick O, Morgane PJ (1981) Nucleus raphe dorsalis: a morphometric golgi study in rats of three age groups. Brain Res 207, 1-16.
- [25] Freedman JE, Aghajanian GK (1987) Role of phosphoinositide metabolites in the prolongation of afterhyperpolarizations by -adrenoceptors in rat dorsal raphe neurons. J Neurosci 7, 3897-3908.
- [26] Gallager DW, Aghajanian GK (1976) Effect of antipsychotic drugs on the firing of dorsal raphe cells. I. Role of adrenergic system. Eur J Pharmacol 39, 341-355.
- [27] Hájós M, Gartside SE, Villa AEP, Sharp T (1995) Evidence for a repetitive (burst) firing pattern in a sub-population of 5-hydroxytryptamine neurons in the dorsal and median raphe nuclei of the rat. Neurosci 69,189-197.
- [28] Hájós M, Sharp T (1996) A 5-hydroxytryptamine lesion markedly reduces the incidence of burstfiring dorsal raphe neurones in the rat. Neurosci Lett 204, 161-164.
- [29] Hájós M, Sharp T, Newberry NR (1996) Intracellular recordings from burst-firing presumed serotonergic neurones the rat dorsal raphe nucleus in vivo. Brain Research 737, 308-312.
- [30] Hájós M Allers KA Jennings K Sharp T Charette G Sik A Kocsis B (2007). Neurochemical identification of stereotypic burst-firing neurons in the rat dorsal raphe nucleus using juxtacellular labelling methods. European J Neuroscience 25, 119-126.
- [31] Hayes DJ, Greenshaw AJ (2011) 5-HT receptors and reward-related behaviour: a review. Neurosci Biobehav Rev 35, 1419-1449.
- [32] Hodgkin AL, Huxley AF (1952) A quantitative description of membrane current and its application to conduction and excitation in nerve. J Physiol 117, 500-544.
- [33] Imai H, Park MR, Steindler DA, Kitai ST (1986) The morphology and divergent axonal of midbrain raphe the morphology organization projection neurons ln the rat. Brain Dev 8, 343-354.
- [34] Jacobs BL, Fornal CA (1995) Serotonin and behavior: a general hypothesis. In: Psychopharmacology: the fourth generation of progress (Bloom FE, Kupfer DJ, eds), pp 461-469. New York: Raven.
- [35] Jacobs BL, Fornal CA (1999) Activity of serotonergic neurons in behaving animals. Neuropsychopharmaol 21, 10S-15S.
- [36] Judge SJ, Gartside SE (2006) Firing of 5-HT neurones in the dorsal and median raphe nucleus in vitro shows differential -adrenoceptor and 5-HT1A receptor modulation. Neurochem Int 48, 100-107.
- [37] Kinney GG, Vogel GW, Feng P (1997) Decreased dorsal raphe nucleus neuronal activity in adult chloral hydrate anesthetized rats following neonatal clomipramine treatment: implications for endogenous depression. Brain Res 756, 68-75.
- [38] Kirby LG , Rice KC, Valentino RV (2000) Effects of corticotropin-releasing factor on neuronal activity in the serotonergic dorsal raphe nucleus. Neuropsychopharmacology 22, 148-162.
- [39] Kirby LG Pernar L Valentino RJ Beck SG (2003). Distinguishing characteristics of serotonin and nonserotonin- containing cells in the dorsal raphe nucleus: electrophysiological and immunohistochemical studies. Neuroscience 116, 669-683.
- [40] Kocsis B, Varga V, Dahan L, Sik A (2006) Serotonergic neuron diversity: Identification of raphe neurons with discharges time-locked to the hippocampal theta rhythm. PNAS 103, 1059-1064.
- [41] Lanfumey L, Mongeau R, Cohen-Salmon C, Hamon M ( 2008) Corticosteroid-serotonin interactions in the neurobiological mechanisms of stress-related disorders. Neurosci Biobehav Rev 32, 1174-1184
- [42] Li Y-Q, Li H, Kaneko T, Mizuno N (2001) Morphological features and electrophysiological properties of serotonergic and non-serotonergic projection neurons in the dorsal raphe nucleus An intracellular recording and labeling study in rat brain slices. Brain Research 900, 110-118.
- [43] Li Y-W, Bayliss DA (1998) Electrophysiological properties, synaptic transmission and neuromodulation in serotonergic caudal raphe neurons. Clin Exp Pharm Physiol 25, 468-473.
- [44] Liu R-J, van den Pol AN, Aghajanian GK (2002) Hypocretins (orexins) regulate serotonin neurons in the dorsal raphe nucleus by excitatory direct and inhibitory indirect actions. J Neurosci 22, 9453-9464.
- [45] Liu R-J, Lambe EK, Aghajanian GK (2005) Somatodendritic autoreceptor regulation of serotonergic neurons: dependence on L-tryptophan and tryptophan hydroxylase-activating kinases. Eur J Neurosci 21, 945-958.
- [46] Lowry CA, Evans AK, Gasser PJ, Hale MW, Staub DR, Shekhar A (2008) Topographic organization and chemoarchitecture of the dorsal raphe nucleus and the median raphe nucleus. In: Serotonin and sleep: molecular, functional and clinical aspects. Monti JM, Pandi-Perumal SR, Jacobs BL, Nutt DJ, Eds. Basel: Birkhauser Verlag AG. p 25-68.
- [47] Macri, BM Jacquin TD Flonta M-L (2006). Electrophysiological properties of dorsal raphe nucleus neurons in 5-HTT+/+ and 5-HTT-/- mice. Rom J Biophys 16, 111-124.
- [48] Maeda T, Fujimiya M, Kitahama K et al. (1989) Serotonin neurons and their physiological roles. Arch. Histol. Cytol. 52, Suppl., 113-120
- [49] Marinelli S, Schnell SA, Hack SP, Christie MJ, Wessendorf MW, Vaughan CW (2004) Serotonergic and nonserotonergic dorsal raphe neurons are pharmacologically and electrophysiologically heterogeneous. J Neurophysiol 92, 3532-3537.
- [50] Maximino, C (2012) Serotonin and Anxiety, SpringerBriefs in Neuroscience, Ch 5.
- [51] McGinty DJ, Harper RM (1976) Dorsal raphe neurons: depression of firing during sleep in cats. Brain Res 101, 569-575.
- [52] Moruzzi AM, Abedini NC, Hansen MA, Olson JE, Bosma MM (2009) Differential expression of membrane conductances underlies spontaneous event initiation by rostral midline neurons in the embryonic mouse hindbrain. J Physiol 587, 5081-5093.
- [53] Mosko SS, Jacobs BL (1974) Midbrain raphe neurons: spontaneous activity and response to light. Physiol Behav 13, 589-593.
- [54] Mosko SS, Jacobs BL (1976) Recording of dorsal raphe unit activity in vitro. Neurosci Lett 2, 195-200.
- [55] Nakamura K, Matsumoto M, Hikosaka O (2008) Reward-dependent modulation of neuronal activity in the primate dorsal raphe nucleus. J Neurosci 28, 5331-5343.
- [56] Pan ZZ, Williams JT, Osborne PB (1990) Opioid actions on single nucleus raphe magnus neurons from rat and guinea-pig in vitro. J Physiology 427, 519-532.
- [57] Pan ZZ, Grudt TJ, Williams JT (1994) -adrenoceptors in rat dorsal raphe neurons: regulation of two potassium conductances. J Physiology 478, 437-447.
- [58] Park MR (1987) Intracellular horseradish peroxidase labeling of rapidly firing dorsal raphe projection neurons. Brain Res 402, 117-130.
- [59] Park MR, Imai H, Kitai ST (1982) Morphology ,and intracellular responses of an identified dorsal raphe projection neuron. Brain Research 240, 321-326.
- [60] Penington NJ Kelly JS Fox AP (1991). A Study of the mechanism of Ca2+ current inhibition produced by serotonin in rat dorsal raphe neurons. J Neuroscience I7, 3594-3609.
- [61] Penington NJ Kelly JS Fox AP (1992). Action potential waveforms reveal simultaneous changes in Ia and ICa and IK produced by 5-HT in rat dorsal raphe neurons. Proc R Soc Lond B 248, 171-179.
- [62] Penington NJ, Fox AP (1995) Toxin-insensitive Ca current in dorsal raphe neurons. J Neurosci 15, 5719-5726.
- [63] Pettersen KH, Einevoll GT (2008) Amplitude variability and extracellular low-pass filtering of neuronal spikes. Biophys J 94, 784-802.
- [64] Pfister C, Danner H (1980) Fluorescenzhistochemische und neurohistologische Untersuchungen am Nucleus raphe dorsalis der Ratte. Acta Histochem 66, 253-261.
- [65] Rybak, IA Paton JFR Schwaber JS (1997). Modeling neural mechanisms for genesis of respiratory rhythm and pattern. I. Models of respiratory neurons. J Neurophysiol 7,1994-2006,
- [66] Sakai K (2011) Sleep-waking discharge profiles of dorsal raphe nucleus neurons in mice. Neuroscience 197, 200-224.
- [67] Savli M, Bauer A, Mitterhauser M et al. (2012) Normative database of the serotonergic system in healthy subjects using multi-tracer PET. NeuroImage 63, 447-459.
- [68] Schweimer JV, Ungless MA (2010) Phasic responses in dorsal raphe serotonin neurons to noxious stimuli. Neurosci 171, 1209-1215.
- [69] Scuveé-Moreau J, Boland A, Graulich A et al. (2004) Electrophysiological characterization of the SK channel blockers methyl-laudanosine and methyl-noscapine in cell lines and rat brain slices. Brit J Pharm 143: 753-764. J Physiol 513, 55-69.
- [70] Segal M (1985). A potent transient outward current regulates excitability o f dorsal raphe neurons. Brain Research 359, 347-350.
- [71] Sheard MH, Zolovick A, Aghajanian GK (1972) Raphe neurons: effect of tricyclic antidepressant drugs. Brain Res 43, 690-694.
- [72] Sprouse JS, Aghajanian GK (1987) Electrophysiological responses of serotoninergic dorsal raphe neurons to 5-HT1A and 5-HT1B agonists. Synapse 1, 3-9.
- [73] Tabak, J., Tomaiuolo, M., Gonzalez-Iglesias, A.E. et al., 2011. Fast-activating voltage- and calcium-dependent potassium (BK) conductance promotes bursting in pituitary cells: a dynamic clamp study. J. Neurosci. 31, 16855-16863.
- [74] Traub RD, Wong RKS, Miles R, Michelson H (1991) A model of a CA3 hippocampal pyramidal neuron incorporating voltage-clamp data on intrinsic conductances. J Neurophysiol 66, 635-650.
- [75] Trulson ME, Jacobs BL (1979) Raphe unit activity in freely moving cats: correlation with level of behavioral arousal. Brain Research 163, 135-150.
- [76] Tuckwell, HC, Penington, NJ (2012). Computational modeling of spike generation in serotonergic neurons of the dorsal raphe nucleus, submitted for publication.
- [77] Urbain N, Creamer K, Debonnel G (2006) Electrophysiological diversity of the dorsal raphe cells across the sleep-wake cycle of the rat. J Physiol 573, 679-695.
- [78] Vandermaelen CP Aghajanian GK (1983). Electrophysiological and pharmacological characterization of serotonergic dorsal raphe neurons recorded extracellularly and intracellularly in rat brain slices. Brain Research 289,109-119.
- [79] Waterhouse BD, Devilbiss D, Seiple S, Markowitz R (2004) Sensorimotor-related discharge of simultaneously recorded, single neurons in the dorsal raphe nucleus of the awake, unrestrained rat. Brain Research 1000, 183-191.
- [80] Williams JT Colmers WF Pan ZZ (1988). Voltage- and ligand-activated inwardly rectifying currents in dorsal raphe neurons in vitro. J Neurosci 8, 3499-3506.
- [81] Wu M-F, John J, Boehmer LN et al. (2004) Activity of dorsal raphe cells across the sleep-waking cycle and during cataplexy in narcoleptic dogs. J Physiol 554, 202-215.