75As NMR study of overdoped CeFeAsO0.8F0.2
Abstract
We report the results from a 75As NMR study on the overdoped iron pnictide superconductor, CeFeAsO0.8F0.2. Two peaks are observed in the NMR spectra for temperatures as high as 100 K, which is above the superconducting transition temperature of 39 K and hence they cannot be attributed to the effect of vortices in the superconducting state as previously suggested [A. Ghoshray, et al., Phys. Rev. B 79, 144512 (2009)]. The temperature dependence of the 75As NMR shifts for the two peaks is consistent with hyperfine coupling from magnetic Ce to As and with different Curie-Weiss temperatures. The appearance of two Curie-Weiss temperatures where one is near zero and the other is -18 K suggests that the two peaks arise from ordered and disordered regions where the disorder could be due to regions with significant fluorine site disorder and/or clusters of oxygen vacancies. Similar to some other studies on ReFeAsO1-xFx (Re is a rare earth) we find that there are more than one 75As spin-lattice and spin-spin relaxation rates that can be attributed to ordered and disordered regions in the ReO layer and suggests that inhomogeneity is a common feature in the ReFeAsO1-xFx superconductors.
pacs:
74.25.nj, 74.70.XaIron pnictides are a new family of high temperature superconductors (HTSC) with the second highest superconducting transition temperatures after the cuprates. They have attracted a considerable amount of attention because of the complex Fermi surface and similarities to the cuprates (e.g. the parent compounds display magnetic order). This raises the possibility that superconductivity is mediated by antiferromagnetic spin fluctuations. The CeFeAsO1-xFx compounds belong to the 1111 iron oxypnictide family and they are similar to other pnictides where they contain FeAs layers (with one As lattice site) separated by a CeO layer. In the parent compound Fe orders antiferromagnetically (AF) at about 140 K.Zhao et al. (2008) Upon F doping (electron doping) the AF transition temperature decreases and vanishes completely as the F content increases up to about 6% where superconductivity emerges with the highest of about 40 K.Zhao et al. (2008); Shiroka et al. (2011) Superconductivity has been observed in samples with F concentrations of up to 20%, however the superconducting dome is flat compared to the cuprates.Zhao et al. (2008) The Ce ions can order magnetically at low temperatures in contrast to La in LaFeAsO1-xFx, which was the first discovered superconducting system in the 1111 family.Kamihara et al. (2008) This offers the possibility to study the relation between magnetism of the rare earth and superconductivity.
Most of the current research is focused on the lower doping region especially close to the AF to superconducting phase boundary with the aim to better understand the nature of this transition and to see whether these phases coexist. The overdoped region gets less attention, which is due to the fact that it is more difficult to make clean samples with higher F content.Chong et al. (2008) In several iron pnictides, particularly at the higher doping levels, 75As nuclear magnetic resonance (NMR) experiments showed that at a certain temperature the signal comes from more than one As environment. This was manifested by more than one 75As line in the NMR spectrum or two different spin-lattice relaxation times .Ghoshray et al. (2009); Lang et al. (2010); Kobayashi et al. (2010); Mukuda et al. (2010); Yamashita et al. (2010a); Baek et al. (2011) Explaining such effects can be crucial for understanding the nature of superconductivity in iron pnictides. There is clearly a need for more 75As NMR measurements on aligned samples to better understand the electronic and magnetic properties of CeFeAsO1-xFx.
In this article we present the results from temperature dependent 75As NMR shift, spin-lattice and spin-spin relaxation rate measurements on aligned CeFeAsO0.8F0.2. The measurements were made on aligned powder samples because there are no sizeable single crystals of this family of iron pnictides. However, the data quality is improved compared to a previous report Ghoshray et al. (2009) most likely due to better sample alignment. Therefore, we were able to carry out measurements with the external magnetic field parallel and perpendicular to the axis. Below 100 K the 75As central line splits into two and we provide a possible explanation for this behavior.
I Experimental
Polycrystalline CeFeAsO1-xFx oxypnictide was prepared by reacting stoichiometric amounts of presynthesized CeAs and FeAs with Fe, As, CeO2 or Fe2O3, and CeF3 in evacuated and sealed quartz tubes. The cerium oxypnictide components were thoroughly ground and pressed into a pellet prior to heat treatment. The pellet was first reacted at 1000 ∘C for 24 hours, followed by an intermediate grinding and repressing into a pellet, before a final reaction at 1180 ∘C for 50 hours. X-ray diffraction (XRD) of the as-synthesized overdoped CeFeAsO0.8F0.2 sample showed the presence of Ce3Fe4O3 and traceable amounts of FeAs, FeAs2 impurities. From XRD data we estimated that sample contained 8% of Ce3Fe4O3 and about 3% of FeAs and FeAs2. Alignment of the crystallite powder of CeFeAsO0.8F0.2 was carried out by mixing 100 mg of a finely ground oxypnictide powder with an epoxy and placing it in a 1 T magnet. The sample was rotated at a speed of 60 rpm with the magnetic field applied perpendicular to the rotating axis. XRD rocking curve analysis revealed a (004) full width half maximum of 7.0∘ using Co K radiation. The superconducting transition temperature was measured using a SQUID magnetometer and found to be 39 K.
Most of 75As (nuclear spin, =3/2) NMR measurements were carried out in a magnetic field of =11.75 T. Additionally, we measured 75As NMR spectra at 7.07 T and 17.62 T in order to know the field dependence of the line shape. NMR shifts , spin-lattice and spin-spin relaxation times were measured at temperatures ranging from 297 K to 10 K for different orientations of the aligned sample with respect to the external magnetic field, i.e. for c and c (c axis parallel/perpendicular to ). A frequency stepped spin echo technique was used for recording the spectra with the pulse sequence , where the echoes were integrated and plotted versus the frequency.
The spin-spin relaxation time, , was measured by varying the pulse spacing, . The echo decay had an exponential form for both field orientations that can be written as,
| (1) |
The spin-lattice relaxation time, , was measured using the inversion recovery method. The magnetization recovery signal could be fitted with the theoretical formula for the central transition of the =3/2 nucleus,
| (2) |
where is the time between the inversion pulse and the spin echo sequence, and is 2 for perfect inversion.
The NMR frequency of the central transition line for 75As in a high magnetic field with the quadrupolar interaction treated as a perturbation to second order and for the axial symmetry of the electric field gradient (EFG), i.e. asymmetry parameter = 0, can be written as,
| (3) |
where is the gyromagnetic ratio of 75As, is the shift, is the second order quadrupolar contribution, which is a function of the external field and angle, , between the external field and axis. With the field parallel and perpendicular to the axis (c and c, respectively) Eq. 3 gives,
| (4) |
| (5) |
where is the quadrupolar frequency measured for the c orientation. The shift can be calculated from Eq. 4 and 5 and by measuring the frequency () of the reference compound. The shifts were referenced to NaAsF6 using the procedure described by Harris et al.Harris et al. (2008)
In general the total NMR shift (after subtracting the quadrupolar contribution) is given by the formula,
| (6) |
where is the orbital shift, is the spin (Knight) shift, which can be written as where is the hyperfine coupling constant and is the uniform electronic spin susceptibility. is the Meissner (diamagnetic) shift which appears only below and it is small when compared to the very large low temperature shifts that we observe in our sample. Therefore, we will restrict our discussion to and . All shifts are orientation dependent owing to a directional dependent hyperfine coupling constants. is expected to be temperature independent while can change significantly with temperature and reflects the temperature dependence of . and are of magnetic origin and field independent.
II Results and discussion
II.1 Temperature and field dependence of 75As spectra

Fig. 1 shows a typical frequency stepped 75As spectrum of the aligned sample for c and c measured at room temperature at 11.75 T. One can see a sharp, central line due to the central transition to and satellite lines arising from the to transitions. The satellite lines are broad, which is also observed in the 63Cu NMR spectra in the superconducting cupratesRybicki et al. (2009). From c we calculate the quadrupole splitting, which amounts to 10.90.2 MHz, and within the measurement precision it does not change as the temperature is reduced to 10 K. Half of the distance between the satellite lines for c amounts to 5.350.05 MHz which is expected for an axially symmetric EFG and it is consistent with the tetragonal crystal structureZhao et al. (2008). The value of is in agreement with that obtained for CeFeAsO0.86F0.16 Ghoshray et al. (2009) and similar to values obtained for LaFeAsO1-xFx Grafe et al. (2008); Nakai et al. (2009) and CeFeAs0.95P0.05O.Sarkar et al. (2012) The second order quadrupole contribution, calculated for 11.75 T amounts to 0.26 MHz and it is also temperature independent.


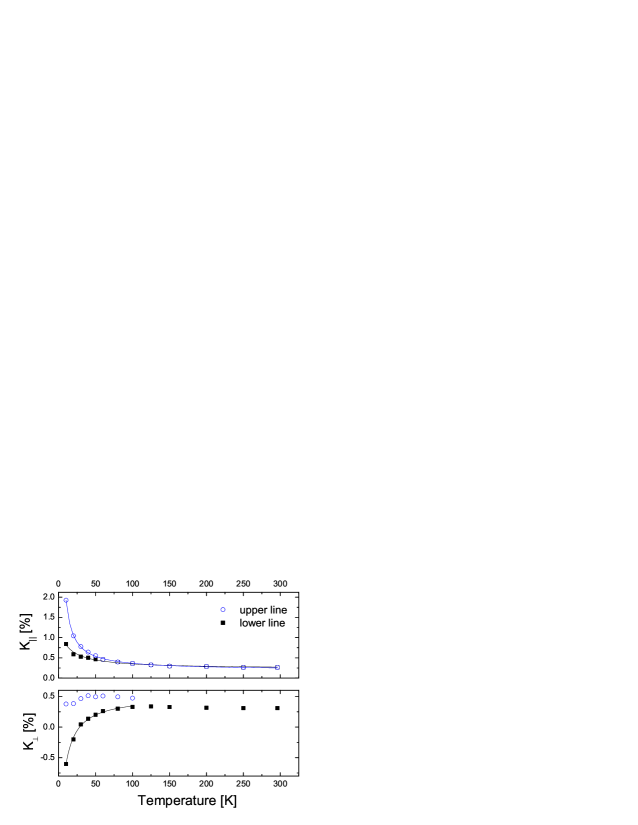
Now we turn to the temperature dependence of the 75As spectra and shifts for c and c orientations presented in Fig. 2 and Fig. 3, respectively. For both orientations at higher temperatures the shift, (Fig. 4), changes very slowly and then around 100 K starts to change much faster with no noticeable features around . A similar temperature dependence was observed from 19F NMR measurements on SmFeAsO0.85F0.15 Prando et al. (2010), and 75As NMR measurements on NdFeAsO0.85F0.15 Jeglič et al. (2009). On the other hand the temperature dependence of for LaFeAsO1-xFx is very differentGrafe et al. (2008); Imai et al. (2008), where it changes much less with temperature and is similar to the AeFe2As2 iron pnictides, where Ae is an alkaline earth (122 family). This must be due to the fact that Ce and Nd ions have a magnetic moment coming from electrons Zhao et al. (2008); Chen et al. (2008); Qiu et al. (2008); Lynn and Dai (2009) that affects the NMR shift while La is not magnetic de la Cruz et al. (2008). Comparing the total temperature change of one notices that it is bigger for the Nd 1111 oxypnictide Jeglič et al. (2009) than for the Ce compound (Fig. 4). This correlates with the free ion effective magnetic moment in the paramagnetic state, which is 3.62 for Nd3+ and 2.54 for Ce3+. For samples with small F doping it has been found that the rare earth orders magnetically at low temperatures (few K) with the ordered moment =1.55 Qiu et al. (2008) and =0.94 Zhao et al. (2008).
With decreasing temperature there is also very significant line broadening and a second line appears. Interestingly, splitting into two lines becomes visible at different temperatures for different field orientations. The resultant NMR shifts for both peaks and orientations are plotted in Fig. 4 where it can be seen that there is Curie-Weiss-like behavior.
Since there is only one As lattice site and no magnetic ordering is expected at high temperatures one expects only one central line in the 75As spectrum. However, there have been several studies so far that reported more than one line. Two lines were reported by Ghoshray et al. Ghoshray et al. (2009) for optimally doped CeFeAsO0.84F0.16, but the second line appeared only below and the lines were attributed to nuclei in superconducting and normal regions of the sample. A SR study on underdoped CeFeAsO1-xFx reported the coexistence of magnetic and superconducting states at low temperatures Sanna et al. (2010). Nuclear quadrupole resonance (NQR) studies of LaFeAsO1-xFx and SmFeAsO1-xFx reported two lines in the underdoped Lang et al. (2010) and overdoped region Kobayashi et al. (2010). It has also been shown that two different values are necessary to fit the LaFeAsO data Mukuda et al. (2009); Yamashita et al. (2010b). Also, in the Ca(Fe1-xCox)2As2 system an 75As NQR study showed that for optimally doped and overdoped samples a shoulder in the NQR line appears at relatively high temperatures indicating the existence of two As sites with different local environments.Baek et al. (2011) It should be noted that there are very few NMR studies of 1111 oxypnictides in the overdoped region making it difficult to fully compare our results with other systems.
It is likely that the Curie-Weiss behavior in the 75As data is due to hyperfine coupling of the Ce moments to 75As. Then Eq. 6 can be rewritten asJeglič et al. (2009),
| (7) |
where the two last terms constitute the spin (Knight) shift , is the Avogadro number, is the Bohr magneton, and are the susceptibilities of itinerant electrons in the FeAs layer and of localized Ce moments, respectively. We do not know the temperature dependence of , however, for La 1111 oxypnictides, which do not have magnetic rare earth ions, the total temperature dependence of the measured shift is 15 times smaller than for our sample Imai et al. (2008); Grafe et al. (2008). Therefore, since has a Curie-Weiss temperature dependence can be written as,
| (8) |
which we use to fit the data. Fig. 4 shows such fits down to the lowest temperatures since we do not see any change in the behavior of around . We did not fit the data for the upper line because the experimental uncertainty was too large. For we fitted both curves simultaneously while maintaining a common , which is expected since the Ce effective moment should be the same for both peaks.
For c we find that =-18.41.6 K and =0.170.44 K for the lower and upper lines, respectively. Our Curie-Weiss temperature obtained for the lower peak is similar to =-13 K found from for NdFeAsO0.85F0.15 Jeglič et al. (2009) and =-11 K which was obtained from shifts for SmFeAsO0.85F0.15 Prando et al. (2010). A Curie-Weiss-like behavior of was also found for NdFeAsO0.6, but no values of were given Yamashita et al. (2010a). The values for are similar and they are 0.2080.009 % and 0.1960.011 % for the upper and lower lines, respectively, and is 170.8 %/K. The fit for is not as good as those for and for the lower line we find that =-0.921.6 K, =0.400.02 %, and =-11.11.7 %/K. From the values we deduce that =-1.530.25 and the hyperfine coupling constant changes sign when the applied magnetic field orientation changes from parallel to perpendicular. The origin of the two lines is discussed below in section II.3
Further understanding of the two lines as well as the line broadening mechanism can be obtained from measurements of the 75As spectrum in a broad field range (=7.07 T, 11.75 T, 17.62 T), at different temperatures (40 K, 100 K and 297 K), and for both field orientations. We want to stress that compared to a report on optimally doped CeFeAsO0.84F0.16Ghoshray et al. (2009) for c at 7 T we have smaller linewidths, which is most likely due to better alignment. We also did not observe any unexpected intensity changes in the normal state.
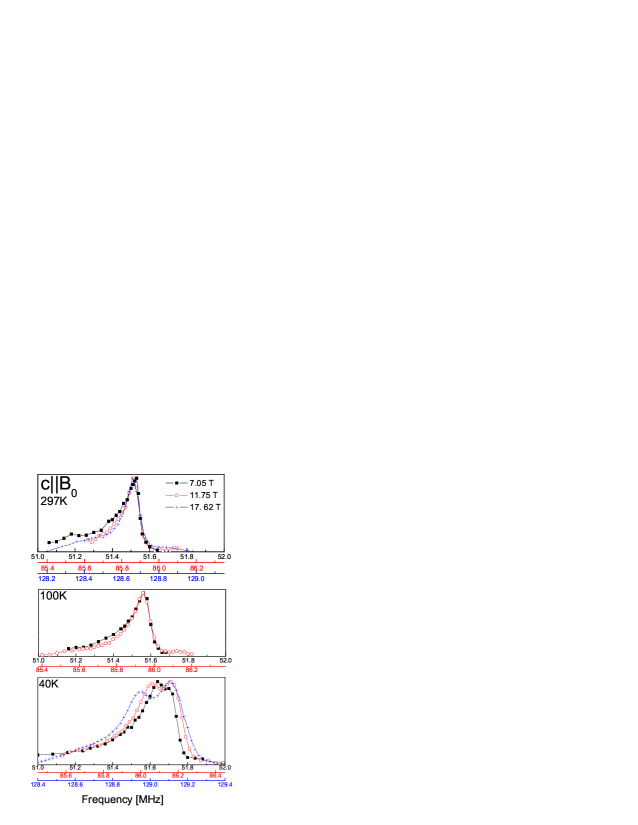
First we discuss the results for c shown in Fig. 5. Here the spectra are plotted over the same frequency range and so that the peak frequencies coincide. We want to stress that the NMR shifts are the same at all measured fields and this is consistent with a magnetic NMR shift. We note that for c the line has an asymmetric shape with a tail towards lower frequencies (Figs. 2 and 5) while for c it is more symmetric. However, similar line shapes were observed for aligned LaFeAs0.86F0.14 Kitagawa et al. (2010), which suggests that the linewidth asymmetry is intrinsic. The most striking feature of Fig. 5 is that the linewidth at 297 K and 100 K is almost field independent. This is not expected because in general for c, the linewidth, comes from a distribution of shifts given in Eq. 6. Therefore, for this orientation one expects that is due to a distribution of the spin and orbital shifts, and i.e. should be proportional to . It is likely that there is also a second order quadrupolar contribution to the linewidth, which is , and this could also explain the low frequency tail. This could be due to misalignment and/or a variation of the principal axis of the EFG from the axis. However, the second possibility seems more likely because such asymmetric lines were observed in other well aligned samples.Kitagawa et al. (2010)
As the temperature decreases there is a significant increase in the linewidth (see Fig. 2), which is typical for magnetic broadening. At 40 K the separation between the two peaks (in kHz) scales linearly with the magnetic field (see Fig. 5), which is expected if the peaks arise from coupling to Ce. Additionally, the linewidth of the satellite lines does not change significantly with temperature indicating that the quadrupolar contribution to the width of the central line does not change much with temperature.
Below increases even more (see Fig. 2), which is due to further magnetic broadening. At low temperatures there can be additional broadening due to vortex lattice formation in the mixed superconducting state. Vortices induce a distribution of the local magnetic field, .P. Pincus and Wernick (1964); Brandt (1988) However, it would not result in such broad lines as we observe at low temperatures, because typical broadening of NMR lines due to a vortex lattice in pnictides is much smaller.Matano et al. (2008); Ahilan et al. (2008); Ma et al. (2012).

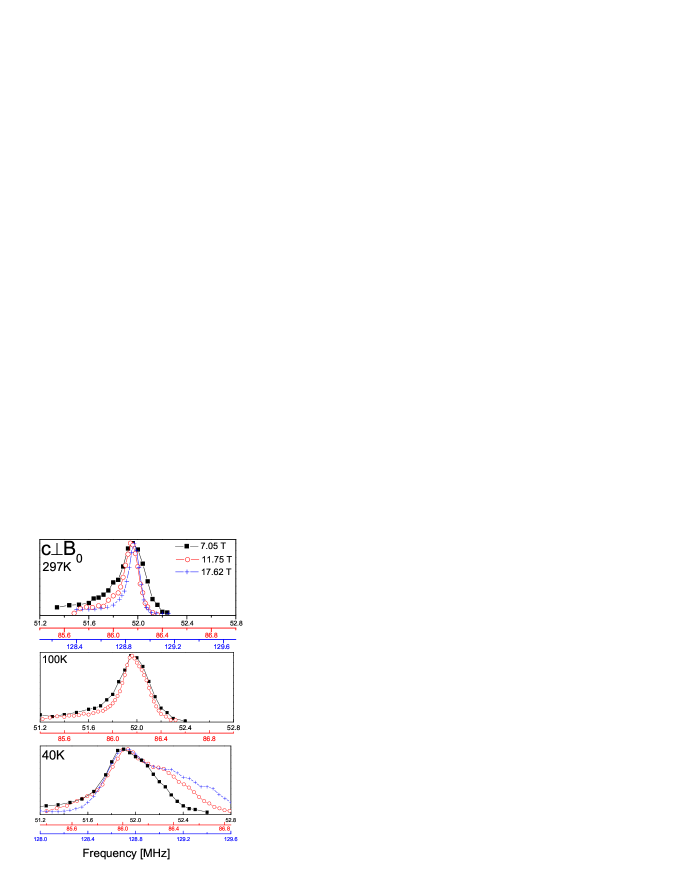
The field dependence of line shapes for c is presented in Fig. 6. For this orientation the total NMR shift contains a sizable second order quadrupolar contribution (Eq. 5) and it is expected to be proportional to . We show in Fig. 7 a plot of the total NMR shift for c against measured at 7.05 T, 11.75 T and 17.62 T and at 297 K (at this temperature there is only a single line in the spectrum). The intercept is and it amounts to 0.31%. The gradient is given by . The value of the second order quadrupolar contribution obtained from a linear fit in Fig. 7 amounts to 0.29 MHz at 11.75 T. It is slightly bigger than the approximate value of 0.26 MHz estimated from the spectra in Fig. 1.
For c the linewidth, can be of magnetic and quadrupolar origin, and the latter one should be much bigger compared to c. At 297 K we observe that the linewidth strongly decreases with increasing field (Fig. 6) as is expected for quadrupolar broadening. At 100 K the linewidths at 7.05 T, 11.75 T are similar, but this is due to the fact that in the spectrum measured at 11.75 T there is a second peak, which first appears as a high frequency shoulder (see Fig. 3). With decreasing temperatures increases significantly (Fig. 3 and 6) similar to , which arises from line splitting and magnetic broadening induced by the Ce moment that are more noticeable at low temperatures.
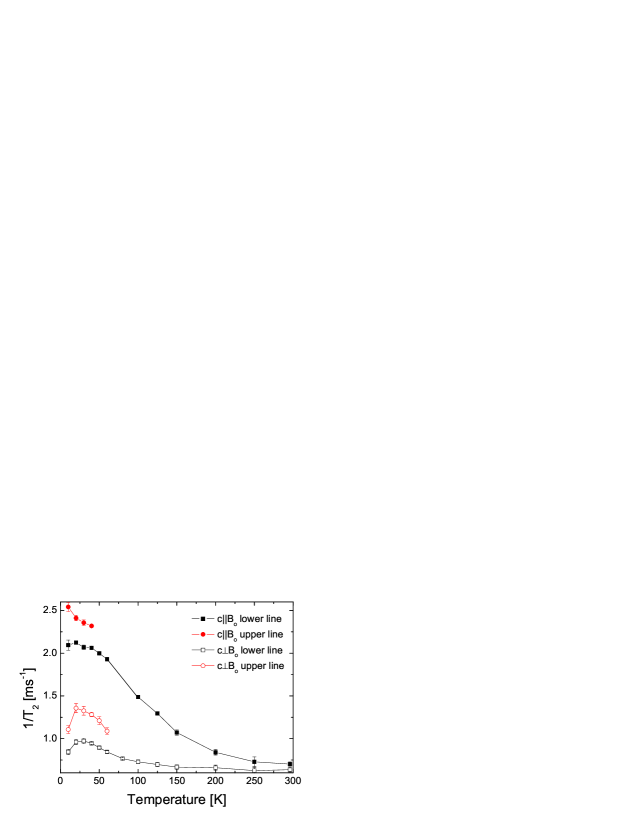
II.2 Temperature dependence of and
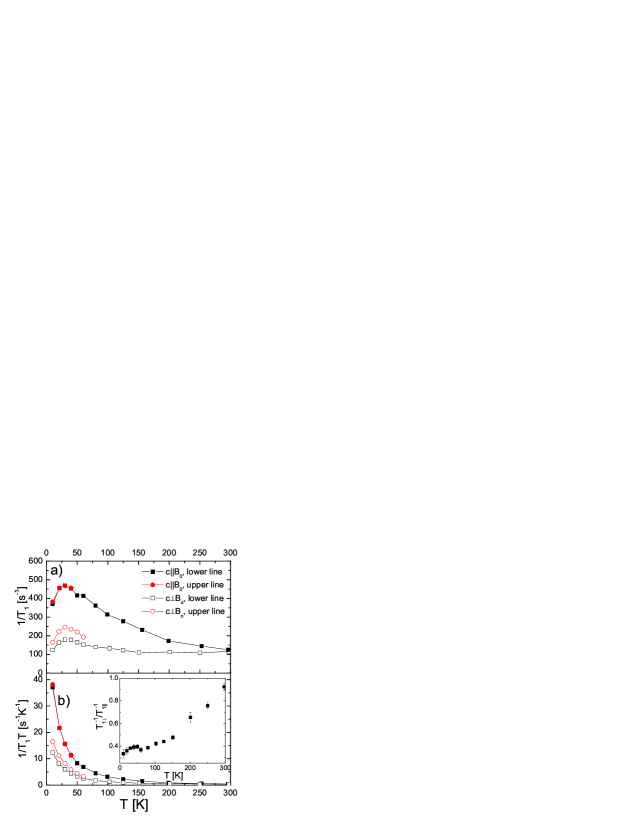
Equations 1 and 2 were used to calculate the spin-spin and spin-lattice relaxation times and they provided a good fit to the experimental data. Figures 8 and 9 show the temperature dependence of the spin-lattice and spin-spin relaxation rate, and , respectively for c and c orientations. Both relaxation rates increase with decreasing temperature and reach a maximum at a temperature of 30 K, which is close to and then they start to decrease, except for for the upper line for c, which increases with decreasing temperature. In PrFeAsO0.65F0.15 and in CeFeAs0.1O a similar maximum of was observed at 10 K, which is somewhat lower than in the case of CeFeAsO0.8F0.2, but still above the magnetic ordering temperature of the rare earth.Yamashita et al. (2010a); Sarkar et al. (2012) However, if one plots versus temperature (Fig. 8b) there is no downturn and systematically increases with decreasing temperature down to 10 K. A strong enhancement of with temperature is markedly different from the behavior observed for LaFeAsO1-xFx Kobayashi et al. (2010); Yamashita et al. (2010b); Mukuda et al. (2009, 2010) and for the 122 compounds Ning et al. (2010) with similar doping for which it has been found that decreases with decreasing temperature. Our low temperature values of are also more than two orders of magnitude bigger than for LaFeAsO1-xFx Kitagawa et al. (2010); Kobayashi et al. (2010) or for the 122 pnictides, which must be due to an increase in the spin fluctuations caused by the presence of magnetic Ce ions.
The anisotropy ratio of the spin lattice relaxation rates defined as strongly changes with temperature as can be seen in the inset to Fig. 8b. For the lower frequency lines is about 0.9 at room temperature and steadily drops to 0.3 at T=10 K, which indicates that the temperature dependence of spin fluctuations is highly anisotropic. of 1.2 is observed in LaFeAsO0.86F0.14 and there is a small decrease to about 1 as the temperature is reduced to 10 K Kitagawa et al. (2010). The anisotropy ratio of also shows a strong temperature dependence. The origin of this temperature dependence in the anisotropy of and is not clear. However, it suggests that the spin fluctuations probed by 75As are different when the magnetic field is applied parallel or perpendicular to the c-axis. Since is much larger in CeFeAsO0.8F0.2 than in LaFeAsO1-xFx it is possible that this anisotropy is caused by magnetic Ce and strong coupling with Fe spin fluctuations in the FeAs layer.
II.3 Origin of two 75As NMR lines
First we want to address the interpretation of two 75As lines given for a very similar compound CeFeAsO0.84F0.16 Ghoshray et al. (2009), where two lines were observed only below and attributed to signals from regions inside and outside of the vortices. Their measurements were made at 7.04 T (the smallest field that we used) and only for the c orientation. If one looks at our Fig. 6 and for an applied magnetic field of 7.05 T it is clear that a strongly asymmetric line shape is observed at 40 K. As noted above, at 11.75 T for c the second line can already be seen at 100 K as a high frequency shoulder (Fig. 3). Additionally, the 75As NMR signals in CeFeAsO0.84F0.16 were broader, which could cause the second line to become resolvable in the NMR spectrum only at lower temperatures when the line splitting becomes large. Therefore, we believe that the fact that in CeFeAsO0.84F0.16 Ghoshray et al. (2009) two lines were observed only below could be accidental and due to additional line broadening because of incomplete alignment and hence the two peaks are not due to the effect of vortices in the superconducting state.
As was mentioned above in the Experimental section there is only a very small amount of impurities containing As in the sample, i.e. FeAs2 and FeAs. Neither of them magnetically orders around 100-120 K and hence they can not explain the shift behavior or appearance of the second line. FeAs orders below 77 K Selte et al. (1972); Yuzuri et al. (1980) and FeAs2 does not order at all Yuzuri et al. (1980). We also did not observe any sudden changes of the -factor of the probehead, which would be the case if a significant amount of sample magnetically ordered.
One can try to estimate the relative signal intensity of both lines. It can be done most reliably for c at 17.62 T and at 40 K, i.e. still above to avoid possible signal loss of one or two lines due to the superconducting state. For this measurement the two lines overlap the least and the estimated intensity ratio amounts to about 1:2. Therefore, none of the lines can come from the impurity phase. Additionally, the integrated NMR signal intensity corrected for temperature, -factor and did not change when the second line appeared, which is consistent with the NMR signal arising from the same phase fraction for all of the measured temperatures.
At a given temperature two lines are observed at different frequencies for different orientation (compare Fig. 2 and 3). This excludes the possibility that we observe two lines due to poor sample alignment. Similar temperature behavior of the shifts, and indicates that the signals come from 75As nuclei in regions that have similar electronic properties.
It is possible that the two lines arise from ordered and disordered regions in the FeAs layer. In this scenario the temperature-dependent 75As NMR shift arises from hyperfine coupling from Ce to the As. In the ordered region it is possible that there is superexchange between the Ce moments via the FeAs conducting layer (possibly via an RKKY interaction), as has already been suggested from 17F NMR measurements on SmFeAsO1-xFxPrando et al. (2010). This leads to a non-zero Curie-Weiss temperature, which is negative in our case and consistent with Ce antiferromagnetic order that occurs at low temperature, low doping, and via an exchange interaction with Fe. In the disordered region it is possible that the average Ce-Ce superexchange energy is zero, which could lead to the observed Curie-Weiss temperature that is near zero (e.g. by disrupting the RKKY interaction). The question is then why are there ordered and disordered regions in the FeAs layer? It may be related to charge disorder that occurs near the F dopant ion or possibly due to an inhomogeneous F concentration and/or oxygen vacancies in the CeO0.8F0.2 layer. The differences in the Curie-Weiss temperature from -18 K in the ordered to 0 K in the disordered region is not very large and hence it is possible that only a small amount of disorder is sufficient to reduce the Ce-Ce superexchange energy. As we have already noted, disorder induced affects have been observed in other ReFeAsO1-xFx (Re is a rare earth) NMR measurements either by the appearance of additional low temperature NMR peaks or two different spin-lattice relaxation rates.
III Conclusions
In conclusion, 75As NMR measurements on CeFeAsO0.8F0.2 show the appearance of two peaks in the 75As NMR spectra that are evident for temperatures as high as 100 K, which is well above the superconducting transition temperature of 39 K. Thus, contrary to a previous 75As NMR study at a lower magnetic field, on less well aligned samples and for lower doping, the 2 peaks cannot be attributed to the effect of vortices. It is likely that the 2 peaks arise from hyperfine coupling from magnetic Ce to As and ordered and disordered regions in the CeO layer where the disorder could be due to regions where the F concentration is highly inhomogeneous and/or regions with clusters of oxygen vacancies. We find that this interpretation is consistent with the temperature dependence of the 75As NMR shift data where the 2 peaks can be fitted to Curie-Weiss-like terms with a Curie-Weiss temperature of near zero or -18 K. Interestingly we find that the hyperfine coupling from Ce to As changes sign when changing the applied field from parallel to perpendicular to the -axis and this ratio is -1.5. The 75As spin-lattice relaxation rates are dominated by coupling of Ce moment spin fluctuations to 75As in the low temperature region where 1/ systematically increases with decreasing temperature. The ratio of the spin-lattice relaxation rate, R, is near 1 at room temperature and decreases with decreasing temperature, which could be due to coupling between the Ce moment and the FeAs layer that is stronger when the magnetic field is applied along the -axis direction. Similar to some studies on other 1111 compounds we find two and two values at low temperatures (above Tc). This is not surprising when there are ordered and disordered regions and suggests that disordered regions in the ReO layer may be a common feature in the 1111 compounds. Since doping in the FeAs layer is via charge transfer from the insulating ReO layer, then disordered ReO regions should lead to electronic disorder in the conducting FeAs layer.
IV Acknowledgments
We acknowledge financial support from the University of Leipzig, IRTG: Diffusion in porous media (T.M.), the New Zealand Marsden Fund (VUW0917), the MacDiarmid Institute for Advanced Materials and Nanotechnology, and the assistance of M. Jurkutat and J. Kohlrautz (Leipzig).
References
- Zhao et al. (2008) J. Zhao, Q. Huang, C. de la Cruz, S. Li, J. W. Lynn, Y. Chen, M. A. Green, G. F. Chen, G. Li, Z. Li, J. L. Luo, N. L. Wang, and P. Dai, Nat. Mater. 7, 953 (2008).
- Shiroka et al. (2011) T. Shiroka, G. Lamura, S. Sanna, G. Prando, R. De Renzi, M. Tropeano, M. R. Cimberle, A. Martinelli, C. Bernini, A. Palenzona, R. Fittipaldi, A. Vecchione, P. Carretta, A. S. Siri, C. Ferdeghini, and M. Putti, Phys. Rev. B 84, 195123 (2011).
- Kamihara et al. (2008) Y. Kamihara, T. Watanabe, M. Hirano, and H. Hosono, J. Am. Chem. Soc. 130, 3296 (2008).
- Chong et al. (2008) S. V. Chong, T. Mochiji, S. Sato, and K. Kadowaki, J. Phys. Soc. Jpn. 77SC, 27 (2008).
- Ghoshray et al. (2009) A. Ghoshray, B. Pahari, M. Majumder, M. Ghosh, K. Ghoshray, B. Bandyopadhyay, P. Dasgupta, A. Poddar, and C. Mazumdar, Phys. Rev. B 79, 144512 (2009).
- Lang et al. (2010) G. Lang, H.-J. Grafe, D. Paar, F. Hammerath, K. Manthey, G. Behr, J. Werner, and B. Büchner, Phys. Rev. Lett. 104, 097001 (2010).
- Kobayashi et al. (2010) Y. Kobayashi, E. Satomi, S. C. Lee, and M. Sato, J. Phys. Soc. Jpn. 79, 093709 (2010).
- Mukuda et al. (2010) H. Mukuda, M. Nitta, M. Yashima, Y. Kitaoka, P. M. Shirage, H. Eisaki, and A. Iyo, J. Phys. Soc. Jpn. 79, 113701 (2010).
- Yamashita et al. (2010a) H. Yamashita, M. Yashima, H. Mukuda, Y. Kitaoka, P. M. Shirage, and A. Iyo, Physica C 470, S375 (2010a).
- Baek et al. (2011) S.-H. Baek, H.-J. Grafe, L. Harnagea, S. Singh, S. Wurmehl, and B. Büchner, Phys. Rev. B 84, 094510 (2011).
- Harris et al. (2008) R. K. Harris, E. D. Becker, S. M. C. De Menezes, P. Granger, R. E. Hoffman, and K. W. Zilm, Magn. Res. Chem. 46, 582 (2008).
- Rybicki et al. (2009) D. Rybicki, J. Haase, M. Greven, G. Yu, Y. Li, Y. Cho, and X. Zhao, J. Supercond. Nov. Magn. 22, 179 (2009).
- Grafe et al. (2008) H.-J. Grafe, D. Paar, G. Lang, N. J. Curro, G. Behr, J. Werner, J. Hamann-Borrero, C. Hess, N. Leps, R. Klingeler, and B. Büchner, Phys. Rev. Lett. 101, 047003 (2008).
- Nakai et al. (2009) Y. Nakai, S. Kitagawa, K. Ishida, Y. Kamihara, M. Hirano, and H. Hosono, New J. Phys. 11, 045004 (2009).
- Sarkar et al. (2012) R. Sarkar, M. Baenitz, A. Jesche, C. Geibel, and F. Steglich, J. Phys.: Condens. Matter 24, 135602 (2012).
- Prando et al. (2010) G. Prando, P. Carretta, A. Rigamonti, S. Sanna, A. Palenzona, M. Putti, and M. Tropeano, Phys. Rev. B 81, 100508 (2010).
- Jeglič et al. (2009) P. Jeglič, J.-W. G. Bos, A. Zorko, M. Brunelli, K. Koch, H. Rosner, S. Margadonna, and D. Arčon, Phys. Rev. B 79, 094515 (2009).
- Chen et al. (2008) G. F. Chen, Z. Li, D. Wu, G. Li, W. Z. Hu, J. Dong, P. Zheng, J. L. Luo, and N. L. Wang, Phys. Rev. Lett. 100, 247002 (2008).
- Qiu et al. (2008) Y. Qiu, W. Bao, Q. Huang, T. Yildirim, J. M. Simmons, M. A. Green, J. W. Lynn, Y. C. Gasparovic, J. Li, T. Wu, G. Wu, and X. H. Chen, Phys. Rev. Lett. 101, 257002 (2008).
- Lynn and Dai (2009) J. W. Lynn and P. Dai, Physica C 469, 469 (2009).
- de la Cruz et al. (2008) C. de la Cruz, Q. Huang, J. W. Lynn, J. Li, W. Ratcliff II, J. L. Zarestky, H. A. Mook, G. F. Chen, J. L. Luo, N. L. Wang, and P. Dai, Nature 453, 899 (2008).
- Sanna et al. (2010) S. Sanna, R. De Renzi, T. Shiroka, G. Lamura, G. Prando, P. Carretta, M. Putti, A. Martinelli, M. R. Cimberle, M. Tropeano, and A. Palenzona, Phys. Rev. B 82, 060508 (2010).
- Mukuda et al. (2009) H. Mukuda, N. Terasaki, N. Tamura, H. Kinouchi, M. Yashima, Y. Kitaoka, K. Miyazawa, P. M. Shirage, S. Suzuki, S. Miyasaka, S. Tajima, H. Kito, H. Eisaki, and A. Iyo, J. Phys. Soc. Jpn. 78, 084717 (2009).
- Yamashita et al. (2010b) H. Yamashita, H. Mukuda, M. Yashima, S. Furukawa, Y. Kitaoka, K. Miyazawa, P. M. Shirage, H. Eisaki, and A. Iyo, J. Phys. Soc. Jpn. 79, 103703 (2010b).
- Imai et al. (2008) T. Imai, K. Ahilan, F. Ning, M. A. McGuire, A. S. Sefat, R. Jin, B. C. Sales, and D. Mandrus, J. Phys. Soc. Jpn. 77SC, 47 (2008).
- Kitagawa et al. (2010) S. Kitagawa, Y. Nakai, T. Iye, K. Ishida, Y. Kamihara, M. Hirano, and H. Hosono, Phys. Rev. B 81, 212502 (2010).
- P. Pincus and Wernick (1964) V. J. P. Pincus, A. C. Gossard and J. H. Wernick, Phys. Lett. 13, 21 (1964).
- Brandt (1988) E. H. Brandt, Phys. Rev. B 37, 2349 (1988).
- Matano et al. (2008) K. Matano, Z. A. Ren, X. L. Dong, L. L. Sun, Z. X. Zhao, and G. qing Zheng, Europhys. Lett. 83, 57001 (2008).
- Ahilan et al. (2008) K. Ahilan, F. L. Ning, T. Imai, A. S. Sefat, R. Jin, M. A. McGuire, B. C. Sales, and D. Mandrus, Phys. Rev. B 78, 100501 (2008).
- Ma et al. (2012) L. Ma, J. S. Zhang, D. M. Wang, J. B. He, T. Xia, L., G. F. Chen, and Y. W. Q., Chin. Phys. Lett. 29, 067402 (2012).
- Ning et al. (2010) F. L. Ning, K. Ahilan, T. Imai, A. S. Sefat, M. A. McGuire, B. C. Sales, D. Mandrus, P. Cheng, B. Shen, and H.-H. Wen, Phys. Rev. Lett. 104, 037001 (2010).
- Selte et al. (1972) K. Selte, A. Kjekshus, and A. Andresen, Acta Chem. Scand. 26, 3101 (1972).
- Yuzuri et al. (1980) M. Yuzuri, R. Tahara, and Y. Nakamura, J. Phys. Soc. Jpn. 48, 1937 (1980).