Solar induced growth of silver nanocrystals
Abstract
The effect of solar irradiation on plasmonic silver nanocrystals has been investigated using Transmission Electron Microscopy and size distribution analysis, in the context of solar cell applications for light harvesting. Starting from an initial collection of spherical nanocrystals on a carbon film whose sizes are log-normally distributed, solar irradiation causes the nanocrystals to grow, with one particle reaching a diameter of 638 nm after four hours of irradiation. In addition some of the larger particles lose their spherical shape. The average nanocrystal diameter was found to grow as predicted by the Ostwald ripening model, taking into account the range of area fractions of the samples. The size distribution stays approximately log-normal and does not reach one of the steady-state size distributions predicted by the Ostwald ripening model. This might be explained by the system being in a transient state.
I Introduction
Metallic nanocrystals are desirable for their use in solar cell applications, where they can be used to increase efficiency by means of the localized surface plasmon resonance. This collective oscillation of the valence electrons results in a local electromagnetic field at the nanocrystal surface and in wavelength selective photon absorption and scattering Malinsky et al. (2001). By dispersing metal nanocrystals on the surface of an optically thin solar cell, the localized surface plasmon resonance will scatter the light further into the solar cell, thereby increasing the absorption and thus the efficiency.
Silver (Ag) nanocrystals are particularly popular, being relatively cheap and easy to produce by a variety of processes. In addition, they do not need to be deposited and heat-treated, which can be damaging for the solar cells. Using Ag nanocrystals, Pillai Pillai et al. (2007) and Beck et al. Beck et al. (2009) demonstrated a significant increase in absorption in wafer-based silicon solar cells. However, nanocrystals used in solar cell applications will be exposed to elevated temperatures, which can make them unstable. A solid understanding of the underlying growth and coalescence mechanisms is therefore of vital importance.
The Ag nanocrystals in this work have been made by a chemical synthesis of metallic nanocrystals, using chemical reduction of silver salts by sodium borohydride. This has shown to be a simple, economical, and popular method that can be applied in large scale as required for industrial applicationsSileikaite et al. (2009); Bonsak et al. (2011). The surface plasmon resonance depends on the shape of the nanocrystal surface, size, spatial arrangement, and configuration of the nanocrystals Hofmeister et al. (2005). It is therefore very important to investigate these features in detail. We have previously studied the particle size distribution, structure Thøgersen et al. (2009) and optical properties of colloidal Ag nanocrystals Thøgersen et al. (2011); Bonsak et al. (2011). These nanocrystals, however, must remain stable during solar irradiation and heat. In this paper we study the effect of solar irradiation on Ag nanocrystals on a carbon film, and investigate the growth rate and particle distribution with solar irradiation time.
II Experimental
The Ag nanocrystals were made by a wet chemical reduction synthesis mixing a silver nitrate solution (AgNO3, 99.9% purity, Qualigens Fine Chemicals) with a highly reducing solution of sodium borohydride (NaBH4, 95% purity, Merck) without further purification. All equipment was thoroughly cleaned by soaking in ethanol and washed with distilled water. A 0.6 mM AgNO3 precursor solution was prepared using deionized H2O, together with a 1.2 mM aqueous NaBH4 solution. In order to prevent agglomeration, the solutions were kept ice cold and the mixture was stirred continuously. Ag nanocrystals were formed by adding the aqueous AgNO3 drop by drop to the highly reducing solution of NaBH4. Variations in particle size and distribution were acquired by varying the amount of AgNO3 (aq) relative to NaBH4 (aq) in the final mixture. The samples studied in this work have a AgNO3/NaBH4 molar ratio of 2/25.
Six Transmission Electron Microscopy (TEM) samples were prepared by adding a drop of the final solution on a holy carbon film supported by a Cu grid. In order to observe light induced effects, five of the TEM samples were placed under a Xenon lamp, irradiating the wafers with an intensity of 100 mW/cm2 (1 Sun). While the samples started off at room temperature, the temperature slowly increased from 55.7∘C after 15 min. to 64.3∘C after 240 min. The lamp was placed 35 cm from the TEM sample grids. The remaining sample, which we shall refer to as sample 1, was kept aside. One by one the other samples are then taken away from the Xenon lamp, sample 2 after 15 min., sample 3 after 30 min., sample 4 after 60 min., sample 5 after 120 min., and finally sample 6 after 240 min. The Ag nanocrystals were then observed by High-Resolution Transmission Electron Microscopy in a 200 keV JEOL 2010F microscope with a Gatan imaging filter and detector.
III Theoretical
III.1 Ostwald ripening
Ostwald ripening is a thermodynamically-driven spontaneous process, in which small particles dissolve and through diffusion redeposit onto larger particles in an effort to decrease the total free surface energy.
While first qualitatively described by Ostwald Ostwald (1896, 1900), the theory made a major leap forward when Lifshitz and Slyozov Lifshitz and Slyozov (1961) and Wagner Wagner (1961) independently derived quantitative predictions about the distribution and evolution of the particle sizes. The LSW model, as it is now called, was derived under several assumptions, including:
-
1.
The particles are spherical.
-
2.
The distances between the particles are infinitely large compared to the size of the particles.
In practice, however, particles are not always spherical, and infinite distances are physically unrealistic; the discrepancy is characterized in terms of the volume fraction (or area fraction in 2D), which is defined as the volumetric density of the particles. It is therefore no surprise that the size distribution predicted by the LSW model corresponds to virtually none of the size distributions encountered in experiments, which are generally broader and more symmetric Voorhees (1985).
To address these shortcomings several extensions to positive volume fractions were proposed, including analytical calculations Yao et al. (1993) and numerical models Akaiwa and Voorhees (1994); Akaiwa and Meiron (1996), some extending to nonspherical particles Fan et al. (2002). For a comprehensive survey on the progress in Ostwald ripening theories, see the paper by Baldman Baldan (2002).
One common feature of these extensions is the prediction that the average particle radius follows the growth law
where is the average particle radius at , and the kinetic coefficient depends on the area fraction of the sample. Although almost always increases with , there are known situations where it decreases with instead Kim and Ardell (2000).
Since some of our particles become moderately aspherical over time, they do not have a well-defined radius. We simplify our analysis by assuming the particles are spherical, and then computing their diameter from the measured cross-sectional area from the formula . As the diameter of a spherical particle is twice its radius, we expect the average diameter to satisfy a growth law
| (1) |
Numerical simulations by Fan et al. Fan et al. (2002) suggest that
| (2) |
III.2 The log-normal distribution
In our previous work on the growth of colloidal Ag nanocrystals, the particle sizes were shown to be log-normally distributed Thøgersen et al. (2011). The discussion gave insight into the growth and structure of the formation process and provided a close fit with the experimental observations of the particle sizes.
The log-normal distribution with parameters and has probability density function
| (3) |
The parameters and coincide with the mean and standard deviation of the natural logarithm of the random variable , which is by definition normally distributed. The random variable itself has mean
| (4) |
and standard deviation
| (5) |
III.3 Parameter estimation
In our previous paper we chose to smoothen the overly erratic particle size densities by computing moving averages Thøgersen et al. (2011). Since there is no clear choice for the size of the sampling window for the data in this paper, we instead choose to group the diameters into bins of each 1 nm in width.
The probability that the random variable assumes a value between and is
Suppose now that sample comprises particles of which are of size between and . Then the log-likelihood is Raabe (1971)
| (6) |
The maximum likelihood estimators of are found by maximizing this expression numerically.
Plotting, for each sample, the mean nanocrystal diameter against the irradiation time suggests that there exists a relation (1) between these two quantities. For a set of uncorrelated data with varying uncertainties, as is the case here, it is unreasonable to assume that every data point should be treated equally in estimating an underlying relation. Instead, a best linear unbiased estimator is obtained by weighing each data point by the reciprocal of its variance Aitken (1935). This weighted least square method is well known, and was briefly described in a similar context in our previous work Thøgersen et al. (2011).
IV Results
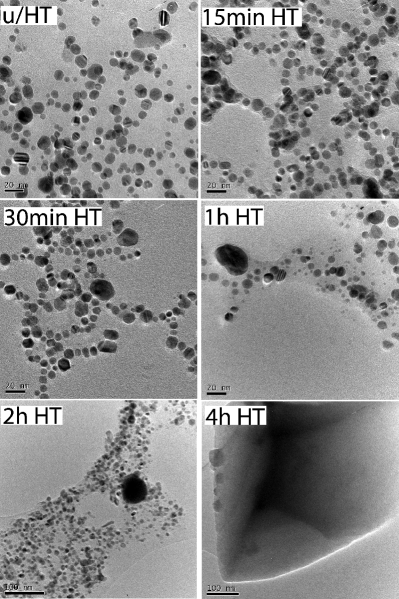
The size and shape of the particles has been studied with TEM, before and after solar irradiation. Initially the particles are spherical and small, with an average diameter of 6 nm. During the solar irradiation most of the particles grow, at the cost of the smaller particles. Some of the particles grow very large, the largest observed particle having a diameter of 638 nm after four hours of solar irradiation, and lose their spherical shape. Not all particles grow, however, as the sample irradiated for four hours still contains nanocrystals with the minimal observable diameter. Electron Energy Loss Spectroscopy revealed very little oxidation of the Ag nanocrystals. Only the outermost surface of the largest nanocrystals seems to be affected.
IV.1 Particle distribution
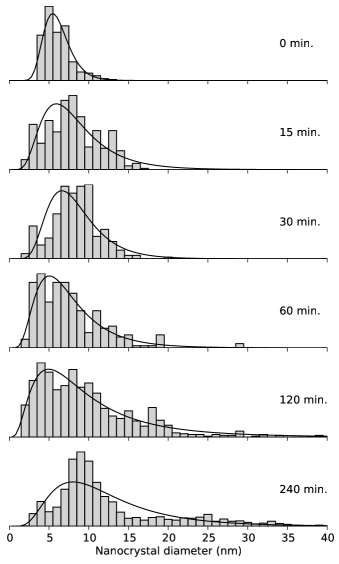
For each sample at least six TEM images were taken and analyzed; see Figure 1 for one image of each sample. The program ImageJ Schneider et al. (2012) was used to compute the area fractions in the samples, and to accurately count the particles and estimate their diameters. The average area fraction in each sample varied from 0.240 to 0.463, while the number of counted nanocrystals varied from 257 to 1499. Since the bigger nanocrystals in sample 6 (partially) overlap many of the smaller nanocrystals, the nanocrystals in these TEM images were separated manually before applying ImageJ. A qualitative check was carried out by manually measuring the diameters for a smaller number of representative nanocrystals. Figure 2 shows, for each sample, a histogram of the diameters, the bins being of 1 nm in width and centred at integral diameters.
Next, the maximum likelihood estimators are found by maximizing (6) numerically, and the mean and standard deviation are computed from (4) and (5). These values are listed in Table 1, and the estimated log-normal densities are plotted in Figure 2.
| 1 | 2 | 3 | 4 | 5 | 6 | |
| 0 | 15 | 30 | 60 | 120 | 240 | |
| 523 | 425 | 284 | 257 | 909 | 1499 | |
| 1.775 | 2.014 | 2.050 | 1.903 | 2.102 | 2.382 | |
| 0.279 | 0.487 | 0.401 | 0.535 | 0.708 | 0.547 | |
| 6.134 | 8.437 | 8.416 | 7.737 | 10.513 | 12.572 | |
| 1.743 | 4.362 | 3.515 | 4.453 | 8.480 | 7.425 |
IV.2 Particle growth
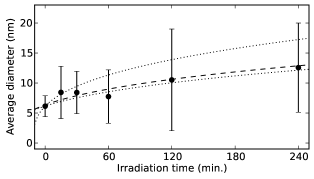
Table 1 suggests that the mean nanocrystal diameters grow with the irradiation time . For a quantitative analysis we plot these quantities against each other in Figure 3, with error bounds the corresponding standard deviations . Drawn dotted are the curves (1) corresponding to the minimal area fraction () and maximal area fraction (), with the empirical mean diameter of sample 1 and as in (2) predicted by the numerical simulation by Fan et al. Fan et al. (2002). Applying the weighted least square method, with weights the reciprocals of the variances , yields a fit of (1) with and . The corresponding curve is plotted (dashed) in the same figure.
V Discussion
V.1 Particle distribution
As shown in a previous work Thøgersen et al. (2011), the log-normal distribution provides a close fit for the diameters of the nanocrystals in sample 1. After irradiating the samples for various times, the log-normal distribution continues to be a good fit for the diameter distributions for samples 2 – 5. In sample 6 the log-normal distribution no longer provides a good fit, and the steady-state size distributions predicted by the Ostwald ripening model do not fit either. However, the peak is becoming more pronounced, and after scaling each empirical density by the average diameter, the tail seems to be moving inwards. These features are consistent with the system being in a transient state Snyder et al. (2001).
The evolution of the particle size distribution under the Ostwald ripening is notoriously slow, and the time required to reach a steady state generally depends on the initial distribution Chen and Voorhees (1993) and the area fraction Snyder et al. (2001). Compared to sample 1, the average diameter in sample 6 has changed by a factor of . This is typically too little to reach the steady state Snyder et al. (2001), another indication that the observed distribution is in a transient regime. More data, in particular data for longer irradiation times, are needed to confirm this phenomenon.
V.2 Particle growth
With longer solar irradiation the particles grow and become aspherical. Such aspherical particles are common for higher area fractions Fan et al. (2002). The growth of the average diameter of the nanocrystals fits the growth law (1) predicted by the Ostwald ripening model. Because the area fraction varies from sample to sample, the kinetic coefficient takes on different values as well. As can be seen in Figure 3, however, the least square estimate fits well between the corresponding range of kinetic coefficients predicted by Fan et al. Fan et al. (2002).
As seen in our previous work Thøgersen et al. (2011), the increase in particle size will yield an increase in the wavelength of maximum scattering. This will increase the efficiency of the device initially, since the nanocrystals investigated in that paper have a maximum scattering peak at relatively low wavelengths (e.g. nm in silicon nitride), whereas the optimal efficiency for the solar spectrum is attained above 600 nm, for instance at 700 nm. Since the device would be unstable, however, its efficiency would change with time and would eventually decrease again.
VI Conclusion
The effect of solar irradiation on Ag nanocrystals has been investigated by TEM and size distribution analysis. Solar irradiation causes the nanocrystals to grow and to lose their spherical shape. After four hours of solar irradiation, the largest observed particle has a diameter of 638 nm and is still surrounded by small nanocrystals. The average particle diameter can be approximately described by the growth law (1), with initial average diameter and kinetic coefficient , where is in nanometers and is in minutes. While the particle size distribution initially stays log-normal, it eventually starts to deviate from the log-normal distribution. The resulting distribution does not fit the steady-state distributions predicted by the Ostwald ripening model either, which might be explained by the system being in a transient state.
Acknowledgements
We are grateful to Jack Bonsak for making the colloidal silver particles, to Long-Qing Chen and Guang Sheng for providing numerical values of the kinetic coefficients, and to Chang Chuan You for supplying the temperature measurements with time.
References
- Malinsky et al. (2001) M. D. Malinsky, L. K. Kelly, G. C. Schatz, and R. P. V. Duyne, J. Am. Chem. Soc 123, 1471 (2001).
- Pillai et al. (2007) S. Pillai, K. R. Catchpole, T. Trupke, and M. A. Green, J. Appl. Phys. 101, 093105 (2007).
- Beck et al. (2009) F. J. Beck, A. Polman, and K. R. Catchpole, J. Appl. Phys. 105, 114310 (2009).
- Sileikaite et al. (2009) A. Sileikaite, I. Prosycevas, J. Puiso, A. Juraitis, and A. Guobiene, Mater. Sci. Medziagotyra 15, 21 (2009).
- Bonsak et al. (2011) J. Bonsak, J. Mayandi, A. Thøgersen, E. S. Marstein, and M. Umadevi, Phys. Status Solidi C 8, 924 (2011).
- Hofmeister et al. (2005) H. Hofmeister, M. Dubiel, G. Tan, and K. Schicke, Phys. Stat. Sol. 12, 2321 (2005).
- Thøgersen et al. (2009) A. Thøgersen, J. Bonsak, J. Mayandi, E. S. Marstein, and M. Umadevi, MRS Proceedings 1211, R11 (2009).
- Thøgersen et al. (2011) A. Thøgersen, J. Bonsak, C. H. Fosli, and G. Muntingh, J. Appl. Phys. 110, 044306 (2011).
- Ostwald (1896) W. Ostwald, Lehrbuch der Allgemeinen Chemie, vol. 2 (Leipzig, Germany, 1896).
- Ostwald (1900) W. Ostwald, Z Phys. Chem. 34, 495 (1900).
- Lifshitz and Slyozov (1961) I. Lifshitz and V. Slyozov, J. Phys. Chem. Solids Pergamon Press 19, 35 (1961).
- Wagner (1961) C. Wagner, Z Elektrochem 65, 581 (1961).
- Voorhees (1985) P. Voorhees, J. Statistical Physics 38, 231 (1985).
- Yao et al. (1993) J. H. Yao, K. R. Elder, H. Guo, and M. Grant, Phys Rev B 47, 14110 (1993).
- Akaiwa and Voorhees (1994) N. Akaiwa and P. Voorhees, Phys Rev E 49, 3860 (1994).
- Akaiwa and Meiron (1996) N. Akaiwa and D. I. Meiron, Phys Rev E 54, 13 (1996).
- Fan et al. (2002) D. Fan, S. Chen, L.-Q. Chen, and P. Voorhees, Acta Materialia 50, 1895 (2002).
- Baldan (2002) A. Baldan, J Mater Sci 37, 2171 (2002).
- Kim and Ardell (2000) D. Kim and A. Ardell, Scripta mater 43, 381 (2000).
- Raabe (1971) O. Raabe, Aerosol Science 2, 289 (1971).
- Aitken (1935) A. C. Aitken, Proceedings of the Royal Society of Edinburgh 55, 42 (1935).
- Schneider et al. (2012) C. A. Schneider, W. S. Rasband, and K. W. Eliceiri, Nature Methods 9, 671 (2012).
- Snyder et al. (2001) V. Snyder, J. Alkemper, and P. Voorhees, Acta mater 49, 699 (2001).
- Chen and Voorhees (1993) M. K. Chen and P. W. Voorhees, Modelling and Simulation in Materials Science and Engineering 1, 591 (1993).