Ab-initio transport fingerprints for resonant scattering in graphene
Abstract
We have recently shown that by using a scaling approach for randomly distributed topological defects in graphene, reliable estimates for transmission properties of macroscopic samples can be calculated based even on single-defect calculations [A. Uppstu et al., Phys. Rev. B 85, 041401 (2012)]. We now extend this approach of energy-dependent scattering cross sections to the case of adsorbates on graphene by studying hydrogen and carbon adatoms as well as epoxide and hydroxyl groups. We show that a qualitative understanding of resonant scattering can be gained through density functional theory results for a single-defect system, providing a transmission “fingerprint” characterizing each adsorbate type. This information can be used to reliably predict the elastic mean free path for moderate defect densities directly using ab-initio methods. We present tight-binding parameters for carbon and epoxide adsorbates, obtained to match the density-functional theory based scattering cross sections.
pacs:
71.15.Mb, 72.80.Vp, 75.75.-c, 72.22.PrI Introduction
Electron transport in graphene has been studied widely from different angles due to its fundamental and application-derived importance (for reviews, see Refs. Castro Neto et al., 2009 and Das Sarma et al., 2011). Depending on the nature of the graphene sample and the substrate on which transport is measured, different scattering mechanisms have been proposed. For graphene on SiO2, scattering from charges in the substrate is believed to be an important contribution.Zhang et al. (2009); Adam et al. (2007) On the other hand, resonant scattering from impurities, such as adsorbates and defects, can be large on a high- substrate and depend on the way the sample has been synthesized and cleaned.Giannazzo et al. (2011); Ferreira et al. (2011) We concentrate here on this latter case of resonant scattering. In addition to its importance for understanding the fundamental properties of experimental samples, which are seldom fully without adsorbed species, understanding resonant scattering might be relevant for the purposeful modification of graphene properties through functionalization.
Resonant scattering in graphene nanostructures is often studied numerically by a tight-binding model (TB) so that numerous calculations are performed for samples containing a set number of randomly placed defects. The results are then averaged in order to obtain for every defect concentration defect-specific properties, such as the elastic mean free path or the conductance, as a function of the charge carrier energy. This kind of ensemble averaging is a costly procedure even in the lightweight TB picture of the electronic structure. Therefore, based on prior work on electron transmission in silicon nanowires Markussen et al. (2007, 2010), we have recently applied the concept of energy-dependent scattering cross section to scale the transport properties of single defects to those of macroscopic samples with homogeneous defect concentrations.Uppstu et al. (2012)
The TB calculations can be parametrized based on the density functional theory (DFT) results or empirically based on experimental data. However, the modeling of defects beyond simple alterations in the topology, i.e. the modeling of impurities, chemical adsorbates or even carbon adatoms that create different bond configurations, becomes challenging since the parametrization should catch all the features of the chemical bonds relevant for the transport properties. A systematic determination of an adequate TB model is thus difficult and there are competing parametrization even for simple cases such as hydrogen.Wehling et al. (2010); Robinson et al. (2008) Therefore, in this work we study the determination of the effective scattering cross sections directly from the DFT results for systems containing only a single defect. We also show that the single defect scattering cross section can be used to determine the optimal TB model parameters for transport calculations. In this way we fit the TB parameters using a quantity directly related to the resonant electron scattering by the defect in question.
First, we study hydrogen atoms and hydroxyl groups which are adsorbed on top of a carbon atom. The hydrogen atom is a good test case because there are different TB models to describe it and we can compare results given by them with DFT results. The adsorption of the hydroxyl group increases the complexity from that of the hydrogen atom and the DFT results for the scattering cross section show clear deviation from the hydrogen case. Oxygen is adsorbed in the form of epoxide on the carbon-carbon bridge which also increases the complexity of the chemical bonding. We compare the DFT results with those of a recent TB parametrization Leconte et al. (2011); Cresti et al. (2011) and find out that the scattering cross sections from these two methods match apart from some details in regions of rapid variations. We show that these details can be improved by optimizing the TB parameters.
Furthermore, we present a TB model for a carbon adatom bound to the carbon-carbon bridge. The parameters are obtained by optimizing the TB scattering cross section to match the corresponding DFT prediction.
All the adsorbates we study are important from the experimental point of view and have potential for technological applications. Hydrogen is an important functionalizer that turns graphene into graphane, a band insulator, at full coverage.Sofo et al. (2007); Elias et al. (2009) At lower coverage, evidence for metal-insulator transition has been seen.Bostwick et al. (2009) Oxygen can break graphene sheets or unzip carbon nanotubes to GNRs.Xu and Xue (2010); Sun and Fabris (2012) Epoxide is also a component of graphene oxide,Boukhvalov and Katsnelson (2008); Yan et al. (2009) which has been used for graphene synthesisPark and Ruoff (2009) and sensor applications.Robinson et al. (2008); Lu et al. (2009) Carbon adatoms, on the other hand, are created during irradiation of graphene, e.g., when intentionally creating vacancy and bond rotation defects.Banhart et al. (2011)
The organization of the paper is as follows. In Sec. II, we describe the electronic structure models and methods used and review the main ideas for the the scattering cross section concept. In Sec. III, we study the effect of different approximations on the scattering cross section for the atop-adsorbed hydrogen and hydroxyl as test cases. In Sec. IV, we concentrate on the effect of the adsorbate chemistry by presenting results for oxygen and adatom carbon preferring bridge-site adsorption.
II Method
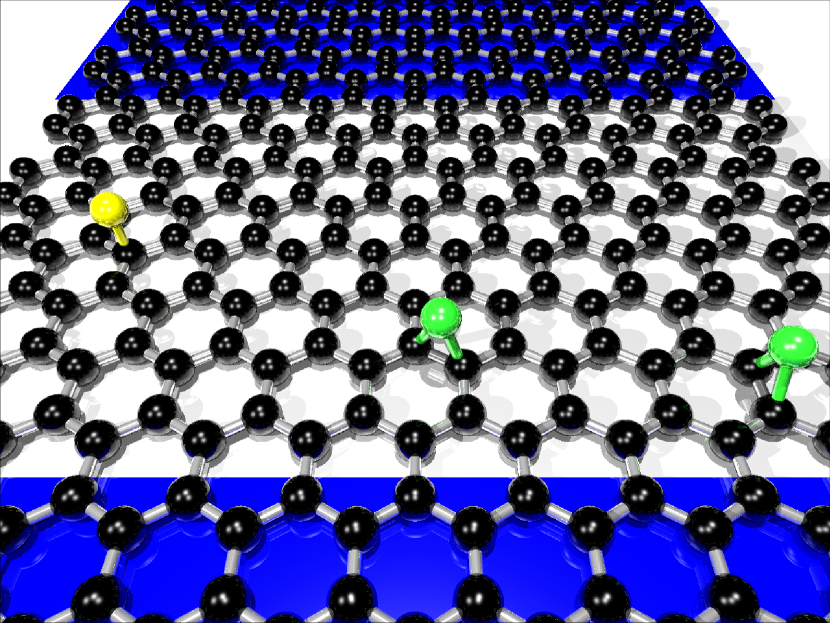
Figure 1 shows the schematic setup for a two-probe transport calculation. The current flows between the shaded leads. The graphene sheet is oriented so that the armchair edge is parallel to the transport direction. The ribbons we study are thus armchair graphene nanoribbons (AGNR), and we restrict our DFT calculations to shown ribbons with 23 carbon dimer lines (23-AGNR).
The transmission through the ribbon or sheet is affected by the scattering of electrons off adsorbates and studied by the “standard” setup for ab-initio transport calculations, i.e., the combination of DFT and nonequilibrium Green’s functions (NEGF).Haug and Jauho (2008) We use the transiesta implementation, a part of the siesta DFT package.Soler et al. (2002); Brandbyge et al. (2002)
We compare the full ab-initio approach with the widely-used nearest-neighbor TB model of graphene. The TB approach is based on the Hamiltonian
| (1) |
where the sum is taken over the nearest neighbor pairs and the nearest neighbor hopping element is eV. An ideal (unrelaxed) vacancy can be described simply by removing the hopping elements to a particular carbon site. This is also the simplest model for a hydrogen adatom on top of a carbon atom since it describes the removal of the carbon -bond due to the creation of a carbon-hydrogen bond.
In order to more realistically describe an adatom on top of a carbon atom, the simple TB model can be complemented by an Anderson impurity level added to the Hamiltonian in (1), i.e.,
| (2) |
where the carbon atom with the index is coupled with hopping to the impurity level with energy . This simple and versatile model has been widely used to model hydrogen and various other adsorbates, such as the hydroxyl group and hydrocarbons, that bind on top of a carbon atom. Robinson et al. (2008); Wehling et al. (2010); Yuan et al. (2010) For hydrogen, the parameters giving results corresponding well to DFT calculationsWehling et al. (2010) are and though other values have also been proposed.Robinson et al. (2008)
In our DFT calculations, we use the double polarization (DZP) basis set for relaxing the structures with the Broyden algorithm so that ionic forces are less than 0.04 eV/Å. We use the PBE functional for exchange and correlation.Perdew et al. (1996) The basis set is automatically constructed by siesta based on an energy shift of 80 meV and a split norm of 0.3 for all elements apart from hydrogen for which 0.5 is used. The grid interval corresponding to the Fourier cutoff energy of 250 Ry is used for the real-space grid. The periodic images are separated by 19 Å of vacuum. These parameters lead to a graphene lattice constant of 1.43 Å which is used in all the calculations. For transport the basis set is decreased to the single polarization (SZP) and the grid to 150 Ry.
In addition to nanoribbons, we study the transmission through periodic systems, i.e., graphene sheets. The sheets are oriented so that the transport is along the armchair direction. The system sizes are chosen so that the scattering cross section defined below is well-converged requiring the supercells to correspond to nanoribbons from 24-AGNR to 32-AGNR depending on the adsorbate studied. The periodicity is handled by a Monkhorst-Pack k-point sampling perpendicular to the current direction, with 3 to 6 k-points used for relaxation and 21 to 45 for transport.
Following Refs. Uppstu et al., 2012 and Markussen et al., 2010, we define the scattering cross section:
| (3) |
where is the lateral width of the supercell for periodic graphene or the width of the nanoribbon for GNRs. is the transmission through the pristine system without a defect and is the transmission through the defect averaged over the defect locations and orientations. The scattering cross section is a rather abstract quantity. Based on it, we can however produce estimates for the transmission through a defective sample with some finite defect density. For a sample of length with different defect species with scattering cross sections and densities we get
| (4) |
within the Ohmic regime. We can also estimate quantities that can be directly experimentally measured. The elastic mean free path, for example, is given by
| (5) |
Both equation (3) and (4) are defined within the Ohmic regime where the transmissions can be averaged directly as the transmission has a Gaussian probability distribution. The cross section can, however, also be defined within the localized regime, as was done in our previous work.Uppstu et al. (2012) This is seldom needed for cross sections based on single defect calculations and we concentrate on the Ohmic regime here.
One weakness of using the scaling approach in this manner is that we are assuming a random distribution of absorbents on graphene. If this is not the case and the disorder is correlated, the approach loses some of its validity. Indeed, there are indications that oxygen adsorbates, for example, tend to favor clustering since this is preferred energetically. Yan et al. (2009) Correlation between Coulombic scatterers, on the other hand, can be used to explain the transport properties of graphene samples with no resonant scattering. Li et al. (2011)
DFT can be used to study spin-polarized transport and thus could be used to calculate a spin-dependent scattering cross section. All our calculations, however, are done spin-compensated despite the fact that some of the systems we study in fact have a finite magnetic moment in the ground state. The addition of spin-dependence would make the analysis of disordered systems much more complicated since long-range ordering of the spins is likely.Soriano et al. (2011); Leconte et al. (2011) We also consider just armchair ribbons since zigzag ribbons have spin polarized edges. Adding spin-polarization to the calculations would split the resonance peaks at the Fermi energy into two closely spaced spin-polarized peaks.Yazyev and Helm (2007) The scattering cross section for the both spin-channels would then be very similar to the spin-compensated cross sections presented here.
III Atop adsorbates: the atomic hydrogen and hydroxyl group
To test the sensitivity of determining the adsorbate scattering cross sections on electronic-structure models and nanoribbon or bulk graphene geometries used, we first consider perhaps the simplest conceivable case, the hydrogen atom. This system is convenient since, as shown below, the TB model is enough to capture all the relevant physics with limited computational resources and even very large system sizes directly relevant to experiments can be studied.
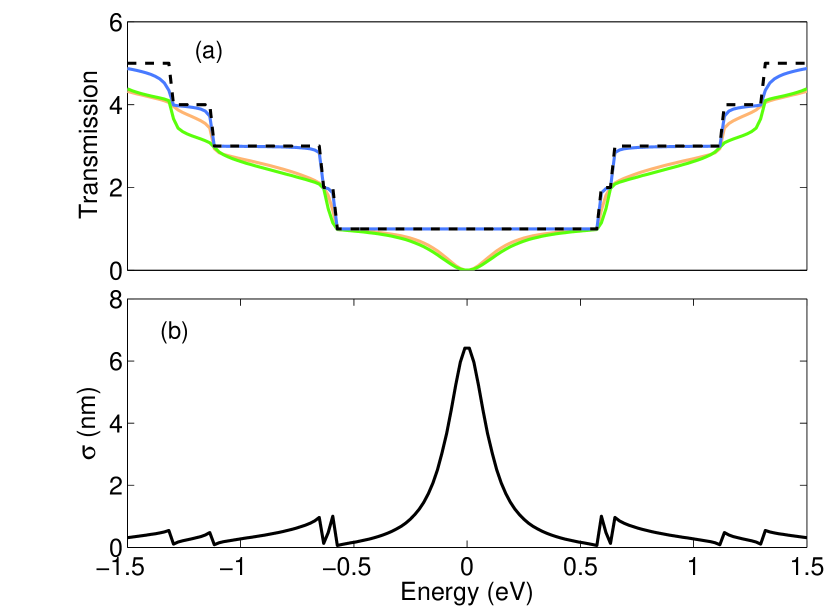
As discussed above, the simplest TB model for hydrogen on graphene treats it as a vacancy. This is actually quite a poor model for a real vacancy since it does not account for the relaxation caused by the reorganization of the dangling bonds.Banhart et al. (2011) Figure 2 (a) shows the electron transmissions for a pristine 23-AGNR and for a 23-AGNR with an adsorbed hydrogen in three different locations calculated with the vacancy TB model. Two of the three latter transmissions are very similar, with a dip right in the middle of the first transmission plateau at the Fermi energy while for one adsorbate location there is no dip. This is a general feature for metallic armchair nanoribbons: when hydrogen is adsorbed on a dimer indexable by 3N, backscattering is suppressed due to the electronic structure of the ribbon.Deretzis et al. (2010); Choe et al. (2010) Therefore the results for AGNRs shown below are calculated with Eq. (3) by averaging over all different adsorption sites. As an example of this, Fig. 2 (b) shows the scattering cross section for the hydrogen adsorbate. The clearest feature is the strong peak at the Fermi energy that is caused by a resonant level at that energy and also shows up in the density of states. The other characteristic feature is the spikes further away from the Fermi level. They are due to the density of states van Hove singularities caused by the band edges of the quasi one-dimensional system.
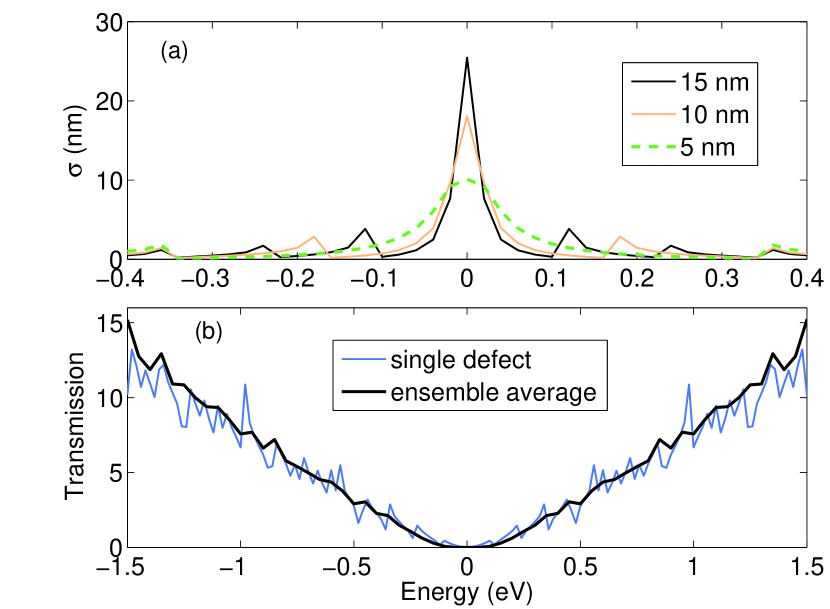
Ideally, we would like to go from the scattering cross section of a narrow ribbon calculated using a full DFT approach by scaling to wider and longer systems using Eq. (4). Unfortunately, the details of the scattering cross section depend on the width of the nanoribbon. This is shown in Fig. 3 (a) for the case of a hydrogen atom adsorbed on AGNRs of different width. The vacancy-model TB results indicate that the actual positions of the van Hove peaks depend on the ribbon width and that the central peak becomes thinner and higher as the ribbon width increases. It is however clear that it is possible to get a good qualitative understanding of the transmission for wider ribbons based on the scattering cross section calculated for a narrow ribbon.
Figure 3 (b) shows the use of Eq. (4) by comparing an estimate based on the scattering cross section from a single defect calculation to an averaged transmission through a 100 nm long 125-AGNR. As long as the transmission is large enough, a very good estimate for the transmission through the longer sample can be generated. Close to the Fermi energy, the transmission is within the localized regime and the estimate based on Ohmic transmission (Eq. 4) is larger than the average. Although here we concentrate on the Ohmic regime, the localized regime can also be treated within the scattering cross section approach as shown in our previous work.Uppstu et al. (2012)
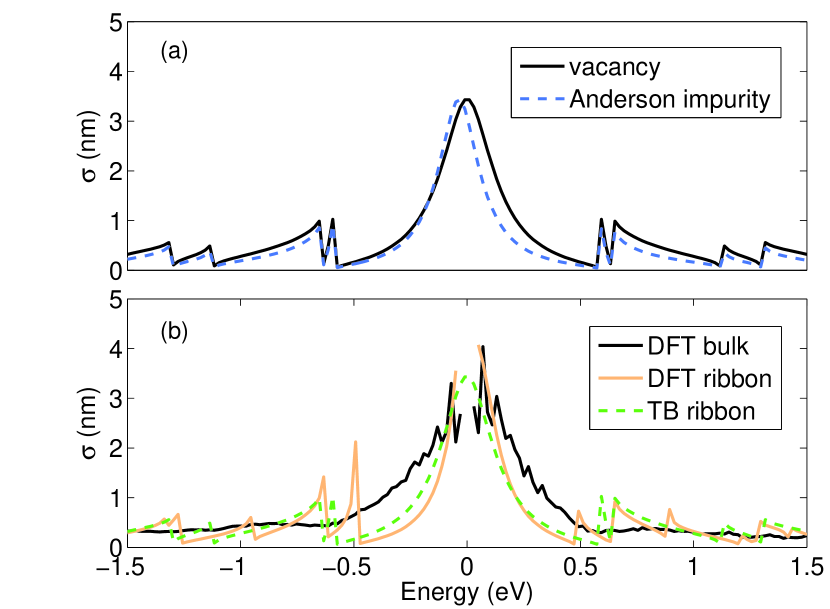
The vacancy TB model does not directly correspond to a real monovacancy or a hydrogen adsorbate. For comparison we have used also the impurity-model of Eq. (2). Figure 4 (a) shows the calculated scattering cross sections for a 23-AGNR with one adsorbed hydrogen atom. In this case, the cross section from the impurity Hamiltonian is quite close to that from the vacancy-model. The impurity-model results in a slight asymmetry and shift with respect to the vacancy-model. Thus, the simpler vacancy-model seems to give a quite adequate scattering cross section for the adsorbed hydrogen.
The great advantage of the scattering cross section formalism is that it makes possible to study scattering in a fully ab-initio manner, based directly on DFT transport calculations. However, dealing with graphene nanoribbons requires still a remarkable amount of computational time because all the different adsorbate locations across the ribbon need to be solved self-consistently including the lattice relaxation prior to the transport calculation. Moreover, the separate DFT calculations are limited to rather small ribbons, typically below 5 nm in width. We can, however, significantly lower the computational cost by studying the scattering cross sections of bulk systems, that is, systems with periodic boundary conditions perpendicular to the transport direction.
Figure 4 (b) shows the scattering cross section for a hydrogen atom on a 23-AGNR calculated both within the DFT and TB schemes. The quite close correspondence indicates that the simple TB model is quite suitable for simple adsorbates, such as hydrogen, that bind on top of a carbon atom. The cross section for a hydrogen atom in bulk graphene, obtained by imposing periodic boundary conditions as described above, is also shown. In the bulk geometry, the van Hove singularities are smoothed out and the central peak is correspondingly broadened. The same considerations thus apply here as for the vacancy hydrogen model discussion relating to Fig. 3: a good qualitative understanding is possible based on a bulk DFT scattering cross section but some of the details are necessarily lost when translating from the infinite bulk system to a ribbon.
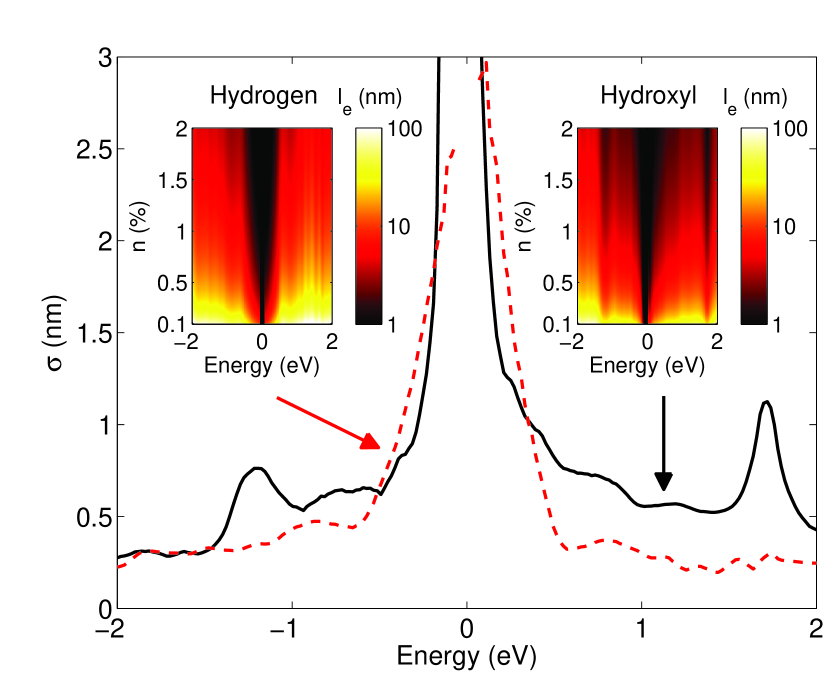
As an example of atop adsorption in which the details of the chemical bonding become important and the vacancy TB model cannot predict the scattering cross section accurately enough, we consider the hydroxyl (OH) group. We perform a DFT bulk calculation for the adsorbed OH and compare the cross section with that for adsorbed hydrogen. Figure 5 shows that although both adsorbates create a prominent resonance close to the Dirac point, hydroxyl adsorption results in a more asymmetric central peak and additional smaller resonances farther away from the Dirac point. These features serve as the distinguishable fingerprints between hydrogen and hydroxyl. This shows the usefulness of the scattering cross section as a scattering fingerprint, the bulk cross section especially depends only on the adsorbate species and has a characteristic shape for each adsorbate. The insets in Fig. 5 show the estimated elastic mean free paths for the hydrogen and hydroxyl adsorbates, based on the single-defect cross sections. Even small concentrations of such adsorbates lead to very short mean free paths close to the Dirac point, and the effects of the side peaks in the scattering cross section can also be clearly seen.
IV Bridge adsorbates: epoxide and carbon adatom
We now turn to the more complicated case of bridge-bonded adsorbates. As previously, when defect-defect interactions are negligible, a single-defect DFT calculation may be used to estimate the mean free path of a large-scale system. However, with large concentrations of defects, the scatterers start to interact, and to capture these effects large-scale calculations are needed. These are most conveniently done using the TB method, which is able to simulate systems with large numbers of adsorbates. The TB model parameters can be optimized against the corresponding DFT-based single-defect scattering cross section. Here we present optimized TB parameters for epoxide and carbon adsorbates.
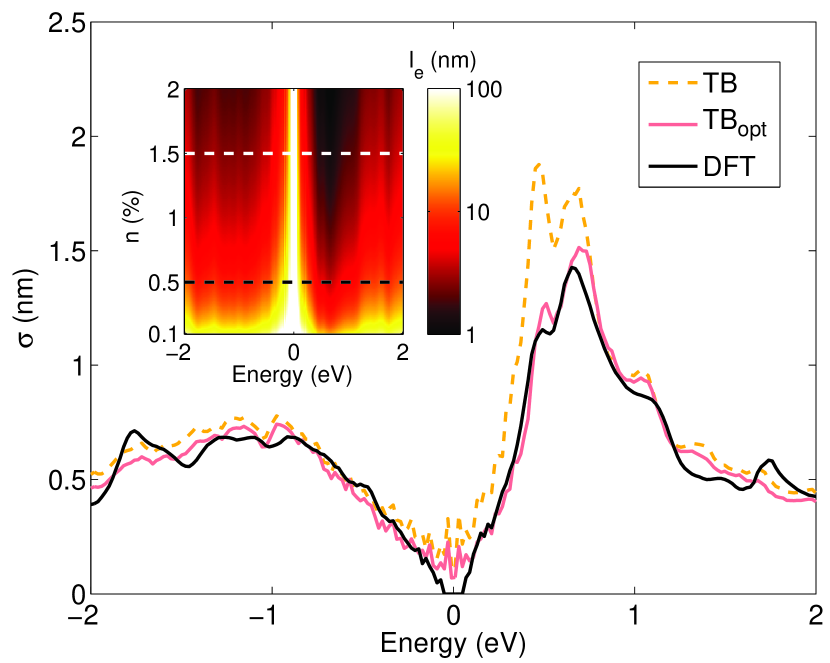
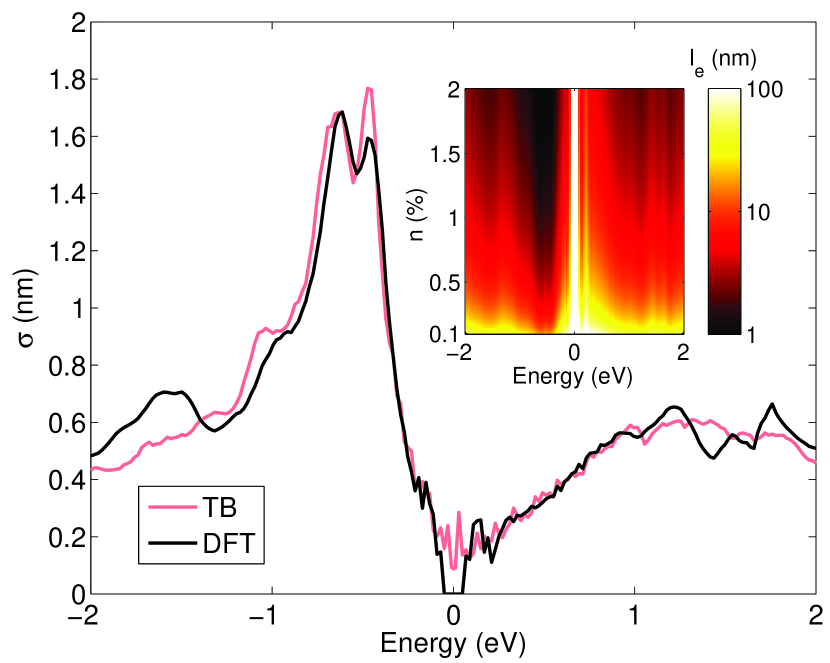
Oxygen preferably binds to graphene on the bridge site between carbon atoms and forms an epoxide group. Figure 6 shows the scattering cross section calculated for epoxide on bulk graphene. Unlike the case of hydrogen, there are now three different bridge sites with respect to electron current direction and one needs to average the scattering cross section over them. The most prominent feature of the scattering cross section is the peak above the Fermi energy, corresponding to the oxygen acceptor state in the density of states. This quasi-localized state couples with the electronic states of graphene causing increased scattering for electrons as compared to holes. This is also reproduced by two different sets of TB results, also presented in Fig. 6. The yellow (light grey) curve has been obtained by using the parameters from Ref. Leconte et al., 2010, but the agreement between TB and DFT can be improved by optimizing the parameters to better match the scattering cross section. The optimized parameter set is eV, eV, eV, , , and (for notation, see Fig. 7). In agreement with Ref. Leconte et al., 2010, we have used eV. The resulting cross section is shown by the red (dark grey) curve in Fig. 6. As can be seen, the main resonance is captured more accurately by the optimized model. However, additional small resonances close to eV are not reproduced. These are better seen in the inset, which shows the DFT-based elastic mean free path for different concentrations of epoxide adsorbates. Away from the Dirac point, the most prominent feature is located roughly at 0.6 eV, where the resonance produces a clear drop in . This agrees very well with Kubo-Greenwood calculations.Leconte et al. (2011); Cresti et al. (2011)
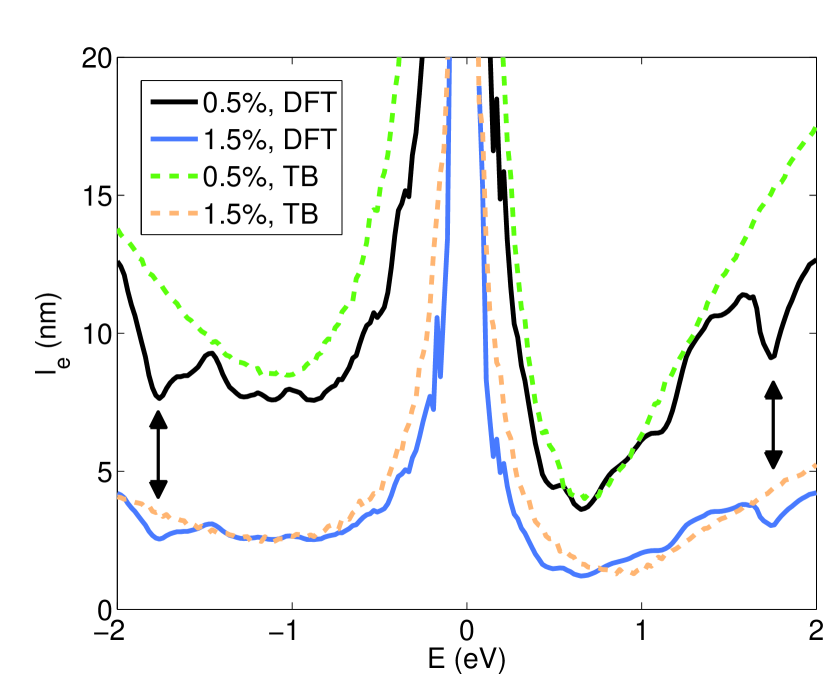
The DFT estimates of are directly based on the scattering cross section of Fig. 6 and the use of Eq. (5). To test the validity of this procedure, we have performed large-scale TB simulations of systems with defect concentrations of 0.5 and 1.5 % (these values correspond to the dashed lines in the inset of Fig. 6), by ensemble-averaging the results over different configurations of adsorbate locations. The calculations have been performed using a 12 nm 32 nm unit cell and an ensemble size of 50. Results obtained through this procedure are compared with DFT predictions in Fig. 8. In general, the results agree fairly well, indicating that the transport properties of a large-scale system with a moderate concentration of adsorbates can be reliably estimated based on only a single-defect calculation. No intermediate steps are needed for this procedure, and DFT can thus be directly used to calculate various transport-related properties.
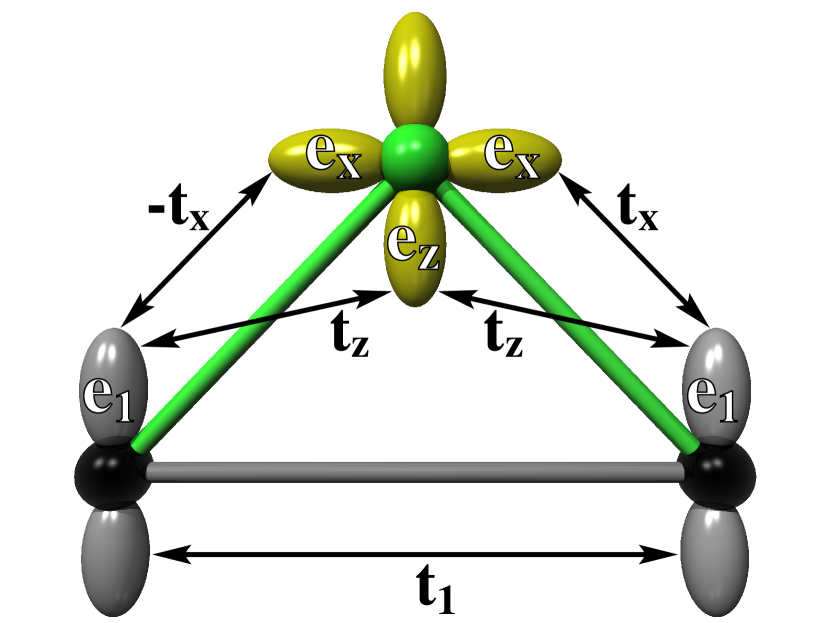
Carbon binds to graphene, like oxygen, on the carbon-carbon bridge.Lehtinen et al. (2004); Nordlund et al. (1996) The electronic properties of the carbon adsorbate are quite different from those of the epoxide adsorbate, which is reflected in the clearly different scattering cross sections. Indeed, Fig. 9 shows that the characteristic scattering fingerprint in the bulk scattering cross section mirrors intriguingly the epoxide case with a peak below the Fermi level. This feature is a direct result of the bond below the Fermi level. We are not aware of previous TB parameters for the carbon adsorbate, so we have optimized the same set of parameters as used above for epoxideLeconte et al. (2010) by matching the scattering cross sections. The optimized parameters, using the same notation as in the oxygen case, are eV, eV, eV, , , and . Here we again use eV. As can be seen in Fig. 9, by using these parameters the TB result matches very well with the DFT-based cross section, apart from minor differences at large energies. As in the case of epoxide, the elastic mean free path shows a clear asymmetry between positive and negative energies. Furthermore, it is important to note that both bridge adsorbates scatter charge carriers mainly at finite energies, whereas the atop adsorbates cause very strong scattering close to the Dirac point.
V Summary and conclusions
The scaling approach using defect-specific energy dependent scattering cross sections enables the modeling of electronic transport properties of device-scale graphene systems with homogeneous defect distributions. The idea is that the scattering cross section can be determined on the basis of an electron transport calculation for a finite system containing a single defect. In this work, we have studied the sensitivity of determining the cross section on the different electronic structure methods (DFT and TB) and different system geometries (bulk graphene and graphene nanoribbons). We have found that a carefully constructed TB model works well for various different adsorbates. Furthermore, the scattering cross section is an useful quantity in validating the TB model, and can even be used to optimize the model parameters, as we have shown above for the case of the bridge-carbon.
The scattering cross section provides a fingerprint which can be used to categorize and compare different defects, especially adsorbate species. An adsorbed hydrogen causes a strong peak in the cross section at the Fermi level and the hydroxyl group exhibits also less intense but clear peaks below and above the Fermi level. Both the hydrogen and hydroxyl adsorb on top of a carbon atom. Oxygen in the form of epoxide and carbon adatoms bind to two carbon atoms at the bridge position. In the case of epoxide the scattering cross section indicates that electrons are scattered more readily than holes, while for carbon adatoms the opposite is true.
Acknowledgements.
This research has been supported by the Academy of Finland through its Centers of Excellence Program (project no. 251748). Computational resources were provided by CSC–IT Center for Science Ltd and the Aalto Science-IT project.References
- Castro Neto et al. (2009) A. H. Castro Neto, F. Guinea, N. M. R. Peres, K. S. Novoselov, and A. K. Geim, Rev. Mod. Phys., 81, 109 (2009).
- Das Sarma et al. (2011) S. Das Sarma, S. Adam, E. Hwang, and E. Rossi, Rev. Mod. Phys., 83, 407 (2011).
- Zhang et al. (2009) Y. Zhang, V. W. Brar, C. Girit, A. Zettl, and M. F. Crommie, Nat. Phys., 5, 722 (2009).
- Adam et al. (2007) S. Adam, E. H. Hwang, V. M. Galitski, and S. Das Sarma, Proc. Natl. Acad. Sci. U.S.A., 104, 18392 (2007).
- Giannazzo et al. (2011) F. Giannazzo, S. Sonde, R. Lo Nigro, E. Rimini, and V. Raineri, Nano Lett., 11, 4612 (2011).
- Ferreira et al. (2011) A. Ferreira, J. Viana-Gomes, J. Nilsson, E. R. Mucciolo, N. M. R. Peres, and A. H. Castro Neto, Phys. Rev. B, 83, 165402 (2011).
- Markussen et al. (2007) T. Markussen, R. Rurali, A.-P. Jauho, and M. Brandbyge, Phys. Rev. Lett., 99, 076803 (2007).
- Markussen et al. (2010) T. Markussen, R. Rurali, X. Cartoixà, A.-P. Jauho, and M. Brandbyge, Phys. Rev. B, 81, 125307 (2010).
- Uppstu et al. (2012) A. Uppstu, K. Saloriutta, A. Harju, M. Puska, and A.-P. Jauho, Phys. Rev. B, 85, 041401 (2012).
- Wehling et al. (2010) T. O. Wehling, S. Yuan, A. I. Lichtenstein, A. K. Geim, and M. I. Katsnelson, Phys. Rev. Lett., 105, 056802 (2010).
- Robinson et al. (2008) J. P. Robinson, H. Schomerus, L. Oroszlány, and V. I. Fal’ko, Phys. Rev. Lett., 101, 196803 (2008).
- Leconte et al. (2011) N. Leconte, A. Lherbier, F. Varchon, P. Ordejon, S. Roche, and J.-C. Charlier, Phys. Rev. B, 84, 235420 (2011a).
- Cresti et al. (2011) A. Cresti, A. López-Bezanilla, P. Ordejon, and S. Roche, ACS Nano, 5, 9271 (2011).
- Sofo et al. (2007) J. O. Sofo, A. S. Chaudhari, and G. D. Barber, Phys. Rev. B, 75, 153401 (2007).
- Elias et al. (2009) D. C. Elias, R. R. Nair, T. M. G. Mohiuddin, S. V. Morozov, P. Blake, M. P. Halsall, A. C. Ferrari, D. W. Boukhvalov, M. I. Katsnelson, A. K. Geim, and K. S. Novoselov, Science, 323, 610 (2009).
- Bostwick et al. (2009) A. Bostwick, J. L. McChesney, K. V. Emtsev, T. Seyller, K. Horn, S. D. Kevan, and E. Rotenberg, Phys. Rev. Lett., 103, 056404 (2009).
- Xu and Xue (2010) Z. Xu and K. Xue, Nanotechnology, 21, 45704 (2010).
- Sun and Fabris (2012) T. Sun and S. Fabris, Nano Lett., 12, 17 (2012).
- Boukhvalov and Katsnelson (2008) D. W. Boukhvalov and M. I. Katsnelson, J. Am. Chem. Soc., 130, 10697 (2008).
- Yan et al. (2009) J.-A. Yan, L. Xian, and M. Y. Chou, Phys. Rev. Lett., 103, 86802 (2009).
- Park and Ruoff (2009) S. Park and R. S. Ruoff, Nat. Nanotechnol., 4, 217 (2009).
- Lu et al. (2009) G. Lu, L. E. Ocola, and J. Chen, Nat. Nanotechnol., 94, 83111 (2009).
- Banhart et al. (2011) F. Banhart, J. Kotakoski, and A. V. Krasheninnikov, ACS Nano, 5, 26 (2011).
- Haug and Jauho (2008) H. Haug and A.-P. Jauho, Quantum Kinetics in Transport and Optics of Semiconductors, 2nd ed., Springer Series in Solid State Sciences, Vol. 123 (Springer-Verlag, 2008).
- Soler et al. (2002) J. M. Soler, E. Artacho, J. D. Gale, A. García, J. Junquera, P. Ordejón, and D. Sánchez-Portal, Journal of Physics: Condensed Matter, 14, 2745 (2002).
- Brandbyge et al. (2002) M. Brandbyge, J.-L. Mozos, P. Ordejón, J. Taylor, and K. Stokbro, Phys. Rev. B, 65, 165401 (2002).
- Yuan et al. (2010) S. Yuan, H. De Raedt, and M. I. Katsnelson, Phys. Rev. B, 82, 115448 (2010).
- Perdew et al. (1996) J. P. Perdew, K. Burke, and M. Ernzerhof, Phys. Rev. Lett., 77, 3865 (1996).
- Li et al. (2011) Q. Li, E. H. Hwang, E. Rossi, and S. Das Sarma, Phys. Rev. Lett., 107, 156601 (2011).
- Soriano et al. (2011) D. Soriano, N. Leconte, P. Ordejón, J.-C. Charlier, J.-J. Palacios, and S. Roche, Phys. Rev. Lett., 107, 016602 (2011).
- Leconte et al. (2011) N. Leconte, D. Soriano, S. Roche, P. Ordejon, J.-C. Charlier, and J. J. Palacios, ACS Nano, 5, 3987 (2011b).
- Yazyev and Helm (2007) O. V. Yazyev and L. Helm, Phys. Rev. B, 75, 125408 (2007).
- Deretzis et al. (2010) I. Deretzis, G. Fiori, G. Iannaccone, and A. La Magna, Phys. Rev. B, 81, 085427 (2010).
- Choe et al. (2010) D. H. Choe, J. Bang, and K. J. Chang, New J. Phys., 12, 125005 (2010).
- Leconte et al. (2010) N. Leconte, J. Moser, P. Ordejón, H. Tao, A. Lherbier, A. Bachtold, F. Alsina, C. M. Sotomayor Torres, J.-C. Charlier, and S. Roche, ACS Nano, 4, 4033 (2010).
- Lehtinen et al. (2004) P. O. Lehtinen, A. S. Foster, Y. Ma, A. V. Krasheninnikov, and R. M. Nieminen, Phys. Rev. Lett., 93, 187202 (2004).
- Nordlund et al. (1996) K. Nordlund, J. Keinonen, and T. Mattila, Phys. Rev. Lett., 77, 699 (1996).