The magnetic structure of bixbyite -Mn2O3: a combined density functional theory DFT+U and neutron diffraction study
Abstract
First principles density functional theory DFT+U calculations and experimental neutron diffraction structure analyses were used to determine the low-temperature crystallographic and magnetic structure of bixbyite -Mn2O3. The energies of various magnetic arrangements, calculated from first principles, were fit to a cluster-expansion model using a Bayesian method that overcomes a problem of underfitting caused by the limited number of input magnetic configurations. The model was used to predict the lowest-energy magnetic states. Experimental determination of magnetic structure benefited from optimized sample synthesis, which produced crystallite sizes large enough to yield a clear splitting of peaks in the neutron powder diffraction patterns, thereby enabling magnetic-structure refinements under the correct orthorhombic symmetry. The refinements employed group theory to constrain magnetic models. Computational and experimental analyses independently converged to similar ground states, with identical antiferromagnetic ordering along a principal magnetic axis and secondary ordering along a single orthogonal axis, differing only by a phase factor in the modulation patterns. The lowest-energy magnetic states are compromise solutions to frustrated antiferromagnetic interactions between certain corner-sharing [MnO6] octahedra.
Introduction
Manganese is a multivalent element. Each valence state has a characteristic oxide or oxides. Mn ion magnetism and electron correlations of Mn states make it challenging to accurately determine the electronic structure of Mn oxides using the density functional theory (DFT) approach. Franchini et al.Franchini et al. (2007) explored various manganese oxides using DFT and showed that the electronic structure as well as the magnetic ground state depend sensitively on the details of the DFT calculation, such as the exchange-correlation functional used.
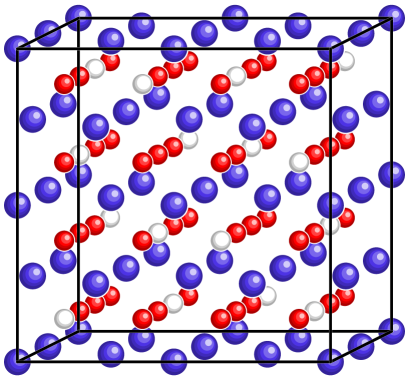
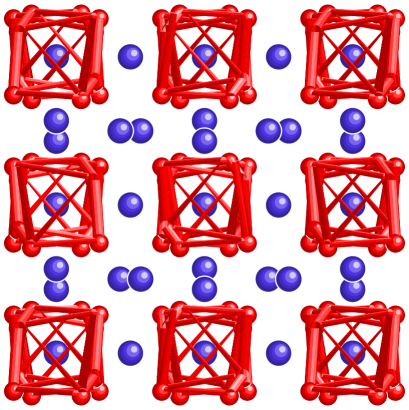
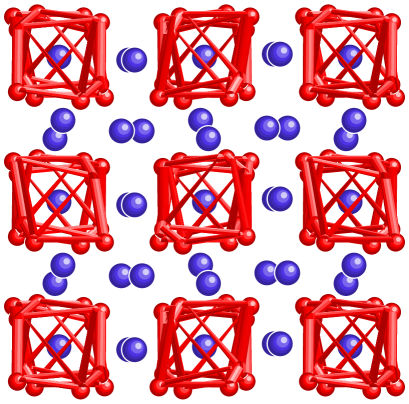
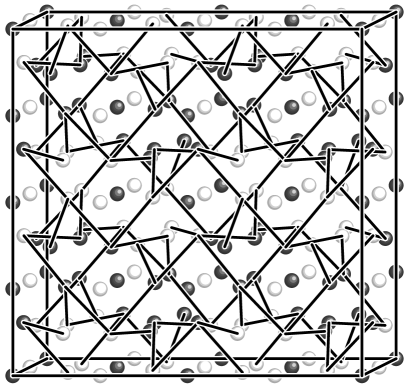
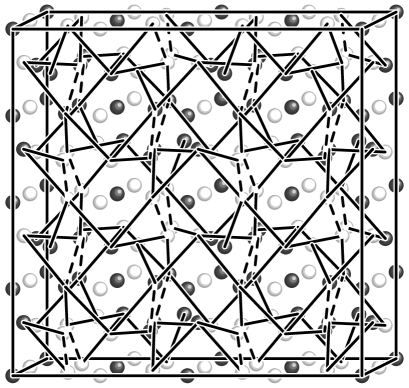
The -Mn2O3 phase, with the bixbyite structure, is particularly challenging to model because of its complicated, and not yet completely solved, magnetic structure. In the bixbyite structure (Fig. 1), the Mn3+ ions are octahedrally coordinated, while the O ions have 4 Mn neighbors. The bixbyite structure can be viewed as a close-packed lattice of Mn with O ions filling 3/4 of the tetrahedral interstitials in a pattern with symmetry. Below about 300 K, -Mn2O3 transforms from cubic to an orthorhombic structure with symmetryHellwege and Hellwege (1975). Experimentally, the lattice parameters (,,) saturate at low temperatures to approximately = 9.41 Å, = 9.45 Å, and = 9.37 Å (Refs. Geller and Espinosa, 1970; Hellwege and Hellwege, 1975; foo, a). GellerGeller (1971) rationalized the low-temperature orthorhombic distortion of bixbyite as a consequence of a Jahn-Teller instability of [MnO6] octahedra toward elongation along any one of the three Cartesian axes. In the cubic bixbyite phase, 24 of 32 Mn atoms exhibit distorted coordination whereas the remaining 8 Mn atoms, which occupy fixed-coordinate high-symmetry positions, retain regular coordination environments. The orthorhombic phase accommodates Jahn-Teller distortion of the remaining 8 octahedra (see Fig. 2-Fig. 3).
The magnetic structure of Mn2O3 has long been of interest, but it is not completely solved. Computationally, Franchini et al. found a preference for either antiferromagnetic or ferromagnetic ordering in -Mn2O3, depending on the type of DFT exchange-correlation functional usedFranchini et al. (2007). Experimentally, Regulski et al.Regulski et al. (2004) found evidence for various antiferromagnetic ordering transitions within the orthorhombic phase, which occur without any apparent change in symmetry.
Grant et al.Grant et al. (1968) suggested that the magnetic ordering of orthorhombic -Mn2O3 can be predicted from the cubic symmetry because the orthorhombic distortion is small. They proposed a non-collinear ordering model with magnetic moments on the Mn 8() sites (4() and 4() in ) aligned with the body diagonals of the pseudo-cubic cell and those on the Mn 24() sites (8() in ) directed perpendicular to one of the two orthogonal 21 screw axes passing through each 24() site. However, Regulski et al. demonstrated that this model is incompatible with the neutron powder diffraction dataRegulski et al. (2004). They further identified an alternative, better-fitting, collinear model which featured antiferromagnetic ordering on each of the five inequivalent Mn sublattices of the orthorhombic structure. However, the orthorhombic distortion could not be resolved in the diffraction patterns used by Regulski et al and, therefore, the atomic positions had to be refined according to the high-temperature cubic structure. No refinements of the nuclear and magnetic structures of the magnetic phase under the correct orthorhombic symmetry have been reported.
In this paper, we address deficiencies in both the computational and experimental studies of the magnetic ground state of -Mn2O3. Computationally, we use accurate parameterization of the exchange correlation and onsite Hubbard parameters at the density functional theory DFT + U level in concurrence with a cluster-expansion model to investigate candidate ground state models until the correct DFT ground state is established. Experimentally, we use optimized conditions to synthesize -Mn2O3 with crystallite sizes large enough to yield visible splitting of reflection peaks in the neutron diffraction patterns of the orthorhombic phase, and thus refine the magnetic ordering within orthorhombic symmetry. Both approaches give very similar results for the magnetic ordering, suggesting that the ground state magnetic structure of -Mn2O3 is largely solved.
Computational Methods
First principles density functional theory (DFT) calculations, as encoded in the VASP softwareKresse and Furthmuller (1996); dis , were used to calculate the relaxed configurations investigated here and their electronic structures. The generalized gradient approximation (GGA) for the exchange-correlation functional was used throughout, within the “Perdew-Burke-Ernzerhof revised for solids” or “PBEsol” parameterizationPerdew et al. (2008).
The PBEsol exchange-correlation functional has been found to give excellent results compared with experiment for the lattice parameters and bulk moduli of both metals and nonmetalsCsonka et al. (2009). As is generally true for DFT, however, calculated band gaps are too small. This error can lead to qualitative errors for narrow bandgap materials and for materials with magnetic ions, both which are true for -Mn2O3. We compensated for this error by including onsite Coulomb terms (the “GGA+U” approximation). In a previous study of MnO2 phasesCockayne and Li (2012), we found that the experimental volume and bandgap of -MnO2 could both be reproduced using the rotationally invariant DFT+U of Liechtenstein et al.Liechtenstein et al. (1995) with an onsite Coulomb potential = 2.8 eV and onsite exchange potential = 1.2 eV for Mn electrons. Remarkably, these same values used for the Mn4+ ion of -MnO2 ion were found to be transferable to the Mn3+ ion of -Mn2O3, giving excellent agreement with experiment, as shown below. Ex post facto investigations of the effects of varying the Mn and parameters, or adding or parameters for oxygen, gave little, if any, improvement.
Sufficient convergence in total energies and lattice parameters was achieved with a plane wave cutoff energy of 500 eV and a 222 Monkhorst-Pack grid of k-points. A 888 Monkhorst-Pack grid was used for the density of states calculation. The magnetic ordering of each of the 32 Mn atoms in the unit cell could be set either “up” or “down” as desired. Spin-orbit coupling was neglected. Only collinear magnetic structures were computed using VASP.
The aim of the computational work was to find the DFT ground state magnetic ordering of -Mn2O3. The cluster-expansion concept, as developed for interatomic alloysConnolly and Williams (1983); Sanchez (2010), was used to identify candidate states to explore. The formal mathematics of the spin-state problem is identical to that of the alloy problem. Each site is given a parameter , where for spin up (species A in the alloy problem) and for spin down (species B in the alloy problem).
The total energy of a configuration is written as
| (1) |
where are the symmetry distinct geometric clusters, the effective spin interaction parameter for cluster , and the average spin product over all symmetry equivalent occurrences of this clusterfoo (b).
In practice, one calculates individual for various configurations, determines the values of according to some fitting procedure, and then uses these values to estimate the energies of any configuration, including those that are not part of the fit. Errors in the determination of due to the finite set of included energies lead to errors in the predictions. While any method for determining should eventually converge to the same result given a sufficiently large number of input configurations, in this work, we employ the cluster expansion method formulated by Cockayne and van de WalleCockayne and van de Walle (2010). This method uses DFT results to fit a number of parameters that is much larger than the number of results. The mathematical problem of overfitting the data (that is, the non-uniqueness of the solution) is controlled by using a Bayesian prior to constrain the magnitudes of the . This method has additional advantages of exact fitting of all input energies and self-consistent error estimates for all predictions.
All results were calculated within an identical 80-atom, 32 Mn cell. The cluster interactions that can be determined are limited to those contained within one unit cell. The model is valid for predictions of other configurations within the same cell, but can not be applied to larger supercells; thus if the ground state magnetic state has a larger periodicity than the crystallographic one, it will be missed.
There are collinear magnetic states for the 32 Mn atoms in the -Mn2O3 unit cell. Time reversal and crystallographic symmetry reduce the number of symmetry-independent configurations to about 3 108, which, according to a one-to-one correspondence with the number of cluster termsConnolly and Williams (1983), yield about 3 108 unknown cluster terms. Solving linear sets of equations with order 108 unknowns is not computationally feasible. To simplify the problem, we truncated the interaction terms at fourth order (time reversal symmetry forbids linear or cubic terms in the magnetic interactions). There is 1 constant term, 73 independent pair cluster term and 4632 four-body cluster terms in our model. For sets of DFT total energy results, we solved equations in 4706 unknowns, using a Bayesian prior to weight the parameters and standard singular value techniques for solving underdetermined sets of linear equations.
The prior that we used for the pair terms was
| (2) |
with
| (3) |
where is the distance between the Mn at site and and Å is the approximate nearest-neighbor Mn-Mn distance and is an unknown constant. The prior for the four-body terms was of similar form, with
| (4) |
The physical motivation behind the form of this interaction was to weaken cluster terms involving Mn ions that are farther apart from each other. Although superexchange spin interactions are short range, we expect that strain coupling effects may mediate longer range interaction; thus the form for our relative interaction terms in the prior. The value of was determined self-consistently by the leave-one-out cross validation methodCockayne and van de Walle (2010). This value was scaled such that the root mean square error in the predicted energies equalled the root mean square of the predicted errorsCockayne and van de Walle (2010).
We studied the magnetic states in an iterative manner. After calculating an initial set of energies versus magnetic orderings for a few simple configurations, additional structures were investigated, with, in rotating turns, (1) the minimum predicted energy among untested structures, (2) the maximum predicted energy among untested structures, and (3) the maximum predicted uncertainty in energy. The parameters were recalculated after each step, and then used to predict the energies and energy uncertainties for all order 3 108 symmetry independent configurations. The model was refined iteratively until there were no more predicted states within two standard deviations of uncertainty of the tenth lowest-energy state found, at which point it was concluded that the collinear ground state was probably found. 76 structures in all were calculated.
Experimental Methods
The -Mn2O3 powder sample was prepared by heating MnCO3 (analytical reagent) at 800 ∘C in air for 12 h, which was the highest temperature to yield phase-pure -Mn2O3 devoid of Mn3O4 traces. The sample was characterized using X-ray powder diffraction in an instrument equipped with an incident-beam monochromator (Cu Kα1 radiation) and a position sensitive detector. The heating temperature and time were selected to minimize the width of the 222 peak, which remains non-split in the orthorhombic phase and, therefore, reflects the size of the coherently scattering domains in the sample. (Phase-pure -Mn2O3 can be obtained by heating MnCO3 at temperatures between 600 ∘C and 800 ∘C, but lower temperatures produced considerably broader peaks). No changes in the peak widths were observed after the second heating at 800 ∘C for 12 h.
Neutron powder diffraction measurements were performed using both the time-of-flight HIPD diffractometer at the Lujan Center of the Los Alamos National Laboratory and the BT-1 constant-wavelength (Cu 311 monochromator, Å, 15’ collimation) diffractometer at the NIST National Center for Neutron Research. For these measurements, the -Mn2O3 powder was loaded in vanadium cans. In each experiment the data were collected at a series of temperatures (HIPD: 300 K, 200 K, 150 K, 100 K, 60 K, 40 K, 5 K and BT-1: 300 K, 100 K, 40 K, 10 K, 2 K). Rietveld refinements of the nuclear and magnetic structures were performed using GSASLarson and Dreele (1994).
The magnetic-structure models were selected according to representational analyses performed by SARAhWills (2000); likewise, SARAh was used for symmetry-constrained refinements in GSAS. First, the magnetic basis-vector coefficients were refined using a Reverse Monte Carlo (RMC) algorithm implemented in SARAh with the magnitudes of all the magnetic moments constrained to be equal. The best-fit model was further refined in GSAS (i.e. using least squares minimization) by keeping the basis-vector coefficients fixed but allowing for distinct ordered magnetic moments on inequivalent Mn sites. The HIPD and BT-1 data produced consistent structural parameters.
Computational Results
The -Mn2O3 bixbyite structure was first investigated with ferromagnetic ordering. Relaxation under cubic symmetry, yielded = 9.409 Å, and the structure shown in Table LABEL:tab:cubfer. DFT phonon results of this cubic structure show an extremely strong double instability (), associated with Jahn-Teller distortions of the oxygen octahedra centered on the Mn(1) sites. Full relaxation of the bixbyite structure perturbed by either mode in the instability doublet, or any linear combination of the two, leads to an orthorhombic minimum energy state with symmetry, explaining the experimental cubic-orthorhombic transition. In fact, we find that all such combinations relax to the same ferromagnetic ground state structure, differing only with respect to (1) which of the original cubic axis becomes the short axis of the orthorhombic unit cell and (2) possible translations of the origin by (1/2,1/2,1/2). Each Mn(1) and Mn(2) in the orthorhombic structure has four short Mn-O distances and two long Mn-O distances. The topology of the orthorhombic structure is uniquely defined by specifying which Mn(1)-O and Mn(2)-O distances are long. In this work, we arbitrarily choose the setting where the Mn(1) at (0,0,0) has its far O neighbors at approximately , and the Mn(2) at (1/2,1/2,1/2) has its far O neighbors at approximately . The ground state ferromagnetic structure is shown in the left-hand side of Table LABEL:tab:orthofer.
| Species | Site | |||
| Mn(1) | 8() | 0 | 0 | 0 |
| Mn(2) | 24() | 0 | 1/4 | 0.2848 |
| O(1) | 24() | 0.4162 | 0.1286 | 0.3555 |
| O(2) | 24() | 0.3714 | 0.1445 | 0.0838 |
| FM | AFM ground | ||||||
| 9.4417 | 9.4024 | ||||||
| 9.4417 | 9.4435 | ||||||
| 9.4096 | 9.3668 | ||||||
| Atom | Site | x | y | z | x | y | z |
| Mn(1) | 4(a) | 0 | 0 | 0 | 0 | 0 | 0 |
| Mn(2) | 4(b) | 1/2 | 1/2 | 1/2 | 1/2 | 1/2 | 1/2 |
| Mn(3) | 8(c) | 0.2563 | 0.2854 | -0.0070 | 0.2602 | 0.2848 | -0.0102 |
| Mn(4) | 8(c) | 0.2864 | -0.0010 | 0.2458 | 0.2857 | -0.0034 | 0.2450 |
| Mn(5) | 8(c) | 0.0079 | 0.2478 | 0.2845 | 0.0136 | 0.2457 | 0.2818 |
| O(1) | 8(c) | 0.4215 | 0.1259 | 0.3510 | 0.4256 | 0.1233 | 0.3502 |
| O(2) | 8(c) | 0.1358 | 0.3523 | 0.4103 | 0.1409 | 0.3506 | 0.4050 |
| O(3) | 8(c) | 0.3576 | 0.4180 | 0.1223 | 0.3568 | 0.4187 | 0.1196 |
| O(4) | 8(c) | 0.0855 | 0.3721 | 0.1414 | 0.0845 | 0.3738 | 0.1395 |
| O(5) | 8(c) | 0.3791 | 0.1460 | 0.0794 | 0.3815 | 0.1478 | 0.0798 |
| O(6) | 8(c) | 0.1524 | 0.0859 | 0.3648 | 0.1567 | 0.0873 | 0.3608 |
| DFT | Heisenberg | ||||
|---|---|---|---|---|---|
| Atom | |||||
| Mn(1) | -3.6 | -3.6 | 0.0 | 0 | |
| Mn(2) | -3.6 | -3.6 | 0.0 | 0 | |
| Mn(3) | 3.6 | 3.0 | -1.9 | 32 | |
| Mn(4) | 3.6 | 3.2 | 1.6 | 27 | |
| Mn(5) | -3.6 | -3.6 | -0.1 | 1 |
| Generator | ||
|---|---|---|
| (x,1/2-y,1/2+z) | -1 | -1 |
| (1/2+x,y,1/2-z) | -1 | -1 |
| (1/2-x,1/2+y,z) | +1 | -1 |
The orthorhombic crystallographic structure of the ferromagnetic phase was used as the starting part for relaxation of each collinear spin combination studied. The state that was ultimately picked as the ground state was the 36th studied. In total, 76 states were investigated before the termination criterion was reached: no new structures with predicted energies within two standard deviations of the tenth-lowest-energy structure found.
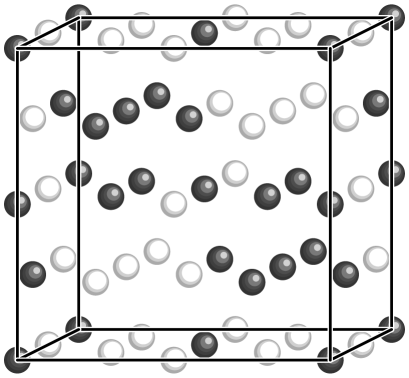
The calculated ground state collinear magnetic structure is shown in Fig. 4 and listed in Table 3. The spin moments are obtained by taking the difference in the number of spin up and spin down electrons, integrated within spheres of radius 1.24 Å centered on each Mn, as calculated using VASP. The magnitudes are reasonable for high-spin Mn3+ ions, but are not precisely comparable with experiment because of the artificial partition of the cell into spherical volumes.
We next investigated possible noncollinear magnetism using the parameters found in the fit to the computational results. The obvious way to extend the model is to use the same parameters for the collinear approach, but to vectorize the spins in a Heisenberg model approach. That is, instead of using Ising-like interaction terms , one uses Heisenberg-like interaction of spin “vectors” according to the principle axes of “up” spin: , with exactly the same set of . For simplicity, we only included pair interactions in this approach. Simulated annealing was used to find the lowest energy state of the Heisenberg model. Random initial spin configurations always converged to an equivalent noncollinear ground state (right side of Table 3), with a dominant spin axis direction , and all secondary spin components along the same orthogonal axis .
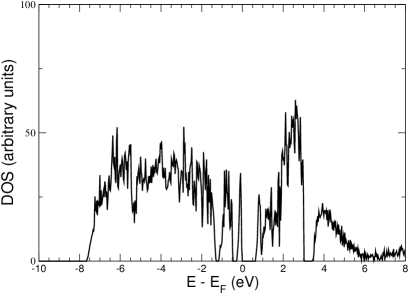
The band structure for the lowest-energy collinear magnetic state found is shown in Fig. 5. The structure has some similarities to that of Franchini et al.Franchini et al. (2007), using the PBE0 approximation, including a band gap at the Fermi level (0.6 eV in our case). Our results differ from theirs in that our strict antiferromagnetism leads to a band structure without a distinction between majority and minority spins. Furthermore, we find a remarkable signature of the combination of octahedral crystal field splitting and effects of Jahn-Teller distortion in the nature of the highest occupied levels: they are split off from the other occupied 3 states. The highest valence band is an isolated band associated with 3 electrons of the Mn(1) and Mn(2). A second split band at around eV is associated with Mn(3), Mn(4), and Mn(5) 3 electrons.
Experimental Results
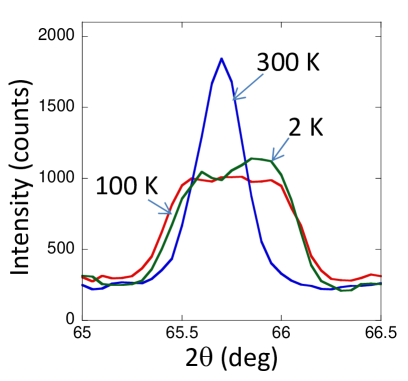
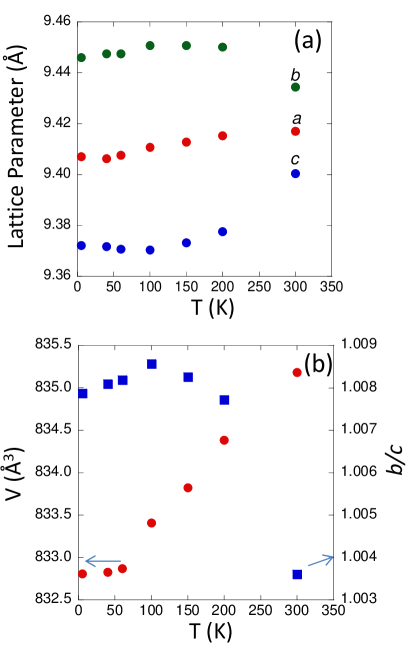
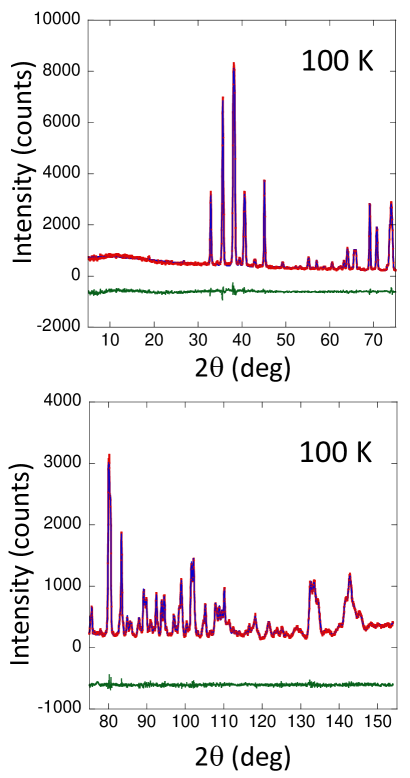
Room-temperature diffraction patterns (Fig. 6) exhibit no clear reflection splitting indicative of an orthorhombic distortion. However, the peaks are broad and the cubic model fits poorly yielding abnormally large atomic displacements parameters for the oxygen atoms, which suggests that the structure is distorted. The data (not shown) can be fitted satisfactorily using the orthorhombic structure reported in the literature with sensible values. The refined lattice distortion at 300 K differed considerably between the HIPD data and BT-1 data , presumably because of the close proximity of the phase transition which leads to relatively large changes in the lattice distortion even for small temperature differences. The distortion increases rapidly on cooling to at 100 K and the reflection splitting becomes evident (Fig. 6). For these temperatures, the lattice parameters refined using the HIPD and BT-1 data were in good agreement. Temperature dependencies of the lattice parameters, unit cell volume, and data are summarized in Fig. 7. Fig. 8 displays the experimental and calculated diffraction profiles for T=100 K, while Table 5 summarizes the results of the nuclear-structure refinements at 100 K and 2 K. The MnO6 octahedra exhibit strong Jahn-Teller distortions already at 300 K (Table 6).
| 100 K () | 2 K () | ||||||
| a | 9.4104(1) | 9.4078(1) | |||||
| b | 9.4509(1) | 9.4488(1) | |||||
| c | 9.3706(1) | 9.3739(1) | |||||
| Atom | Site | x | y | z | x | y | z |
| Mn(1) | 4(a) | 0 | 0 | 0 | 0 | 0 | 0 |
| Mn(2) | 4(b) | 1/2 | 1/2 | 1/2 | 1/2 | 1/2 | 1/2 |
| Mn(3) | 8(c) | 0.2598(5) | 0.2854(3) | -0.0105(5) | 0.268(1) | 0.280(1) | -0.011(1) |
| Mn(4) | 8(c) | 0.2867(3) | 0.0017(8) | 0.2436(4) | 0.2880(9) | 0.009(2) | 0.246(1) |
| Mn(5) | 8(c) | 0.0127(5) | 0.2456(6) | 0.2827(3) | 0.012(1) | 0.237(1) | 0.2833(9) |
| O(1) | 8(c) | 0.4253(3) | 0.1241(4) | 0.3511(4) | 0.4276(8) | 0.1240(9) | 0.3502(8) |
| O(2) | 8(c) | 0.1399(3) | 0.3509(4) | 0.4068(2) | 0.1395(8) | 0.3513(9) | 0.4074(7) |
| O(3) | 8(c) | 0.3579(3) | 0.4175(4) | 0.1218(3) | 0.3586(9) | 0.4169(9) | 0.1209(7) |
| O(4) | 8(c) | 0.0838(3) | 0.3725(4) | 0.1402(3) | 0.0738(7) | 0.3712(9) | 0.1385(9) |
| O(5) | 8(c) | 0.3797(3) | 0.1477(4) | 0.0789(3) | 0.3821(8) | 0.1509(9) | 0.0803(7) |
| O(6) | 8(c) | 0.1554(3) | 0.0882(3) | 0.3609(4) | 0.1563(8) | 0.0882(9) | 0.3586(8) |
| 300 K | 100 K | ||||
| Atom | |||||
| Mn(1) | 2.03(2) (2) | 1.949(3) (2) | |||
| 2.02(1) (2) | 1.944(3) (2) | ||||
| 1.97(2) (2) | 2.129(3) (2) | ||||
| Mn(2) | 2.04(2) (2) | 1.953(3) (2) | |||
| 1.90(1) (2) | 2.117(3) (2) | ||||
| 2.04(2) (2) | 1.923(3) (2) | ||||
| Mn(3) | 2.17(2) | 1.88(1) | 2.200(5) | 1.879(5) | |
| 2.03(2) | 2.31(2) | 1.987(5) | 2.327(5) | ||
| 1.92(1) | 2.00(2) | 1.915(5) | 1.961(5) | ||
| Mn(4) | 2.00(2) | 2.20(2) | 2.033(6) | 2.181(7) | |
| 1.90(1) | 1.96(2) | 1.934(5) | 1.959(6) | ||
| 2.35(2) | 1.88(1) | 2.269(7) | 1.859(5) | ||
| Mn(5) | 1.90(2) | 1.96(2) | 1.889(5) | 1.943(5) | |
| 2.26(2) | 1.91(2) | 2.358(6) | 1.916(5) | ||
| 1.98(2) | 2.18(2) | 2.026(5) | 2.134(5) |
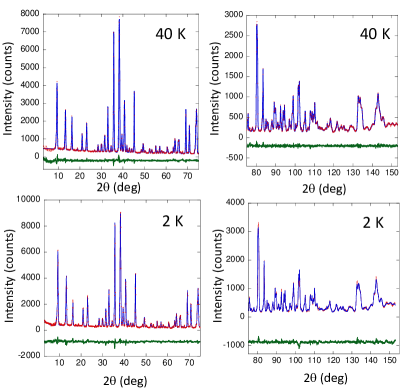
Below 100 K, a series of strong reflections appears at lower angles, which signifies magnetic ordering (Fig. 9). The ratio decreases slightly below the magnetic transition (Fig. 7(b)) to 1.0079 at 2 K. The patterns remain qualitatively unchanged from 60 K down to 2 K. The magnetic reflections can be accounted for by a propagation vector k=0. All eight symmetry elements of the space group leave this propagation vector invariant. Group-theory analysis yields eight irreducible representations (IR) (, =1, 8), each having an order of one. Only four of these IRs (, , , and ), are common to all five of the inequivalent Mn sites.
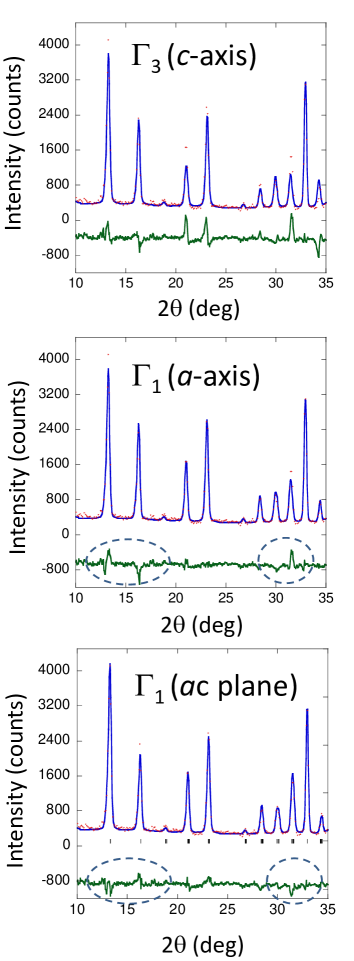
Regulski et al.Regulski et al. (2004) presented their collinear magnetic-ordering model in the form of schematic drawings for each Mn sublattice; no symmetry analysis was performed. According to our representational analysis, the ordering types for their sublattices 1 (combined Mn 4(a) and 4(b) sites), 2, and 4 belong to the representation. However, the ordering on their sublattice 3 is incompatible with any of the IRs; that is, the model, at least as presented, is not compatible with orthorhombic crystallographic symmetry (possibly there is a drawing error). The spin arrangement for their sublattice 3 can be made compatible with the structural symmetry by flipping the directions of two spins. The resulting ordering patterns belong to either the or representations, depending on which two spins are flipped. We fitted both models (i.e. and ) to our data. A collinear pattern with magnetic moments directed along one of the orthorhombic axes was assumed. The model with all the moments parallel to the -axis produced a superior fit of quality comparable to that reported by Regulski et al. However, examination of the misfit between the calculated and experimental profiles reveals significant discrepancies for several magnetic reflections that become split in the orthorhombic structure (Fig. 9(a)), which indicates that the intensity distribution among the split-peak components is incorrect. Conceivably, these deficiencies were obscured by the insufficient resolution in the data used by Regulski et al.
As the literature model failed to describe the data, we considered collinear models corresponding to other representations (i.e. , and ). The model with the magnetic moments directed along the -axis provided a satisfactory fit to the neutron data of quality far superior to that obtained for any of the models (Fig. 9(b)); the collinear models with magnetic moments directed along the and -axes yielded considerably worse agreement factors. Models generated according to the and representations generated poor fits and were discarded. Refinements of the magnetic-moment magnitudes independently for each Mn site significantly improved the fit. The resulting -values, which at 2 K range from approximately 3 to 4 , are consistent with those expected for Mn3+ ions. The collinear model most consistent with the experimental results is shown in Table 7. It is identical to that determined computationally (Fig. 4).
| 2 K | 40 K | |||||||
|---|---|---|---|---|---|---|---|---|
| Atom | ||||||||
| Mn(1) | -2.6 | 1.6 | 3.1(1) | 32 | -2.3 | 1.4 | 2.7(1) | 32 |
| Mn(2) | -3.4 | -0.7 | 3.5(1) | 12 | -3.0 | -0.8 | 3.1(1) | 15 |
| Mn(3) | 3.2 | -1.4 | 3.5(1) | 23 | 3.0 | -0.3 | 3.0(1) | 5 |
| Mn(4) | 3.0 | 1.3 | 3.3(1) | 24 | 2.9 | 0.3 | 2.9(1) | 6 |
| Mn(5) | -3.5 | -2.3 | 4.2(1) | 34 | -3.4 | -1.0 | 3.5(1) | 16 |
| Generator | ||
|---|---|---|
| (x,1/2-y,1/2+z) | -1 | -1 |
| (1/2+x,y,1/2-z) | -1 | +1 |
| (1/2-x,1/2+y,z) | +1 | -1 |
We explored potential deviations from the collinearity using the algorithms implemented in SARAh. A relatively large number of RMC cycles (3,000 for 2 basis-vector mixing coefficients per site and 10,000 for 3 coefficients per site) were found necessary to locate a model that provides an adequate fit (a goodness-of-fit ) to the data. Detailed refinements of the magnetic structure were performed at 40 K and 2 K. Multiple refinements that start from randomly selected values of the mixing coefficients were run to verify the robustness of the best-fit structural model at 2 K.
The best fit was obtained by restricting the magnetic moments to the orthorhombic (010) plane. The fit of the several magnetic reflections was visibly improved in the non-collinear model (Fig. 9(c), Fig. 10). The best-fit models at both 40 K and 2 K feature similar patterns of magnetic ordering (Table 5). No additional improvement was obtained by varying all three mixing coefficients per site after 20,000 RMC cycle; possibly, even this number of cycles was insufficient to identify a global minimum. In the best-fit non-collinear model, the magnetic moments are aligned preferentially with the -axis but exhibit significant (up to 32∘) deviations from this direction; the deviations from collinearity become especially pronounced at 2 K.
Discussion
The theoretical lattice parameters of orthorhombic -Mn2O3 change significantly when the magnetic structure changes from ferromagnetic to the antiferromagnetic lowest-energy collinear state (Table LABEL:tab:orthofer), demonstrating significant spin-strain coupling. The ground state lattice parameters are within about of experiment, phenomenally good agreement that demonstrates the accuracy of DFT calculations using the PBEsol exchange correlational along with on-site and parameters to treat -electron correlations in Mn.
The lowest DFT collinear state found and the best low-temperature experimental fit to a collinear model are identical, although they were achieved completely independently, suggesting that the nature of the magnetism in -Mn2O3 is largely solved. The secondary components of the best noncollinear spin arrangements of model and experiment (Table 3 and Table 7) appear different at first glance, but in fact, the two are related by the approximate relationship , with the crystallographic positional coordinate. The source of the discrepancy is not clear, but the agreement is noteworthy given the approximations involved in the computational approach. Note that the experimental results show clear preferences for magnetic moments along particular directions; the DFT approach neglected spin-orbit coupling, and thus the effect of magnetic moment direction could not be studied.
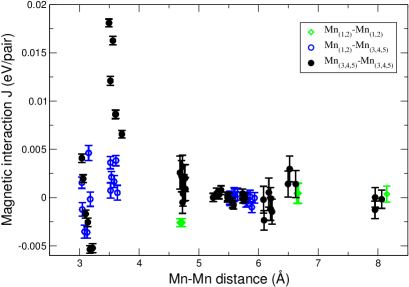
The pair magnetic parameters, as determined from the fit to the DFT results, are shown as a function of Mn-Mn distance in Fig. 11. The strongest terms are antiferromagnetic terms for exactly those Mn-Mn pairs that (1) are approximately 3.5 Å to 3.6 Å apart, (2) share one close O atom bonded to each, and (3) have a Mn-O-Mn angle for these bonds less than 125∘. These Mn-O-Mn pairs involve two Mn(3), Mn(4), or Mn(5) atoms and have very unequal Mn-O distances. Within the Mn-Mn pairs the magnitude of the antiferromagnetic interaction strictly decreases with increasing length of the longer Mn-O distance.
Two pair interactions of approximate magnitude 0.085 eV per pair are nearly degenerate in energy and Mn-Mn distance, such that they can not be distinguished in Fig. 11. If the Mn-Mn links corresponding to the 3 strongest terms and one of the 0.085 eV terms are drawn (Fig. 12), then the magnetic structure for the Mn(3), Mn(4), and Mn(5) sites based on these interactions, all antiferromagnetic, is completely determined to be that of the computational and experimental collinear ground state. On the other hand, if links corresponding to both 0.085 eV terms are drawn (Fig. 13), then there are frustrated triangles where antiferromagnetic interactions can not be satisfied for all bonds. A triangle of vector spins with frustrated antiferromagnetic interactions has a (possible degenerate) ground state with a noncollinear spin arrangement; we believe this is the origin of the noncollinear antiferromagnetism of -Mn2O3.
We only looked at the ground state magnetic structure, but the finite temperature magnetic correlations could also be investigated using the DFT model, which would allow the nature of possible AFM-AFM transitions in -Mn2O3 (Regulski et al., 2004) to be determined.
Conclusions
First principles density functional theory DFT+U and cluster expansion model calculations, along with independent experimental neutron diffraction structure analyses, were used to determine the low-temperature crystallographic and magnetic structure of bixbyite -Mn2O3. Both approaches independently gave nearly identical crystallographic and magnetic structures, with identical antiferromagnetic ordering along a principal magnetic axis and secondary ordering along a single orthogonal axis, differing only by a phase factor in the modulation patterns. The agreement between the two approaches suggests that the ground magnetic state of -Mn2O3 is largely solved.
The computational methods exploited a Bayesian approach that allows the number of parameters in the cluster expansion model to exceed the number of input structure energies without sacrificing energy predictability. The individual magnetic coupling parameters were determined, showing that specific frustrated antiferromagnetic interactions determine the magnetic structure. The experimental approach benefited from optimized sample synthesis, which produced crystallite sizes large enough to yield a clear splitting of peaks in the neutron powder diffraction patterns, thereby enabling magnetic-structure refinements under the correct orthorhombic symmetry.
The approaches used here should prove suitable for similar problems of magnetic ordering in other complex oxides whose magnetic states are determined by a large and frustrated set of antiferromagnetic interactions.
Acknowledgements
This work has benefited from the use of HIPD at the Lujan Center at Los Alamos Neutron Science Center, funded by DOE Office of Basic Energy Sciences. Los Alamos National Laboratory is operated by Los Alamos National Security LLC under DOE Contract DE-AC52-06NA25396.
References
- Franchini et al. (2007) C. Franchini, R. Podloucky, J. Paier, M. Marsman, and G. Kresse, Phys. Rev. B 75, 195128 (2007).
- Hellwege and Hellwege (1975) K.-H. Hellwege and A. M. Hellwege, eds., Landoldt-Börnstein Numerical Data and Functional Relationships in Science and Technology, Series III, Vol. 7.b.1 (Springer-Verlag, New York, 1975).
- Geller and Espinosa (1970) S. Geller and G. P. Espinosa, Phys. Rev. B 1, 3763 (1970).
- foo (a) The Table in the Landoldt-Börnstein(Hellwege and Hellwege, 1975) has the and parameters transposed with respect to the original Geller and Espinosa paper(Geller and Espinosa, 1970). Based on our results, we believe that the ordering in the original Geller and Espinosa work is correct for the standard Pbca space group setting.
- Geller (1971) S. Geller, Acta Crystallogr. B 27, 821 (1971).
- Regulski et al. (2004) M. Regulski, R. Przenioslo, I. Sosnowska, D. Hohlwein, and R. Schneider, J. Alloys Compounds 362, 236 (2004).
- Grant et al. (1968) R. W. Grant, S. Geller, J. A. Cape, and G. P. Espinoza, Phys. Rev. 175, 686 (1968).
- Kresse and Furthmuller (1996) G. Kresse and J. Furthmuller, Phys. Rev. B 54, 11169 (1996).
- (9) Certain commercial software is identified in this paper to adequately describe the methodology used. Such identification does not imply recommendation or endorsement by the National Institute of Standards and Technology, nor does it imply that the software identified is necessarily the best available for the purpose.
- Perdew et al. (2008) J. P. Perdew, A. Ruzsinszky, G. I. Csonka, O. A. Vydrov, G. E. Scuseria, L. Constantin, X. Zhou, and K. Burke, Phys. Rev. Lett. 100, 136406 (2008).
- Csonka et al. (2009) G. I. Csonka, J. P. Perdew, A. Ruzsinszky, P. H. T. Philipsen, S. Lebègue, J. Paier, O. A. Vydrov, and J. G. Ángyán, Phys. Rev. B 79, 155107 (2009).
- Cockayne and Li (2012) E. Cockayne and L. Li, Chem. Phys. Lett. 544, 53 (2012).
- Liechtenstein et al. (1995) A. I. Liechtenstein, V. I. Anisimov, and J. Zaane, Phys. Rev. B 52, R5467 (1995).
- Connolly and Williams (1983) J. W. D. Connolly and A. R. Williams, Phys. Rev. B 27, 5169 (1983).
- Sanchez (2010) J. M. Sanchez, Phys. Rev. B 81, 224202 (2010).
- foo (b) For clarity, cluster multiplicities due to symmetry are neglected in the text equations, but were properly weighted in the analysis.
- Cockayne and van de Walle (2010) E. Cockayne and A. van de Walle, Phys. Rev. B 81, 012104 (2010).
- Larson and Dreele (1994) A. C. Larson and R. B. V. Dreele, Tech. Rep. 86-748, Los Alamos National Laboratory, Los Alamos, NM (1994).
- Wills (2000) A. S. Wills, Physica B 276, 680 (2000).