11email: aurora.sicilia@uam.es
Max-Planck-Institut für Astronomie, Königstuhl 17, 69117 Heidelberg, Germany
Laboratoire AIM, CEA/DSM–CNRS–Université Paris Diderot, IRFU/Service d’Astrophysique, CEA Saclay, 91191 Gif-sur-Yvette, France
RAL Space, STFC Rutherford Appleton Laboratory, Chilton, Didcot, Oxfordshire, OX11 0QX, UK
Department of Physical Sciences, The Open University, Walton Hall, Milton Keynes, MK7 6AA, UK
Protostars, multiplicity, and disk evolution in the Corona Australis region: A Herschel Gould Belt Study††thanks: Herschel is an ESA space observatory with science instruments provided by European-led Principal Investigator consortia and with important participation from NASA.
Abstract
Context. The CrA region and the Coronet cluster form a nearby (138 pc), young (1-2 Myr) star-forming region hosting a moderate population of Class I, II and III objects.
Aims. We study the structure of the cluster and the properties of the protostars and protoplanetary disks in the region.
Methods. We present Herschel PACS photometry at 100 and 160 m, obtained as part of the Herschel Gould Belt Survey. The Herschel maps reveal the cluster members within the cloud with both high sensitivity and high dynamic range.
Results. Many of the cluster members are detected, including some embedded, very low-mass objects, several protostars (some of them extended), and substantial emission from the surrounding molecular cloud. Herschel also reveals some striking structures, such as bright filaments around the IRS 5 protostar complex and a bubble-shaped rim associated with the Class I object IRS 2. The disks around the Class II objects display a wide range of mid- and far-IR excesses consistent with different disk structures. We have modelled the disks using the RADMC radiative transfer code to quantify their properties. Some of them are consistent with flared, massive, relatively primordial disks (S CrA, T CrA). Others display significant evidence for inside–out evolution, consistent with the presence of inner holes/gaps (G-85, G-87). Finally, we find disks with a dramatic small dust depletion (G-1, HBC 677) that, in some cases, could be related to truncation or to the presence of large gaps in a flared disk (CrA-159). The derived masses for the disks around the low-mass stars are found to be below the typical values in Taurus, in agreement with previous Spitzer observations.
Conclusions. The Coronet cluster appears to be an interesting compact region containing both young protostars and very evolved disks. The Herschel data provide sufficient spatial resolution to detect small-scale details, such as filamentary structures or spiral arms associated with multiple star formation. The disks around the cluster members range from massive, flared primordial disks, to disks with substantial small dust depletion or with evidence of inside-out evolution. This results in an interesting mixture of objects for a young and presumably coevally formed cluster. Given the high degree of multiplicity and interactions observed among the protostars in the region, the diversity of disks may be a consequence of the early star formation history, which should also be taken into account when studying the disk properties in similar sparsely populated clusters.
Key Words.:
stars: formation – stars: pre-main sequence – protoplanetary disks – stars: late-type1 Introduction
The Corona Australis (CrA) star-forming region is a nearby, large (13pc; Graham 1992) molecular cloud, located out of the galactic plane, and populated by a few young, intermediate-mass stars and a sparse cluster, known as the Coronet cluster. Marraco & Rydgren (1981) identified a compact group of pre-main sequence stars, and Ortiz et al. (2010) confirmed a distance of 13816 pc based on light echoes, placing it among the closest, brightest and most compact star-forming regions. The Coronet cluster is an obscured, compact (1.1 pc across) region associated with the Ae star R CrA (Taylor & Storey 1984) and a dense molecular core (Loren 1979; Harju et al. 1993). The presence of several far-IR sources revealed some embedded young stars (de Muizon et al. 1980; Wilking et al. 1985; Henning et al. 1994). X-ray observations with Einstein, XMM-Newton, ROSAT and Chandra (Walter 1986, 1997; Neuhäuser et al. 1997, 2000; Garmire & Garmire 2003; Hamaguchi et al. 2005: Forbrich & Preibisch 2007), which are less affected by dust extinction, extended the initial identification of intermediate-mass stars to a large number of low-mass members, characterizing a quite rich cluster with several Class I protostars, some of them showing strong X-ray flares. Combined X-ray and radio observations (Forbrich, Preibisch & Menten 2006) confirmed these results. Deep X-ray observations revealed a large number ( 70, Garmire & Garmire 2003) of sources that could be associated with young stars, many of which are deeply embedded. Independently, IR observations (including Spitzer) reveal the presence of more than 100 sources (Class I, Class II and Class III objects), some of them highly extincted, suggesting ages well under 2-3 Myr (Nisini et al. 2005; Peterson et al. 2011; Sicilia-Aguilar et al. 2011). Such very young ages are in agreement with the detection of ongoing star formation and Class 0 candidates (Wang et al. 2004; Nutter et al. 2005; Chen & Arce 2010). Finally, optical spectroscopy of some of the X-ray and Spitzer sources revealed a large variety of accreting and non-accreting T Tauri Stars (TTS) and brown dwarf (BD) candidates with spectral types K7-M8 and different disk morphologies (Sicilia-Aguilar et al. 2008, 2011a). The disk fraction was suggested to be about 65% (Sicilia-Aguilar et al. 2008), although the discovery of new diskless members lowered it to 50% for the M-type objects (López-Martí et al. 2010). Isochrone fitting to the extinction-corrected JHK photometry revealed an age below 2 Myr for the low-mass TTS in the region (Sicilia-Aguilar et al. 2011a).
Given that the Coronet cluster is one of the most interesting regions for studies of low-mass star formation, several millimetre and submillimetre studies have concentrated on identifying the earlier phases of the process (Henning et al. 1994; Chini et al. 2003; Groppi et al. 2004, 2007; Nutter et al. 2005). The 1.3 mm study of Henning et al. (1994) had a mass sensitivity limit of around 510-4 M⊙ in cold dust, revealing the presence of disks and structures around the Herbig Ae/Be stars and massive TTS. The study of Chini et al. (2003) reached higher sensitivity at 1.3mm, identifying 25 individual emission sources in a 15’30’ area containing the cluster center and its southern part around VV CrA. Comparing with other observations, these objects could be traced back to disks around K and earlier-type stars, embedded protostellar sources, as well as more diffuse ambient cloud emission. Groppi et al. (2004) mapped the densest part of the cloud in its 870 m continuum emission, but the survey avoided the less dense regions that contain most of the Class II/III objects. Nutter et al. (2005) and Groppi et al. (2007) used SCUBA to obtain a higher resolution map of the region, which covered the central part around the emission peak in IRS 7. They resolved several peaks in this region, including a potential Class 0 protostar. APEX/LABOCA mapping of the region at 870 m confirmed the presence of dense structures associated with embedded objects, but also revealed starless regions with lower column densities, suggestive of inefficient star formation, although the low spatial resolution did not allow to study the details in the cluster center (Sicilia-Aguilar et al. 2011a).
Here we present observations of the CrA region, obtained with the ESA Herschel Space Observatory (Pilbratt et al. 2010) using the PACS bolometer (Poglitsch et al. 2010) at 100 and 160 m. The observations are part of the Herschel Gould Belt Survey (cf. André et al. 2010 and http://gouldbelt-herschel.cea.fr). The Herschel/PACS data reveal the structure of the CrA star-forming region and the properties of its protostellar and disk population with unprecedent mapping speed, sensitivity, dynamic range, and spatial resolution. In Section 2 we describe the Herschel observations and data reduction, as well as other complementary data. In Section 3 we study the properties of the individual objects and Section 4 presents the implications for intermediate-mass and low-mass star formation. We also derive disk parameters by fitting the SEDs of the objects with the radiative transfer code RADMC. Finally, we summarize our results in Section 5.
2 Observations and data reduction
2.1 Herschel/PACS observations
| Source ID | RA(J2000) | DEC (J2000) | Flux | Comments |
|---|---|---|---|---|
| (deg) | (deg) | (Jy) | ||
| S CrA | 285.285750 | -36.955429 | 17.72.6 | SMM7 (Nutter et al. 2005) |
| CrA-466 | 285.32887 | -36.97450 | 0.320.05 | G-113 |
| #6 | 285.385710 | -36.894553 | 0.340.08 | Chini et al. (2003), extended |
| G-85 | 285.390750 | -36.962428 | 0.420.06 | Sicilia-Aguilar et al. (2008) |
| #8 | 285.409360 | -36.890428 | 122 | Chini et al. (2003), extended |
| G-122 | 285.421760 | -36.953843 | 0.610.09 | Sicilia-Aguilar et al. (2008) |
| G-65 | 285.417650 | -36.862488 | 193 | Sicilia-Aguilar et al. (2008), mostly cloud emission |
| IRS 2 | 285.422790 | -36.975106 | 8212 | |
| IRS 2+ring | 285.422790 | -36.975106 | 10415 | Including ring-like structure |
| HBC 677 | 285.423070 | -36.997754 | 0.0890.014 | |
| IRS 5a+b | 285.450130 | -36.955705 | 19.42.8 | Unresolved binary |
| FP-25 | 285.45193 | -36.95413 | 153 | Probably extended, IRS 5 N |
| IRS 5ab + FP-25 | 285.450130 | -36.955705 | 7110 | Multiple system without spiral structure |
| IRS 5+spiral | 285.450130 | -36.955705 | 9213 | Multiple system plus spiral structure |
| IRS 6a+b | 285.459790 | -36.943242 | 9.21.3 | Unresolved binary |
| V 710 | 285.46066 | -36.96934 | 9714 | SMM3 (Nutter et al. 2005), IRS 1 |
| IRS 7w | 285.47973 | -36.95577 | 47669 | Uncertain due to proximity of IRS 7e, FP-34 |
| IRS 7e | 285.48414 | -36.95843 | 16224 | Uncertain due to proximity of IRS 7w , FP-34 |
| SMM 1A | 285.48138 | -36.961325 | 14822 | Nutter et al. (2005), source #13 (Chini et al. 2003) |
| SMM 2 | 285.493130 | -36.952151 | 122 | Nutter et al. (2005) |
| T CrA | 285.494140 | -36.963643 | 122 | |
| B185839.6-3658 | 285.50792 | -36.899722 | 0.120.03 | BD candidate |
| CrA-159 | 285.637520 | -36.972469 | 0.1110.016 | |
| IRAS 18598 | 285.743990 | -37.126549 | 525 | IRAS 18598 |
| VV CrA | 285.778000 | -37.213581 | 8012 | Extended? |
| CrA-45 | 285.816690 | -37.235688 | 0.920.13 | YSO (Peterson et al. 2011) |
| R CrA | 285.47343 | -36.952274 | 7110 | Strongly contaminated by IRS 7 |
| SMM 1A s | 285.47859 | -36.97195 | 132 | Groppi et al. (2007) |
| #19 | 285.5521 | -36.9544 | 0.720.11 | Chini et al. (2003), part of large cloud structure |
| Source ID | RA(J2000) | DEC (J2000) | Flux | Comments |
|---|---|---|---|---|
| (deg) | (deg) | (Jy) | ||
| S CrA | 285.285790 | -36.955485 | 13.62.7 | |
| G-122 | 285.421180 | -36.953821 | 2.20.4 | Sicilia-Aguilar et al.(2008) |
| IRS 2 | 285.422310 | -36.974903 | 6112 | |
| IRS 2+ring | 285.422310 | -36.974903 | 10320 | Including ring-like structure |
| IRS 5a+b + FP-25 | 285.451320 | -36.954874 | 235 | Multiple system without spiral structure |
| IRS 5a+b/FP-25 + spiral | 285.451320 | -36.954874 | 13126 | Multiple system plus spiral structure |
| IRS 6a+b | 285.460040 | -36.943701 | 112 | |
| V 710 | 285.461110 | -36.968953 | 7014 | IRS 1, extended? |
| SMM 1A s | 285.47914 | -36.97314 | 307 | Groppi et al.(2007), extended? |
| IRS 7w+e | 285.4812 | -36.9564 | 880170 | Binary plus surrounding structure |
| SMM 2 | 285.49313 | -36.95201 | 255 | |
| T CrA | 285.49493 | -36.96386 | 133 | Uncertain due to proximity of IRS 7w/e |
| APEX 13+15 | 285.552040 | -37.008617 | 0.460.10 | Sicilia-Aguilar (2011a), extended |
| APEX 6 | 285.577930 | -37.023607 | 0.400.08 | Sicilia-Aguilar (2011a), extended |
| APEX 16 | 285.599610 | -36.942940 | 0.280.06 | Sicilia-Aguilar (2011a), extended |
| APEX 19 | 285.635820 | -37.033284 | 0.120.03 | Sicilia-Aguilar (2011a), extended |
| IRAS 18598 | 285.744070 | -37.126434 | 423 | Extended? |
| APEX 7+10+24 | 285.770620 | -37.242373 | 0.240.05 | Sicilia-Aguilar (2011a), extended |
| VV CrA | 285.778020 | -37.213602 | 6613 | |
| CrA-45 | 285.816670 | -37.235619 | 0.810.16 | Peterson et al. (2011) |
| #19 North | 285.5520 | -36.9549 | 133 | Part of source #19 from Chini et al.(2003), extended |
| #19 South | 285.5646 | -36.9631 | 2.40.5 | Part of source #19 from Chini et al.(2003), extended |
Broad-band continuum data were taken with the Photodetector Array Camera & Spectrometer (PACS, Pilbratt et al. 2010) on board the Herschel spacecraft. The data were obtained as part of the Herschel Gould Belt Survey (P.I. P. André) in a similar way to the rest of Gould Belt targets. Square scan maps with an extent of almost 89 arcmin on a side were obtained simultaneously in the 100 and 160 m filters on April 18, 2011. The nominal scan speed was 20′′/s. For the first stage of the data reduction we used customized Jython scripts within the HIPE333HIPE is a joint development by the Herschel Science Ground Segment Consortium, consisting of ESA, the NASA Herschel Science Center, and the HIFI, PACS and SPIRE consortia. environment, version 7.3.0 (Ott et al. 2010). In addition to the standard steps to calibrate the raw data from internal units to Jy/pixel and to remove glitches and other bad data in the scan time lines, we applied additional corrections for electronic cross talk as well as for non–linearity in the PACS detector response for the brightest compact sources. These so-called Level1 data were further processed with Scanamorphos (Roussel 2012). This program has its own heuristic algorithms to remove artifacts caused by detector flickering noise as well as spurious bolometer temperature drifts, being better suited to the case of extended emission, compared to the standard approach of high–pass filtering that is implemented in HIPE. We used version 14 of Scanamorphos. The field of view of the entire maps is large and contains large areas with low emission (especially in the 100 m map). Since we are mainly interested in the CrA point sources, we did not apply the galactic option that is used in case of high background levels and extended emission dominating the maps. The final maps were projected onto an 2 ′′/pixel grid (100 m) and 3′′pixel (160 m) within Scanamorphos and written out as fits files for further analysis.
The photometry was performed on the final map (see Tables 1 and 2). Given the characteristics of our objects (usually either relatively faint targets or extended sources), we chose to make aperture photometry. For non-extended (or marginally extended), point-like sources, we used IRAF444IRAF is distributed by the National Optical Astronomy Observatories, which are operated by the Association of Universities for Research in Astronomy, Inc., under cooperative agreement with the National Science Foundation. tasks and to extract the positions of the sources and to perform aperture photometry. We used the apertures and sky parameters used for the DUNES program (Mora, private communication) to maximize S/N, namely apertures of 5” and 8” for the 100 m and 160 m bands, respectively, with their corresponding aperture corrections of 1.949 (100 m) and 1.919 (160 m). The sky regions were selected according to the local background of each individual sources, given the enormous variability of the cloud and background emission in few-arcsecs scales. In general, large separations between the source and the sky annulus would ensure that the fraction of source flux within the sky annulus is minimal, but in the cases with nearby sources or variable cloud emission, this option is not viable. Therefore, we used sky annuli in the range 12-30” (100 m) and 18-120” (160 m), depending on each specific source, with widths of the sky annulus ranging 2-20” (100 m) and 3-30” (160 m), respectively. The flux errors were derived considering the local background rms and the values of the correlated noise derived for the DUNES program, which depend on the pixel size of the maps (in our case, 2” and 3” for the 100 m and 160 m maps, respectively). In order to account for any other potential sources of error, including flux calibration and eventual aperture effects, we also included an empirical 10% error in quadrature. This is the dominant source of error for bright sources, while the faint sources are dominated by the sky noise.
For the extended and relatively bright sources, we used the CLASS/GREG application from the GILDAS software package555See http://www.iram.fr/IRAMFR/GILDAS/ in order to accurately select the emission structure, to measure it flux, and the corresponding sky. In this case, no aperture correction was used, and the errors were obtained in the same way than for the point-like sources666In case of isolated extended sources, the size of the selected area encloses all the emission. Nevertheless, in case of nearby/blended sources, part of the flux may be lost and some flux from nearby sources may be present, so the error estimates include the flux variations observed when modifying the selected contours. The central part of the cluster (see Figures 1 and 2) contains several very close, extended sources that are not easy to separate (e.g. IRS 7w/e, IRS 5a/b). The flux for these sources is thus uncertain, as we will discuss when individual sources are presented. There are several sources that appear point-like with some additional extended structure (e.g. IRS 2, the IRS 5 complex). For the analysis of the source spectral energy distribution (SED), we measured the compact part, and the extended structure will be discussed separately. Some of the multiple sources do not appear resolved at all wavelengths. For instance, in the IRS 5 complex, containing IRS 5a, IRS 5b, and FP-25 (also known as IRS 5 N), IRS 5a/b appear blended, but FP-25 is resolved at 100 m. The complex appears as an elongated structure containing the three objects at 160 m. IRS 7w/e are also resolved at 100 m but not at 160 m, and both objects are very close to (but not blended with) the candidate Class 0 object SMM 1 A. The brightness of all these sources ensures they are all detected, but the presence of substantial nebular extended emission around them and the nearby objects is the main source of error in their photometry.
In general, the Herschel data offer an excellent view of the cluster center, where Spitzer surveys suffered from saturation and artifacts due to the presence of very bright sources, and submillimetre/millimetre studies lack enough spatial resolution to separate the emission from individual sources. It also reveals substantial cloud structure where evidence for extended material was not conclusive at other wavelengths (Figure 1).
2.2 Other data
In order to complete the study of the different sources, we used the available optical, IR, and millimetre data for the cluster members. The summary of all the data for the sources studied in this paper is shown in Table LABEL:sed-table. Optical photometry is available in Bibo et al. (1992) for the bright sources, and López-Martí et al. (2004) for the fainter members. Most of the IR Spitzer photometry was published in Sicilia-Aguilar et al. (2008) and Currie & Sicilia-Aguilar (2011), including several IRS spectra, and Peterson et al. (2011) presents detailed Spitzer IRAC and MIPS photometry for several of the sources already mentioned in the previous literature, plus some new member candidates. Submillimetre/millimetre data is listed in Groppi et al. (2004, 2007), Nutter et al. (2005), Chini et al. (2003), and Peterson et al.(2011).
We also revised the archive Spitzer/MIPS 70 m data (AOR 3664640) for all the sources using smaller apertures and improved aperture corrections, since some of the Sicilia-Aguilar et al. (2008) fluxes at 70 m were larger than expected considering the MIPS 24 m point and the Herschel data (strongly suggesting contamination by nebular emission). On the other hand, the 70 m fluxes of many of the objects listed in Peterson et al. (2011) appeared lower than expected from the 24 and 100 m fluxes. An important problem for the Spitzer 70 m photometry is that the field presents zones of substantial nebular emission, plus ghosts produced by the bright objects in the field, together with the fact that there is a non-negligible part of the flux at distances of 100” (aperture correction of 1.10 for an annulus of 100” radius, according to the MIPS manual). We thus followed different procedures depending on the background of each object. For faint objects in the proximity of other sources or ghosts, we used a small aperture of 14.2” (sky annulus 16-26.5”) with a large aperture correction (2.79). For isolated sources, we used a 40.4” aperture with a 1.27 aperture correction and sky annulus 152-168”. Both aperture corrections were obtained for isolated, known young stellar objects (YSO) in the field, to avoid contamination by cloud material, and to minimize the temperature dependence of the aperture correction. In the case of objects in crowded fields, the sky annulus had to be set to avoid the presence of nearby emission, with the problem that there is non-negligible emission from the object at these close distances. Nevertheless, for faint objects usually the background emission and standard deviation dominate over the object flux at 16-26.5”. This results in a typical uncertainty around 10%, which exceeds the uncertainties derived from calibration and background subtraction. For the final fluxes, we used the zeropoint in the MIPS manual (0.7780.012 Jy).
3
| ID, RA DEC (J2000), AV (mag) | ( m) | Flux (Jy) | Uncertainty (Jy) | References/Comments |
|---|---|---|---|---|
| CrA-432,19:00:59.74 -36:47:10.9, AV=2.7f | 0.66 | 7e-5 | 1e-5 | LM05 |
| 0.80 | 5e-4 | 1e-4 | LM05 | |
| 1.22 | 3.3e-3 | 1e-4 | 2MASS | |
| 1.63 | 4.7e-3 | 2e-4 | 2MASS | |
| 2.19 | 4.7e-3 | 2e-4 | 2MASS | |
| 3.6 | 4.5e-3 | 2e-4 | SA08 | |
| 4.5 | 3.8e-3 | 3e-4 | SA08 | |
| 5.8 | 3.5e-3 | 2e-4 | SA08 | |
| 8.0 | 3.3e-3 | 3e-4 | SA08 | |
| 23.9 | 3.1e-3 | 4e-4 | SA08 | |
| 100 | 0.019 | — | TW | |
| S CrA,19:01:08.62 -36:57:20.3, AV=4.0f | 1.22 | 0.828 | 0.019 | 2MASS |
| 1.63 | 1.54 | 0.04 | 2MASS | |
| 2.19 | 2.29 | 0.05 | 2MASS | |
| 3.6 | 2.66 | 0.01 | CSA11 | |
| 4.5 | 3.16 | 0.01 | CSA11 | |
| 5.8 | 3.81 | 0.02 | CSA11 | |
| 8.0 | 4.17 | 0.02 | CSA11 | |
| 9 | 4.41 | 0.08 | AKARI | |
| 18 | 7.19 | 0.10 | AKARI | |
| 65 | 13.8 | 4.3 | IRAS | |
| 70 | 12.4 | 1.2 | TW | |
| 100 | 17.7 | 2.6 | TW | |
| 160 | 13.6 | 2.7 | TW | |
| 450 | 3 | 0.3 | N05 | |
| 850 | 0.7 | 0.2 | N05 | |
| 870 | 0.77 | 0.02 | SA11 | |
| 1200 | 0.29 | 0.03 | Ch03 | |
| CrA-4110, 19:01:16.29 -36:56:28.2, AV=0.41SA08 | 0.66 | 4e-4 | 1e-4 | LM05 |
| 0.80 | 2.2e-3 | 1e-4 | LM05 | |
| 1.22 | 0.0103 | 2e-4 | 2MASS | |
| 1.63 | 0.0121 | 2e-4 | 2MASS | |
| 2.19 | 0.0111 | 2e-4 | 2MASS | |
| 3.6 | 9.1e-3 | 2e-4 | SA08 | |
| 4.5 | 8.2e-3 | 2e-4 | SA08 | |
| 5.8 | 5.7e-3 | 4e-4 | SA08 | |
| 8.0 | 5.3e-3 | 2e-4 | SA08 | |
| 23.9 | 7-9e-3 | 7e-4 | SA08 | |
| 100 | 0.025 | — | TW | |
| CrA-466, 19:01:18.93 -36:58:28.2, AV=8.1SA08 | 0.66 | 1e-46 | 1e-4 | LM05 |
| 0.80 | 1e-3 | 1e-4 | LM05 | |
| 1.22 | 0.0115 | 3e-4 | 2MASS | |
| 1.63 | 0.0324 | 9e-4 | 2MASS | |
| 2.19 | 0.0419 | 1e-3 | 2MASS | |
| 3.6 | 0.0402 | 4e-4 | SA08 | |
| 4.5 | 0.0374 | 4e-4 | SA08 | |
| 5.8 | 0.0356 | 1.1e-3 | SA08 | |
| 8.0 | 0.0331 | 5e-4 | SA08 | |
| 23.9 | 0.0522 | 1e-4 | SA08 | |
| 70.0 | 0.146 | 0.027 | TW | |
| 100 | 0.32 | 0.05 | TW | |
| G-87, 19:01:32.32 -36:58:03.0, AV=16SA11 | 1.22 | 1.80e-3 | 7e-5 | 2MASS |
| 1.63 | 9.1e-3 | 3e-4 | 2MASS | |
| 2.19 | 0.0170 | 4e-4 | 2MASS | |
| 3.6 | 0.020 | 1e-3 | SA08 | |
| 4.5 | 0.020 | 1e-3 | SA08 | |
| 5.8 | 0.0164 | 8e-4 | SA08 | |
| 8.0 | 0.0137 | 7e-4 | SA08 | |
| 23.9 | 0.022 | 2e-3 | SA08 | |
| 100 | 0.082 | — | TW | |
| G-85, 19:01:33.85 -36:57:44.8, AV=19SA11 | 1.22 | 2e-361 | 9e-5 | 2MASS |
| 1.63 | 0.0175 | 4e-4 | 2MASS | |
| 2.19 | 0.0411 | 8e-4 | 2MASS | |
| 3.6 | 0.0687 | 3e-4 | SA08 | |
| 4.5 | 0.0760 | 3e-4 | SA08 | |
| 5.8 | 0.0661 | 3e-4 | SA08 | |
| 8.0 | 0.0691 | 3e-4 | SA08 | |
| 23.9 | 0.162 | 2e-3 | SA08 | |
| 70 | 0.41 | 0.04 | TW | |
| 100 | 0.42 | 0.06 | TW | |
| 160 | 0.69 | — | TW | |
| G-122, 19:01:40.9 -36:57:15 | 3.6 | 2e-30 | 2e-4 | SA08 |
| 4.5 | 2.1e-3 | 2e-4 | SA08 | |
| 5.8 | 6.8e-3 | 8e-4 | SA08 | |
| 8.0 | 0.0147 | 4e-4 | SA08 | |
| 23.9 | 0.123 | 6-3 | SA08 | |
| 70 | 0.550 | 0.023 | TW | |
| 100 | 0.61 | 0.09 | TW | |
| 160 | 2.2 | 0.4 | TW | |
| IRS 2, 19:01:41.56 -36:58:31.2 | 1.22 | 5e-30 | 1e-4 | 2MASS |
| 1.63 | 0.129 | 4e-3 | 2MASS | |
| 2.19 | 0.949 | 0.023 | 2MASS | |
| 8.0 | 7.712:s | 0.018 | CSA11 | |
| 70 | 32.8 | 3.3 | TW | |
| 100 | 82 | 12 | TW | |
| 160 | 61 | 12 | TW | |
| 450 | 12 | 4 | N05 | |
| 850 | 2.0 | 0.2 | N05 | |
| 870 | 1.44 | 0.01 | SA11 | |
| 1200 | 1.32 | 0.20 | Ch03 | |
| HBC 677, 19:01:41.62 -36:59:52.7, AV=4.5f | 0.44 | 3e-4 | 1e-4 | SIMBAD |
| 0.55 | 1.1e-3 | 1e-4 | SIMBAD | |
| 1.22 | 0.102 | 3e-3 | 2MASS | |
| 1.63 | 0.247 | 6e-3 | 2MASS | |
| 2.19 | 0.37 | 0.01 | 2MASS | |
| 3.6 | 0.302 | 2e-3 | CSA11 | |
| 4.5 | 0.292 | 2e-3 | CSA11 | |
| 5.8 | 0.279 | 2e-3 | CSA11 | |
| 8.0 | 0.291 | 1e-3 | CSA11 | |
| 100 | 0.089 | 0.014 | TW | |
| IRS 5a+bu, 19:01:48.06 -36:57:22.0 | 1.63 | 3e-35 | 4e-4 | 2MASS |
| 2.19 | 0.060 | 3e-3 | 2MASS | |
| 3.6 | 0.2925 | 4e-4 | CSA11 | |
| 4.5 | 0.5464 | 6e-4 | CSA11 | |
| 8.0 | 1.706 | 5e-3 | CSA11 | |
| 70 | 17.3 | 1.7 | TW | |
| 100 | 19.4 | 2.8 | TW | |
| 160 | 23 | 5 | TW, IRS 5ab+FP-25u | |
| FP-25, 19:01:48.46 -36:57:14.9 | 2.19 | 6e-3 | 1e-3 | 2MASS |
| 3.6 | 8.1e-3 | 1e-4 | CSA11 | |
| 4.5 | 0.0209 | 1e-4 | CSA11 | |
| 5.8 | 0.0360 | 2e-4 | CSA11 | |
| 8.0 | 0.0529 | 2e-4 | CSA11 | |
| 100 | 15 | 3 | TW | |
| 160 | 23 | 5 | TW, IRS 5ab+FP-25u | |
| 450 | 12 | 4 | N05 | |
| 850 | 1.8 | 0.2 | N05 | |
| 1300 | 0.095 | 0.007 | P11 | |
| IRS 6, 19:01:50.48 -36:56:38.4 | 1.22 | 4e-4 | 1e-4 | 2MASS |
| 1.63 | 0.014 | — | 2MASS | |
| 2.19 | 0.048 | — | 2MASS | |
| 3.6 | 0.1139 | 3e-4 | CSA11 | |
| 4.5 | 0.1513 | 5e-4 | CSA11 | |
| 8.0 | 0.1962 | 6e-4 | CSA11 | |
| 23.9 | 0.348 | 0.035 | P11 | |
| 70 | 5.30 | 0.5 | TW | |
| 100 | 9.2 | 1.3 | TW | |
| 160 | 11 | 2 | TW | |
| V 710, 19:01:50.68 -36:58:09.6 | 1.22 | 6.5e-4 | 6e-5 | 2MASS |
| 1.63 | 0.036 | 1e-3 | 2MASS | |
| 2.19 | 0.570 | 0.026 | 2MASS | |
| 4.5 | 6.178 | 0.018 | CSA11 | |
| 70 | 108 | 11 | TW | |
| 100 | 97 | 14 | TW | |
| 160 | 70 | 14 | TW | |
| 450 | 9 | 3 | N05 | |
| 850 | 1.5 | 0.2 | N05 | |
| CrA-465, 19:01.53.74 -37:00:33.9, AV=0.08SA08 | 0.66 | 7e-5 | 1e-5 | LM05 |
| 0.80 | 5e-4 | 1e-4 | LM05 | |
| 1.22 | 3.7e-3 | 1e-4 | 2MASS | |
| 1.63 | 4.5e.3 | 2e-4 | 2MASS | |
| 2.19 | 4.0e-3 | 2e-4 | 2MASS | |
| 3.6 | 3.4e-3 | 3e-4 | SA08 | |
| 4.5 | 2.9e-3 | 2e-4 | SA08 | |
| 8.0 | 2.5e-3 | 3e-4 | SA08 | |
| 23.9 | 0.010 | 1e-3 | SA08 | |
| 100 | 0.027 | — | TW | |
| SMM 1A s, 19:01:54.9 -36:58:19 | 100 | 13 | 2 | TW |
| 160 | 30 | 7 | TW | |
| 450 | 6.9 | 1.7 | G07 | |
| 850 | 1.2 | 0.2 | G07 | |
| IRS 7w, 19:01:55.32 -36:57:21.9 | 1.22 | 0.015 | 5e-3 | 2MASS |
| 1.63 | 5e-3 | 2e-3 | 2MASS | |
| 2.19 | 0.031 | 0.01 | 2MASS | |
| 3.6 | 0.0988 | 3e-4 | CSA11 | |
| 4.5 | 0.2662 | 7e-4 | CSA11 | |
| 70 | 234 | 36 | TW | |
| 100 | 476 | 69 | TWu | |
| 160 | 880 | 170 | TWu | |
| 450 | 45 | 15 | N05 | |
| 850 | 5.6 | 0.6 | N05 | |
| SMM 1 A, 19:01:55.5 -36:57:41 | 100 | 148 | 22 | TW |
| 450 | 151 | 30 | G07 | |
| 850 | 14.5 | 2.2 | G07 | |
| SMM 2,19:01:58.54 -36:57:08.5 | 1.22 | 2.3e-4 | 2e-5 | 2MASS |
| 1.63 | 6.3e-4 | 8e-5 | 2MASS | |
| 2.19 | 2.01e-3 | 7e-5 | 2MASS | |
| 3.6 | 0.0225 | 1e-33 | P11 | |
| 4.5 | 0.0721 | 3e-38 | P11 | |
| 5.8 | 0.136 | 8e-3 | P11 | |
| 8.0 | 0.195 | 0.011 | P11 | |
| 23.9 | 0.807 | 0.078 | P11 | |
| 100 | 12 | 2 | TW | |
| 160 | 25 | 5 | TW | |
| 450 | 10 | 3 | N05 | |
| 850 | 1.5 | 0.2 | N05 | |
| 450 | 5.8 | 1.5 | G07 | |
| 850 | 1.2 | 0.2 | G07 | |
| 1300 | 0.135 | 0.027 | P11 | |
| T CrA,19:01:58.78 -36:57:49.9, AV=2.45AVA04 | 0.36 | 9e-3 | 5e-3 | B92 |
| 0.44 | 0.037 | 0.018 | B92 | |
| 0.55 | 0.069 | 1e-3 | B92 | |
| 1.22 | 0.421 | 0.014 | 2MASS | |
| 1.63 | 0.846 | 0.033 | 2MASS | |
| 2.19 | 1.460 | 0.035 | 2MASS | |
| 4.5 | 2.124 | 9e-3 | CSA11 | |
| 5.8 | 2.365 | 0.011 | CSA11 | |
| 100 | 12 | 2 | TW | |
| 160 | 13 | 3 | TW | |
| B185839.6-3658, 19:02:01.94 -36:54:00.1, AV=13FP07 | 1.63 | 1.6e-4 | 2.5 | W97 |
| 2.19 | 3.3e-4 | 2e-5 | W97 | |
| 3.6 | 2.9e-4 | 3e-5 | P11 | |
| 4.5 | 2.6e-4 | 2e-5 | P11 | |
| 5.8 | 2e-4 | 1e-4 | P11 | |
| 8.0 | 1.0e-3 | 1e-4 | P11 | |
| 23.9 | 3.3e-3 | 4e-4 | P11 | |
| 100 | 0.12 | 0.03 | TW | |
| G-14, 19:02:12.01 -37:03:09.3, AV=1.9SA08 | 1.22 | 6.8e-3 | 2e-4 | 2MASS |
| 1.63 | 9.5e-3 | 3e-4 | 2MASS | |
| 2.19 | 8.8e-3 | 2e-4 | 2MASS | |
| 3.6 | 6.7e.3 | 3e-4 | SA08 | |
| 4.5 | 5.7e-3 | 3e-4 | SA08 | |
| 5.8 | 3.7e-3 | 3e-4 | SA08 | |
| 8.0 | 3.6e-3 | 3e-4 | SA08 | |
| 23.9 | 4.6e-3 | 5e-4 | SA08 | |
| 100 | 0.020 | — | TW | |
| CrA-4109, 19:02:16.67 -36:45:49.3, AV=0f | 0.66 | 1e-33 | 1e-4 | LM05 |
| 0.80 | 6.6e-3 | 1e-4 | LM05 | |
| 1.22 | 0.0247 | 6e-4 | 2MASS | |
| 1.63 | 0.0307 | 7e-4 | 2MASS | |
| 2.19 | 0.0249 | 6e-4 | 2MASS | |
| 3.6 | 0.0147 | 2e-4 | SA08 | |
| 5.8 | 6.7e-3 | 6e-4 | SA08 | |
| 23.9 | 0.0117 | 4e-4 | SA08 | |
| 100 | 0.018 | — | TW | |
| G-1, 19:02:27.08 -36:58:13.2, AV=3.4SA08 | 1.22 | 0.297 | 8e-3 | 2MASS |
| 1.63 | 0.492 | 0.020 | 2MASS | |
| 2.19 | 0.440 | 8e-3 | 2MASS | |
| 3.6 | 0.311 | 2e-3 | SA08 | |
| 4.5 | 0.269 | 1e-3 | SA08 | |
| 5.8 | 0.245 | 2e-3 | SA08 | |
| 8.0 | 0.246 | 1e-3 | SA08 | |
| 23.9 | 0.151 | 1e-3 | SA08 | |
| 100 | 0.017 | — | TW | |
| CrA-159, 19:02:33.08 -36:58:21.2, AV=5.0f | 1.22 | 0.0916 | 2.9e-3 | 2MASS |
| 1.63 | 0.201 | 5e-3 | 2MASS | |
| 2.19 | 0.266 | 5e-3 | 2MASS | |
| 3.6 | 0.356 | 0.019 | P11 | |
| 4.5 | 0.335 | 0.020 | P11 | |
| 5.8 | 0.347 | 0.017 | P11 | |
| 8.0 | 0.339 | 0.017 | P11 | |
| 23.9 | 0.238 | 0.022 | P11 | |
| 70 | 0.29 | 0.03 | TW | |
| 100 | 0.111 | 0.016 | TW | |
| 160 | 0.24 | — | TW | |
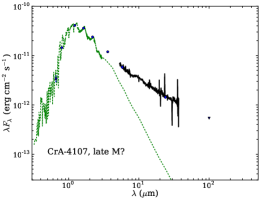
| CrA-4107,19:02:54.64 -36:46:19.2, AV=0f | 0.66 | 7e-4 | 1e-4 | LM05 |
| 0.80 | 3.9e-3 | 1e-4 | LM05 | |
| 1.22 | 0.0166 | 4e-4 | 2MASS | |
| 1.63 | 0.0195 | 5e-4 | 2MASS | |
| 2.19 | 0.0174 | 4e-4 | 2MASS | |
| 3.6 | 0.0143 | 1e-4 | SA08 | |
| 5.8 | 0.0112 | 4e-4 | SA08 | |
| 23.9 | 0.0114 | 4e-4 | SA08 | |
| 100 | .018 | — | TW | |
| IRAS 18598, 19:02:58.56 -37:07:35.6, AV=5f | 1.63 | 5e-4 | 1e-4 | 2MASS |
| 2.19 | 1e-3 | 1e-4 | 2MASS | |
| 3.6 | 9.8e-3 | 4e-5 | CSA11 | |
| 4.5 | 0.0224 | 4e-4 | CSA11 | |
| 5.8 | 0.022 | 1e-3 | CSA11 | |
| 8.0 | 0.0138 | 4e-4 | CSA11 | |
| 23.9 | 2.474 | 1e-3 | CSA11 | |
| 18 | 0.884 | 0.026 | AKARI | |
| 70 | 32.2 | 3.2 | AKARI | |
| 870 | 3.39 | 0.33 | SA11 | |
| 1200 | 0.67 | 0.34 | Ch03 | |
| 100 | 52 | 5 | TW | |
| 160 | 42 | 3 | TW | |
| 450 | 9 | 3 | N05 | |
| 850 | 1.5 | 0.2 | N05 | |
| 1300 | 0.103 | 0.008 | P11 | |
| VV CrA,19:03:06.80 -37:12:49.1, AV=15f,B11 | 1.22 | 0.179 | 5e-3 | 2MASS, SIMBAD |
| 1.63 | 0.729 | 0.030 | 2MASS, SIMBAD | |
| 2.19 | 2.028 | 0.040 | 2MASS, SIMBAD | |
| 3.6 | 4.753 | 0.017 | CSA11 | |
| 4.5 | 6.160 | 0.022 | CSA11 | |
| 5.8 | 15.21 | 0.05 | CSA11 | |
| 9 | 24.1 | 0.2 | AKARI | |
| 18 | 39.7 | 4.3 | AKARI | |
| 12 | 31.9 | 3 | IRAS | |
| 25 | 69.1 | 7 | IRAS | |
| 60 | 131.0 | 13 | IRAS | |
| 100 | 95 | 10 | IRAS | |
| 70 | 55 | 6 | TW | |
| 100 | 80 | 12 | TW | |
| 160 | 66 | 13 | TW | |
| 450 | 12 | 4 | N05 | |
| 850 | 2.0 | 0.2 | N05 | |
| 870 | 1.66 | 0.06 | SA11 | |
| 1200 | 0.58 | 0.06 | Ch03 | |
| CrA-45, 19:03:16.09 -37:14:08.2, AV=10f | 1.22 | 0.0271 | 7e-4 | 2MASS |
| 1.63 | 0.0775 | 2e-3 | 2MASS | |
| 2.19 | 0.1160 | 3e-3 | 2MASS | |
| 3.6 | 0.223 | 0.012 | P11 | |
| 4.5 | 0.224 | 0.012 | P11 | |
| 5.8 | 0.256 | 0.013 | P11 | |
| 8.0 | 0.278 | 0.014 | P11 | |
| 23.9 | 0.676 | 0.063 | P11 | |
| 70 | 1.18 | 0.12 | TW | |
| 100 | 0.92 | 0.13 | TW | |
| 160 | 0.81 | 0.16 | TW |
3 The Herschel view of the CrA members
In this section, we describe the most important sources in the region related to known YSOs, as seen from the Herschel/ PACS observations. We focus the discussion on those objects that are known to be young cluster members from optical, X-ray, Spitzer, and submillimetre studies (see references in the Introduction and Section 2.2). In addition to these objects, we have found several other sources in the mapped region that have not previously been classified as YSOs in the literature, and some extended galaxies. Some of the new PACS sources may be extragalactic objects, given that their positions appear unrelated to other cloud emission. Conversely, a number of other sources appear spatially coincident to the more general cloud emission, so they could be candidate members (either TTS or protostars), but the lack of further data on them does not allow us to unambiguously determine their cluster membership. These sources will be discussed in a follow-up publication by the Gould Belt Survey group.
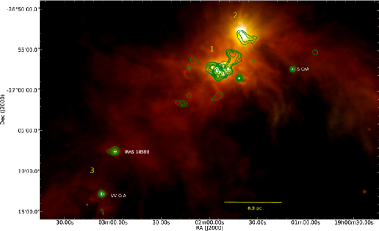
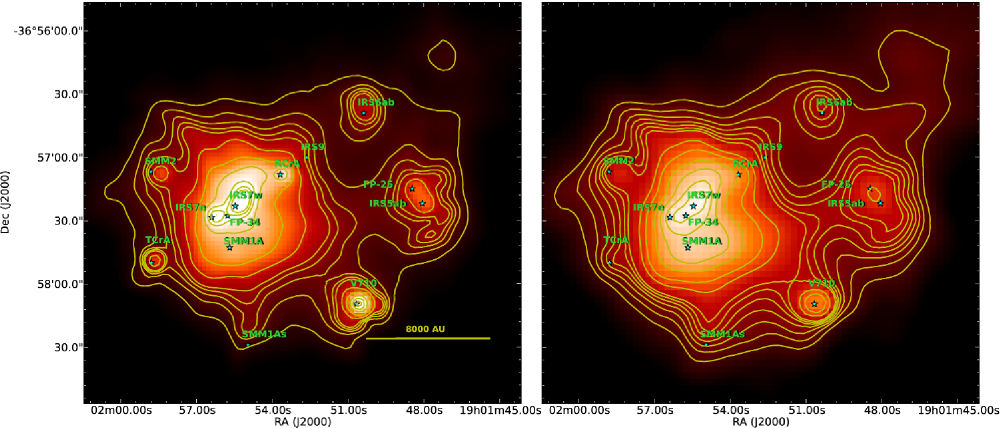
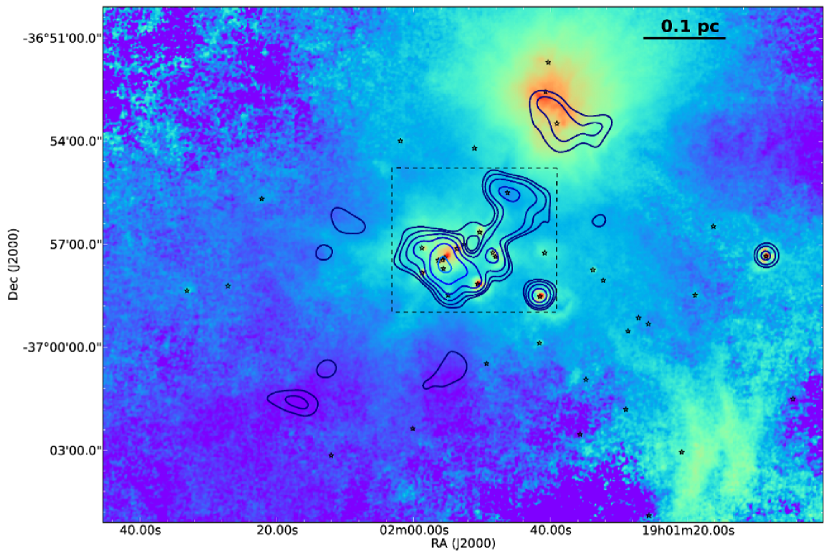
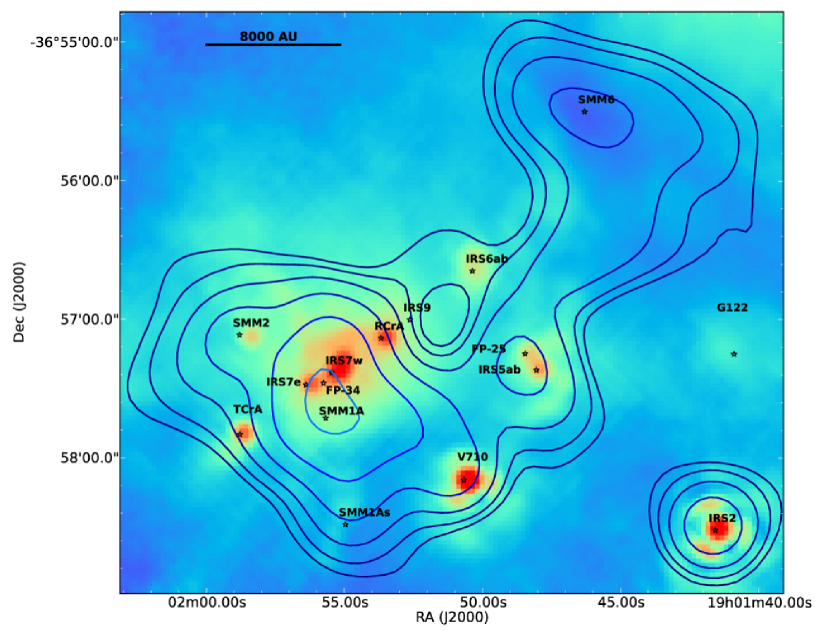
The Herschel PACS data presents a new view of the CrA star-forming region (Figure 1). The emission at 100 and 160 m follows well our previous APEX/LABOCA observations at 870 m (Sicilia-Aguilar et al. 2011a), but the much higher spatial resolution and sensitivity of Herschel reveals several new interesting structures. As in the APEX/LABOCA data, the brightest part of the cloud appears associated with the surroundings of the embedded sources IRS 7w and SMM 1 A (see Figure 1 and 2). This is also in agreement with the results of Chini et al. (2003) and Groppi et al. (2007). The brightest part of the cloud contains two subclusters, the first (and brightest) central cluster, containing IRS 7e/w, SMM 1 A/As, R CrA, T CrA, IRS 5, IRS 6, and V 710 (Figure 2), and the second located to the North, around TY CrA and HD 176386, with G-65 (Figure 3). A dark lane (at Herschel wavelengths), coincident with the source SMM 6 in Nutter et al.(2005) and with the secondary 870 m peak in our LABOCA map (Sicilia-Aguilar et al. 2011a) is visible between these two groups (see Figure 1). In the first subcluster, the emission peaks are clearly related to the embedded protostars (the IRS 7 and IRS 5 complexes, SMM 1 A/As, IRS 6, V 710; see Figure 2). The peak in the second one is not related to TY CrA nor HD 176386, but located between them. This is substantially different from the APEX/LABOCA observations, which showed a extended emission peaking at a position coincident with HD 176386, where the cloud density should be maximal (Figure 3).
In addition to the two subclusters, we have also detected strong emission from several less-embedded, independent sources in the region (IRS 2, S CrA, G-85, CrA-159, CrA-466, among others), including a third subcluster to the South, associated with several bright young objects (VV CrA, CrA-45, and IRAS 18598) and some 870 m extended emission (Sicilia-Aguilar et al. 2011a). Besides the individual YSOs, we confirm the presence of extended cloud emission covering the area where most of the known cluster members are located, including nebular emission associated with each subcluster, and extending in the directions suggested by the Graham (1992) observations and the extinction maps by Kainulainen et al.(2009). Furthermore, we mention the occurrence of radial striations mainly visible in the Herschel emission blob associated with the HD176386/TY CrA region (Figures 1 and 3). These might show an imprint of large scale collapse motions or the accretion of additional material on the central molecular clump, as seen for instance in the DR21 filament (Hennemann et al. 2012).
3.1 The IRS 7 complex
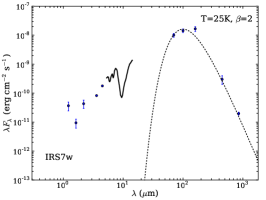
The brightest far-IR peak corresponds to the IRS 7 area (Figure 2). IRS 7 is a binary embedded protostar, composed of IRS 7w (the brightest one at IR wavelengths) and IRS 7e. To the South of both sources, we find the submillimetre source SMM 1 A (Nutter et al. 2005; Groppi et al. 2007). The PACS 100 m data resolves all three peaks, but the 160 m image shows an elongated structure with two peaks corresponding to IRS 7e/w, and a third emission structure related to SMM 1 A. Due to the difficulties to separate both objects from each other and from the extended cloud emission, the uncertainties in their fluxes are large (Table LABEL:sed-table). The PACS positions of IRS 7w/e are in good agreement with the MIPS 24 m and Chandra X-ray positions. In addition, the X-ray emission source FP-34 (source number 34 of Forbrich & Preibisch 2007; see also Garmire & Garmire 2003) is located close to IRS 7e, but cannot be identified with IRS 7e itself (see also Peterson et al. 2011). FP-34 appears as a single X-ray source located between the PACS emission peaks associated with IRS 7w, IRS 7e, and SMM 1 A. Although the bright emission in the region does not allow to determine whether a fourth, fainter embedded object is present at the position of FP-34, it could also indicate that the X-ray emission is produced by other means (e.g. shocks; Favata et al. 2002) in the interface between IRS 7w and IRS 7e, or a jet related to the less-evolved SMM 1 A source. At least one Herbig Haro object in the region is known to be source of X-ray emission (G-80; Sicilia-Aguilar et al. 2008).
The submillimetre source SMM 1A, identified by Nutter et al. (2005) as the brightest, most extended peak in the region, is detected by Herschel as a single peak at 100 m, and appears as a bright, extended emission structure at 160 m. This source and IRS 7 conform the brightest peak of our LABOCA observations, which could indicate the presence of a further highly embedded source, or a region of very high dust density in the proximity of the known protostars. To the South of SMM 1A we detect a further PACS source, identified as SMM 1As by Groppi et al.(2007) and without Spitzer counterparts. Both sources are Class 0 candidates and will be discussed in detail in Section 4.1.
3.2 IRS 2
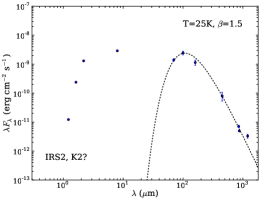
The embedded IRS 2 source, classified as a Class I protostar with a spectral type K2 by Forbrich & Preibisch (2007), is one of the most interesting objects in the PACS data (Figure 4). In both the 100 and 160 m images, it appears as a bright point-like source (with its 3-lobe structure closely resembling the PACS PSF) in the rim of a 5000 AU diameter ring- or bubble-like structure. The ring is clearly detected at the PACS wavelengths, but is not visible in the Spitzer/MIPS maps. At 870 m, our LABOCA map shows the object to be slightly elongated in the direction of the ring, but the elongation is marginal considering the beam size of 19.2” (Sicilia-Aguilar et al. 2011a). The best explanation is the presence of an envelope or cloud structure that is excavated by the (large opening-angle) stellar winds of IRS 2, that appears asymmetric with respect to this object due to a non-uniform distribution of material (for instance, if IRS 2 were located at the edge of the cloud). There is no evidence of extended emission in the other direction. Despite the relative proximity of the bright V 710 source and the cloud emission, any potential structure to the East of IRS 2 with brightness similar to the observed ring should be clearly identifiable and resolved.
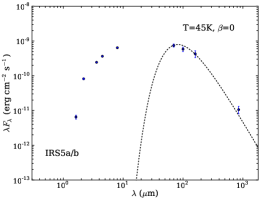
3.3 The IRS 5 complex
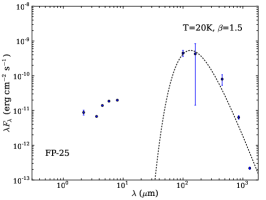
Next to IRS 2, the binary pair IRS 5a/b and the nearby X-ray source FP-25 (source number 25 from Forbrich & Preibisch 2007, also known as IRS 5N; Peterson et al. 2011) offer the next interesting structure resolved in the Herschel/PACS maps (Figure 2). The two components, IRS 5a and IRS 5b, with a projected separation of 78 AU for a distance of 130 pc (Nisini et al. 2005), are not resolved. FP-25 and IRS 5a/b are surrounded by substantial extended emission, in particular, a common filamentary structure that resembles a two-arm spiral with a resolved size corresponding to 4000 AU, considering a distance of 138 pc. The extended structure is not detected in the Spitzer maps, but it is consistently detected in the two PACS filters and follows the contours in our 870m LABOCA maps. IRS 5a/b dominates the Spitzer and PACS 100 m maps, but the single peak observed at 160 m is closer to FP-25, which could indicate that the latter is not much fainter, but more embedded than IRS 5a/b. Based on their Spitzer and SMA observations, Peterson et al.(2011) classified FP-25 as a Class I object, which is also consistent with our Herschel observations. The appearance of the spiral structure around the system is very similar to the ring detected around the young binary star SVS20 (which has a size of 68004000 AU; Eiroa et al. 1997) and to the predictions for binary formation (Bate 2000; Kley & Burkert 2000), although the size of the spiral arms around the IRS 5 complex is about 7 times larger than in Bate’s simulation. The initial size and mass of the cloud, the initial angular momentum, and the binary separation are important parameters in determining the final structure. The projected separation between IRS 5a/b and FP-25 is approximately 800 AU (instead of 60-100 AU as in Bate et al. 2000), which would imply that the structure of the system is more affected by the properties of the surrounding cloud and directly dependent on the initial angular momentum (Bate et al. 2000) and, in general, on the initial conditions (Kley & Burkert 2000). Therefore, the observations of a larger spiral structure are in principle consistent with the results of hydrodynamical simulations. Nevertheless, the scale of the structure and the presence of substantial cloud material around the sources does not exclude a complex, non-spherical structure like those that have been observed associated to the envelopes of some Class 0/I objects (Stutz et al. 2009; Tobin et al. 2011) or even heated material swept by the jets or winds of the embedded protostars, similar to what is seen near IRS 2.
3.4 Other Class I candidates within the central cluster: IRS 6, V 710, and SMM 2
IRS 6 has been identified as a binary with a projected separation slightly larger than IRS 5a/b (97 AU for a distance 130 pc; Nisini et al. 2005), but the pair is not resolved with Herschel/PACS. The source appears as a relatively faint (compared to the rest of protostellar candidates in the region) and extended source (Figure 2). Contrary to IRS 5 and IRS 2, the central emission is extended but there is no evidence for further structure like extended rings or filaments, nor a compact core. The lack of an emission peak and its SED suggest that the Herschel emission is consistent with an extended envelope around the protostars, maybe a common envelope for both IRS 6 components.
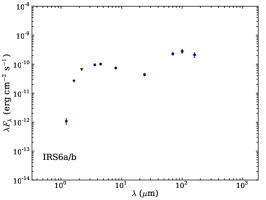
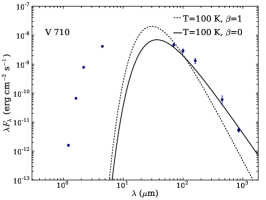
V 710 (Figure 2) has been classified as a K5-M0 Class I protostar (Forbrich & Preibisch 2007). At PACS wavelengths, it appears as a point-like, bright object near the IRS 7/IRS 5 complex. It is surrounded by strong extended emission associated with the central part of the cluster, although the object is bright enough to be clearly distinguished. The SED of the object (Figure 5) is consistent with an embedded protostar, with a peak suggestive of temperatures between 500 and 100 K.
SMM 2, detected by Nutter et al. (2005) at SCUBA wavelengths (450 and 850 m) and by Peterson et al.(2011) at 1.3 mm is also seen as an independent source in our Herschel maps (Figure 2). It is also marginally detected at IRAC wavelengths, well-detected at MIPS 24 m, and very bright at MIPS 70 m. The Herschel detection appears point-like, although surrounded by substantial extended emission. The SED is consistent with an embedded protostar, although the high fluxes measured at PACS wavelengths could indicate contamination by the surrounding cloud.
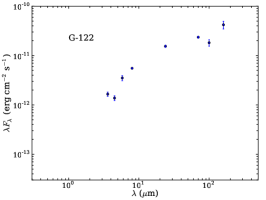
3.5 Very low-mass Class I objects: G-122 and nearby condensation
The PACS data reveal two compact condensations to the North of IRS 2 (Figure 4). One of them is associated with the X-ray source G-122, classified by Sicilia-Aguilar et al. (2008) as a probable Class I protostar. The other one is marginally detected at 100 m, but becomes brighter at 160 m. Both sources appear extended, with approximate sizes of the order of 1600 AU at 138 pc. Due to the presence of extended cloud emission, the photometry of the faintest source is uncertain, but G-122 is well detected with PACS. Combining Spitzer data, G-122 appears as a cold condensation that could correspond to a very low-mass Class I protostar (see Figure 5). The nearby faint object is not detected at any Spitzer wavelengths, but the similarities with G-122 could indicate it is another (fainter) very low-mass protostar. The projected separation between the centers of both objects is 26” or about 3600 AU at 138 pc.
 |
 |
 |
 |
 |
 |
 |
 |
 |
 |
 |
3.6 The solar- and intermediate-mass disked stars: S CrA, R CrA, and T CrA
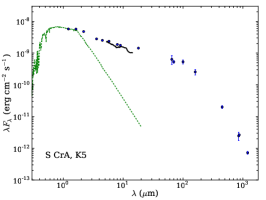
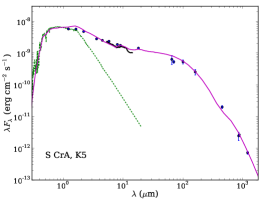
The binary source S CrA appears as a bright object at PACS wavelengths (see Figure 1). The source is relatively compact, but differences of 10-20% of the flux depending on the aperture selection suggest that it could be surrounded by some extended material, either of cloud or envelope origin. Its very complete SED (including optical, IR, and millimetre/submillimetre data) reveals a very massive and flared disk. Disagreement in the near- and mid-IR fluxes between the IRAC/MIPS and IRS data suggest that the short-wavelength emission could be variable, as it has been seen in other actively accreting young sources.
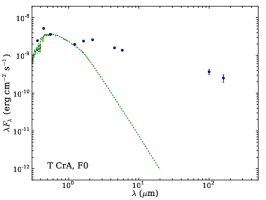
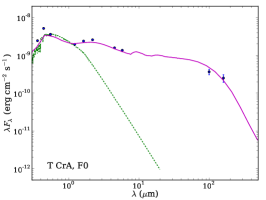
R CrA (spectral type A5; Bibo et al. 1992) and T CrA (spectral type F0; Acke & van den Ancker 2004) are the two intermediate-mass stars with disks in the densest part of the cluster (see Figure 2). They are both clearly detected in the PACS images, although the strength of the nearby sources (especially, the IRS 7 complex and the extended cloud structure) make it hard to quantify their fluxes. In particular, the measured flux for R CrA appears evidently contaminated by the nearby objects and cannot be used to constrain its disk properties. T CrA, being more distant from the main emission peaks, is measurable within reasonable limits. Its SED is consistent with the presence of a flared, massive disk, and in agreement with the spectral type of F0 and extinction AV=2.45 mag derived by Acke & van den Ancker (2004). The error in the flux at 160 m is nevertheless large, due to the presence of surrounding extended emission (Figure 6).
 |
 |
 |
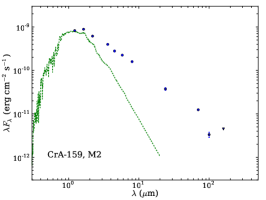
3.7 The low-mass CTTS: G-85, CrA-466 (G-113), CrA-159, HBC 677, and B18598.6-3658
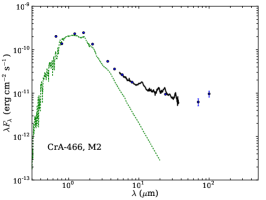
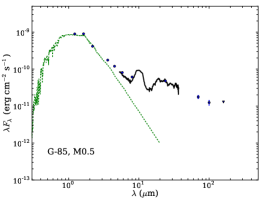
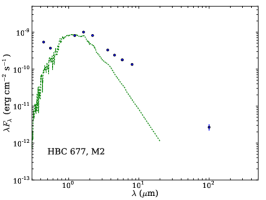
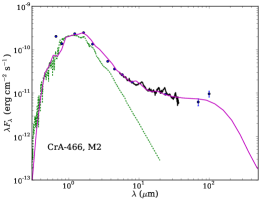
A few of the low-mass CTTS in the Coronet cluster are detected in the PACS images (Figure 7). The extincted M0.5 source G-85 (Sicilia-Aguilar et al. 2008, 2011a; Figure 4) is well-detected at 100 m, and marginally detected at 160 m. The M2 star CrA-466 (also known as X-ray source G-113) is also detected in both PACS channels, although the 160 m detection is marginal. Two further M2-type sources, CrA-159 and HBC 677, are well detected at 100 m, but do not appear in the 160 m images (Figure 4).
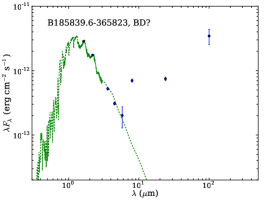
There is emission detected towards the brown dwarf (BD) candidate B18598.6-3658 (Wilking et al. 1997; Forbrich & Preibisch 2007), although its SED is hard to interpret. Considering the near-IR data from Wilking et al. (1997), the extinction estimate from Forbrich & Preibisch (2007), and the Spitzer detections (Peterson et al. 2011), the SED is consistent with a late M (M5-M7) star or BD with a remarkably bright transition disk. Further data (e.g. confirmation of its spectral type) is required to determine the true nature of the source. In particular, although the agreement between the PACS detection and the near-IR position of the source is excellent and it is fully consistent with point-like emission like the rest of detected low-mass disks, contamination by nebular emission or potential background objects should be ruled out.
The SEDs of the four detected known members (G-85, CrA-466, CrA-159, and HBC 677), very complete thanks to the availability of optical and Spitzer data, reveal different types of protoplanetary disks. We will discuss their disk morphologies in more detail in Section 4.2.
 |
 |
 |
 |
 |
 |
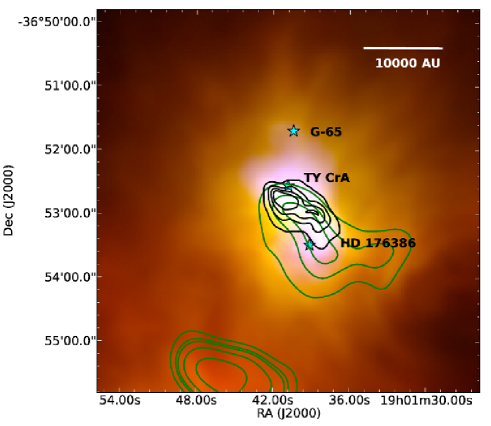
3.8 The northern subcluster: HD 176386, TY CrA, and G-65
The stars TY CrA (B8) and HD 176386 (B9) are multiple systems that lie to the North of the main star-forming region (Bibo et al. 1992). Both of them have been detected at optical and IR wavelengths, although the presence of substantial cloud material in the region has not unambiguously resolved the issue of whether they have circumstellar disks. MIPS/Spitzer data reveal extended cloud emission, and a cavity-like structure presumably created by TY CrA, and since they do not have an excess in the near-IR, they are most likely diskless (Sicilia-Aguilar et al. 2011a; Currie & Sicilia-Aguilar 2011). The PACS images reveal substantial emission in the region, but unlike the MIPS image (that showed emission centered around each one of the objects) and the 870 m LABOCA map (that revealed extended emission centered around HD 176386), the PACS data reveal an elongated structure located between the two optical stars (Figure 3). There is no detectable emission (at least, not over the extended background emission) at the positions of the two stars. The extended emission is composed of a brighter, larger blob closer to TY CrA and to the edge of the MIPS cavity, and a weaker extended tail that coils towards HD 176386. The full structure is about 10000 AU in size (for a distance of 138 pc), which could correspond to an embedded object or a heated clump located between the two intermediate-mass stars (see Figure 3). We cannot fully exclude the possibility that also an enhanced contribution from atomic lines (e.g., [CII] at 158 m) to the total emission within the continuum filters can play a role here. Some weaker emission is observed around the structure, in particular, towards the low-mass object G-65, although G-65 itself is not clearly detected due to the strong background gradient. The fact that the PACS source(s) appear undetected at MIPS 24 m (MIPS 70 m shows extended emission in the area without differentiated peaks) suggest the presence of cold and dense material compressed by the winds of the two nearby optical stars. Such a structure, if dense enough, could be the ideal environment for a new small episode of triggered star formation.
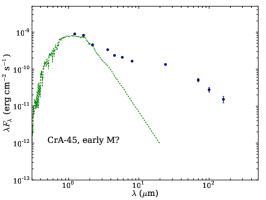
3.9 The southern subcluster: VV CrA, IRAS 18598, and CrA-45
To the south of the main star-forming region, we find three bright objects (IRAS 18598, VV CrA, and CrA-45; see Figure 1). IRAS 18598 has some evidence of extended emission at PACS wavelengths, which is consistent with the extended structure observed at 870 m (Sicilia-Aguilar et al. 2011a). Its SED is hard to interpret, since it probably includes a near-IR source dominating the Spitzer IRAC/MIPS emission, plus an extended structure that is responsible for most of the far-IR and submillimetre emission. Further observations are required to determine the nature of this object.
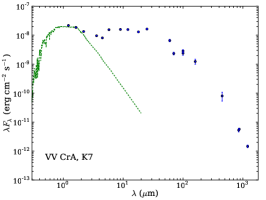
VV CrA is a known binary system with an IR companion (see the detailed modeling by Kruger et al. 2011). The optical object has been classified as K7 (SIMBAD; Bast et al. 2011). The PACS flux at 160 m shows extended emission, which could be associated with remnant cloud material or to the envelope of the IR companion. Small differences in the measured flux at 100 m depending on the aperture suggest that the IR emission could be extended. Simple SED fitting, assuming that the optical companion is a K7 star, suggests that the extinction to the optical source is rather AV=15 mag, instead of the 26 mag suggested by Kruger et al. (2012), but further modeling of the SED is hindered by the presence of the dominant IR companion.
To the South/East of VV CrA we find the source CrA-45 (according to the IDs in Peterson et al. 2011; also known as 2MASS J19031609-3714080), which had been previously identified as a YSO candidate (Gutermuth et al. 2009). The object has been detected at Spitzer wavelengths, and its SED is consistent with a low-extinction, early-M type CTTS.
3.10 Other sources in the cluster
The source SMM 6 from Nutter et al. (2005), which is one of the strongest peaks peak in our LABOCA map (Sicilia-Aguilar et al. 2011a), shows very little emission at 160 m and is darker than the surroundings at 100 m, suggesting that it is a cold starless condensation. We will discuss it in more detail in Section 4.1.
The source #19 from Chini et al.(2003) appears as a complex emitting structure in the Herschel images. It presents two relatively extended peaks (North and South in Table 2, which could simply be denser parts of the cloud), together with filamentary structures that seem to extend from the central peaks out.
Finally, the extended emission seen with MIPS to the North-West of CrA-4111 is detected at PACS wavelengths as cloud emission with at least one, but probably up to three point sources. At 100 m, only one of the sources is clearly resolved as an independent object (at 19:01:18.73, -37:02:60.7), while two more faint compact sources are resolved at 160 m (at 19:01:19, -37:03:22 and 19:01:19, -37:02:51). Only the first of these is detected (marginally) in IRAC at 4.5 m (which could indicate the presence of an outflow) and MIPS/24 m. The association with extended cloud material in all these cases and the presence of nearby sources makes them good candidates to be new embedded cluster members or very low-mass protostars, although the lack of further data does not allow us to rule out the possibility of extragalactic sources seen in projection against the cloud. The complete list of newly detected Herschel sources and their analysis will be presented in a follow-up publication by the Gould Belt Survey group.
3.11 Non-detected YSOs
 |
 |
 |
 |
 |
 |
 |
 |
| Object | ( m) | Upper Limit Flux (Jy) | Comments |
|---|---|---|---|
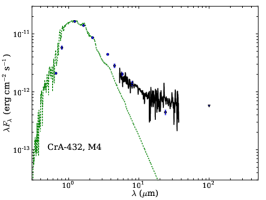
| CrA-432 | 100 | 0.019 | |
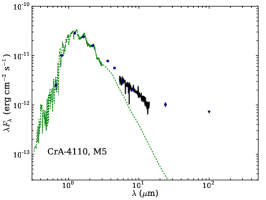
| CrA-4110 | 100 | 0.025 | |
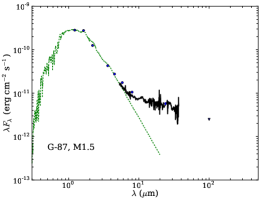
| G-87 | 100 | 0.082 | Transitional disk |
| G-45 | 100 | 0.018 | |
| CrA-465 | 100 | 0.027 | |
| G-32 | 100 | 0.027 | |
| G-14 | 100 | 0.020 | |
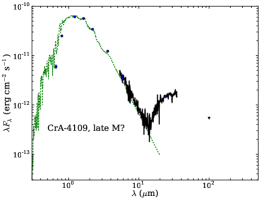
| CrA-4109 | 100 | 0.018 | Transitional disk |
| G-1 | 100 | 0.017 | Dust-depleted |
| CrA-4107 | 100 | 0.018 | |
| G-851 | 160 | 0.69 | Pre-transitional disk |
| CrA-159 | 160 | 0.24 | Truncated disk? |
Many of the disked TTS listed in the literature and some of the candidate protostars detected at X-ray (Forbrich & Preibisch 2007; Sicilia-Aguilar et al. 2008, 2011a; Currie & Sicilia-Aguilar 2011; Peterson et al. 2011) are not found in the PACS images. This is especially true among the faintest very-low-mass objects and the objects with small IR excesses. The presence of emission from substantial cloud material does not allow to place reasonable upper limits in many cases (G-32, G-36, G-43, G-65, G-94, G-95, G-112, CrA-205, CrA-4111). For objects located in clean areas, the PACS non-detections set important constraints on the properties of several sources (see Table 4).
Among the protostellar candidates detected at X-ray wavelengths, G-45 would be consistent with the object being a protostellar condensation, undetected in PACS due to the presence of surrounding cloud emission, although the scarcity of Spitzer data does not allow to fit any model and further observations are desirable. Some extended emission is seen near the X-ray objects G-74 and G-128, although not at the same position. The X-ray emission could be related to potential very low-mass objects objects (similar to G-122), or to background extragalactic sources.
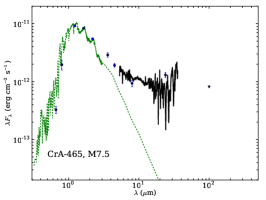
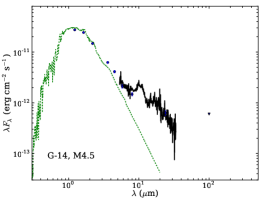
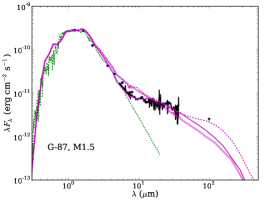
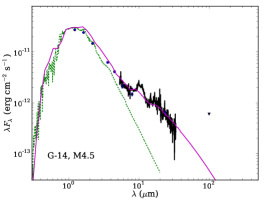
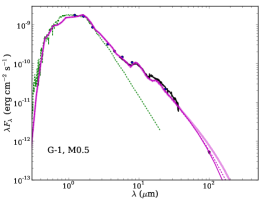
Among undetected TTS, stringent upper limits can be placed for G-1 (also known as HBC 680, M0.5), G-14 (M4.5), G-87 (M1.5), CrA-4107, CrA-4109 (both probably late M stars), CrA-4110 (M5), and the BD candidate CrA-465 (M7.5; Figure 8). Some diffuse emission is seen near HBC 679, but since this object did not show any excess emission at Spitzer wavelengths (Currie & Sicilia-Aguilar 2011), it is most likely of nebular origin. The upper limits of G-1 confirm a very low level of emission for this object in the far-IR, as it has been inferred from Spitzer data, being candidate for hosting a globally dust-depleted disk (Currie & Sicilia-Aguilar 2011). The upper limits also place strong constraints on the disk of G-87, another candidate for low dust mass or dust depleted disk. The case of CrA-465 is more uncertain, since the MIPS images already suggest the presence of some nebular contamination, and the LABOCA map confirmed the existence of background extended emission, so the PACS data probably contain substantial cloud contamination. The detailed properties of these disks will be discussed using simple disk models in Section 4.2.
4 Analysis and discussion
4.1 Protostars, envelopes, and disks
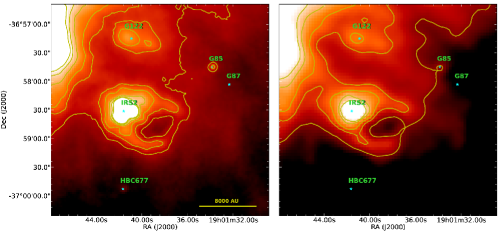
In order to gain some insight in the mass and temperature of the objects detected by Herschel/PACS, we have constructed an approximate temperature map by dividing the 100 m image by the 160 m one (Figure 9). This map provides important relative information on a pixel-by-pixel scale, being thus important to characterize the extended structures and the whole cloud, also in the regions where no Herschel emission is evident. Bright sources in the ratioed map correspond to objects with hotter temperatures, while cool regions that are stronger emitters at 160 m than at 100 m appear faint. With this exercise, we confirm the existence of a cold, well-defined structure in the position of the submillimetre source SMM 6 (see Figure 10), which is also coincident with an extended peak in the APEX/LABOCA 870 m map, being thus a relatively massive and cold core. Other structures detected at 870m but without evident PACS counterparts also appear as cold regions (see Figure 9), while the emission around HD 176386 and TY CrA appears hot, indicating heating by the nearby intermediate-mass stars or even the presence of some new embedded protostars. The differences between IRS 7w vs. IRS 7e and IRS 5a/b vs. FP-25 are also evident, with IRS 7w appearing hotter than IRS 7e, and IRS 5a/b being hotter than FP-25, although without further data it is hard to establish whether this difference is due to evolution, viewing angle, or source mass. The very low-mass Class I candidate G-122 appears also colder than typical, higher-mass Class I sources, and the Class 0 candidates SMM 1 A and SMM 1 As are also cold and probably extended.
By observing their SEDs (Figures 5-8), the objects can be classified as protostellar Class I candidates (with SEDs peaking in the mid-IR and silicate features in absorption, when an IRS spectrum is available) or Class II sources with disks (with SEDs peaking in the optical or near-IR and silicate features in emission). Objects detected only at far-IR/submillimeter wavelengths are Class 0 candidates. In principle, our Herschel data confirms the previous classification in the literature, with objects like IRS 7w, IRS 5, V 710, and SMM 2 being Class I candidates, while S CrA, T CrA, G-85, CrA-159 and similar sources are Class II objects. A few objects have uncertain nature (e.g. IRS 2), and in other cases, the far-IR detection is probably associated with nearby cloud material (e.g. HD 176386), remnant envelopes or a embedded nearby companion (e.g. IRAS 18598).
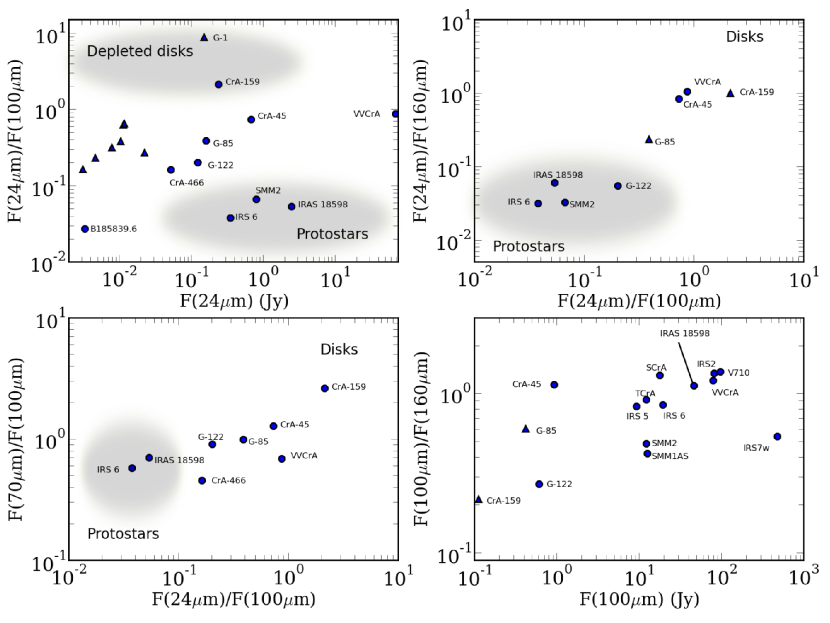
To obtain more precise results, we have explored different types of diagnostic diagrams involving the MIPS 24 and 70 m data and the PACS photometry for the detected objects and those with relevant upper limits (Figure 11), confirming this classification. The main parameter affecting the flux ratios is the object temperature. While disks appear relatively flat or with a moderate negative slope in the 24-70-100-160 m range, protostellar objects can show flat, rising, or decreasing slopes in this range, depending on their temperatures. The second important parameter is the object mass. Massive disks have much flatter slopes than depleted disks, which becomes clear in the relation between the 24 m and 100 m flux (see the loci of the typical disks like G-85, CrA-45, CrA-466 vs that of the mass-depleted or low-mass disks like CrA-159 and G-1). Dust-depleted disks would also have higher 24 m/160 m ratio, although none is detected at this wavelength. For protostellar objects, their masses, temperatures, and evolutionary state are to some extent degenerate, and difficult to uniquely determine without detailed modeling, although the general trend is that less massive and less evolved objects will tend to have lower fluxes and lower temperatures (Myers & Ladd 1993). The distinction between protostars and disks is thus maximal in the diagrams involving the shorter wavelengths (24 m). The 100 m/160 m vs 100 m diagram is harder to interpret in terms of evolutionary state, since emission at these wavelengths in both protostars and disks comes mostly from small cold grains, so objects are rather separated by their luminosity. The low-mass protostar candidate G-122 appears in an intermediate location due to its low flux and long wavelength SED peak (low temperature). Although there are less objects detected at 70 and 160 m (in particular, among the low-mass protostars and low dust-mass disks), these diagrams also reveal a similar trend.
| Object | Class | T (K) | Lbol (L⊙) | Comments | |
|---|---|---|---|---|---|
| G-122 | I/0: | — | — | 0.005: | No submillimetre data |
| IRS 2 | I | 25 | 1.5 | 0.8 | |
| IRS 5a/b | I | 45 | 0 | 0.2 | |
| FP-25 | I | 20 | 1.5 | 0.05: | Contamination by IRS 5a/b |
| IRS 6a/b | I | — | — | 0.04: | No submillimetre data |
| V 710 | I | 100 | 0/1 | 3.1 | |
| SMM 1 A | 0 | 16 | 2 | 0.5 | |
| IRS 7w | I | 25 | 2 | 0.9 | |
| SMM 1 As | 0 | 16 | 2 | 0.04 | |
| SMM 2 | I | 16 | 2 | 0.04 | |
| IRAS 18598 | I | 20/32 | 1/2 | 0.3 |
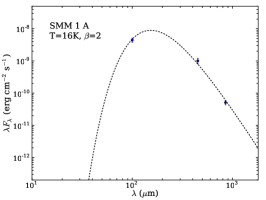
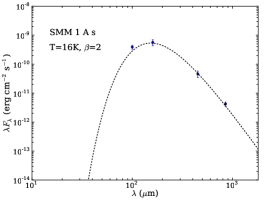
The PACS and submillimetre data for two of the sources associated with the main cluster (SMM 1 A and SMM 1 As; Groppi et al. 2007) strongly resemble the emission expected for Class 0 objects. SMM 1 A had been already classified as a potential Class 0 source (Nutter et al. 2005). Including the Herschel data, we have constructed simple modified black-body models for these objects, following Ward-Thompson et al. (2002). The emission of a modified black-body, or grey-body, can be written as
| (1) |
where is the flux density, (T) is the black-body emission for a temperature T, is the frequency-dependent optical depth, and is the solid angle subtended by the source. If we assume that at long wavelengths, the optical depth follows a power law with frequency, , it is possible to derive the temperature of the source. Taking the values from Ward-Thompson et al.(2002) for =2 and =0.06, we obtain very good fits to both objects for temperatures around 16 K (see Figure 5), consistent with pre-stellar cores. Nevertheless, further data, including higher resolution maps, are required to fully determine the nature of these objects, since external heating may also play a role, especially in the surroundings of other brigth protostars (Lindberg & Jørgensen 2012).
As a comparison, and although a modified black-body does not provide a good fit to any of the remaining protostars, we have repeated this exercise for the submillimetre part of the SEDs of the Class I objects with enough long-wavelength data (see Table 5). The fits are also displayed in Figure 5, together with the temperature and coefficient information. Except for SMM 2, which can be well reproduced at long wavelengths with a similar model to SMM 1 A and SMM 1 As, all the other objects require higher temperatures (in the range of 20-100 K) and different frequency power law exponents (=0-2). If we identify this longer wavelength part of the SED as the remaining envelope material of the source, this would suggest higher temperatures and different degrees of grain growth, as expected if these objects are more evolved than the Class 0 candidates.
4.2 Disks properties in the Coronet cluster
 |
 |
 |
 |
 |
 |
 |
 |
 |
 |
Although the Coronet cluster is a very young region (1-2 Myr; Sicilia-Aguilar et al. 2011a) and its compactness would suggest a small age spread between the cluster members around the cluster core, we observe all types of protoplanetary disks among the solar-type and low-mass stars (see Figures 6 and 7). In order to explore the disk structure of the objects, we have modeled their SEDs using the RADMC 2D code (Dullemond & Dominik 2004). The RADMC code is used to reproduce the SEDs of the different objects, using the observed stellar parameters to determine the luminosity (effective temperature, stellar radius, Teff, R∗) and varying the disk mass, radius, and vertical scale height. The disks are assumed to be flared with a single flaring law at all radii, Hp/RR1/7, and the vertical scale height at the disk outer radius, Hrdisk/Rdisk, is varied to fit the data. We assume an inner disk rim at the dust destruction radius (for silicate dust, located at the distance at which the temperature reaches 1500 K), and a typical grain population with sizes between 0.1 and 100 m following a collisional power law distribution with exponent -3.5. We take the outer disk radius to be 100 AU for the low-mass stars, and 300-400 AU for the intermediate-mass stars999S CrA and T CrA. In both cases we started with a 100 AU outer disk radius, but the submillimetre and millimetre observations of S CrA suggest a slightly larger radius and presence of larger dust grains.. The dust component of the disk is assumed to be composed of amorphous grains with similar amounts of Mg and Fe (Jäger et al. 1994; Dorschner et al. 1995101010See http://www.astro.uni-jena.de/Laboratory/OCDB/newsilicates.html). This simple dust model reproduces the strength of the silicate features very well, although we note that the main purpose of this exercise is to understand the global SED shape, and not the dust composition in the disk atmosphere. In addition, 25% of carbon has been included, with a similar size distribution as the silicate grains. In order to obtain the full disk mass, we consider a gas-to-dust ratio of 100. We assume that there is no dust temperature dependence on the grain size, and the dust grains are considered to be well mixed (i.e., without size-dependent differential settling). The stellar parameters (namely R∗ and Teff) were estimated by using the temperature-spectral type relation for Taurus stars (Kenyon & Hartmann 1995) and varying the radius to reproduce the total observed luminosity in the optical/near-IR.
These simple models do not account for the many effects expected in protoplanetary disks (e.g. differential settling and grain growth, inside-out evolution), but our aim is to understand the global SED shape and properties of the disks. Only in cases where no reasonable fit to the observed SED could be achieved with the simplified models, we included additional parameters, specifically by considering: inclusion of large grains/removal of small grains in the dust component, modification of the inner disk rim to include an inner hole at distances larger than the dust destruction radius, and variation of the flaring and dust properties between the inner and outer disk. This is the same procedure that we followed for the disks in Cep OB2 (Sicilia-Aguilar et al. 2011b). The properties of the best-fitting models are listed in Table 6. The models are displayed in Figure 12. We did not attempt to model objects that appear problematic due to the presence of companions (VV CrA; Kruger et al. 2011) or to nebular emission (HD 176386), since these simple disks models would not be adequate.
| Object | Teff (K) | R∗ (R⊙) | M∗ (M⊙) | Mdisk (M⊙) | amin-amax ( m) | Hrdisk/Rdisk | T(Rin) (K) | Rout (AU) | Comments |
|---|---|---|---|---|---|---|---|---|---|
| S CrA | 4500 | 3.60 | 1.5 | 3.810-2 | 0.1-10000 | 0.30 | 1500 | 400 | Massive, typical CTTS disk |
| T CrA | 7000 | 1.14 | 4.0 | 3.810-3 | 0.1-100 | 0.33 | 1500 | 300 | Typical CTTS disk |
| CrA-466 | 3500 | 1.06 | 0.4 | 2.810-4 | 0.1-100 | 0.1 | 1500 | 100 | Typical CTTS disk |
| CrA-45 | 3700 | 1.62 | 0.6 | 1.510-4 | 0.1-100 | 0.32 | 1500 | 100 | Typical CTTS disk |
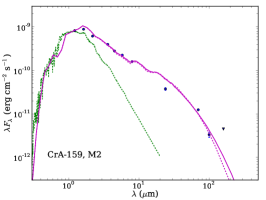
| CrA-159 | 3500 | 1.95 | 0.4 | 3.810-6 | 0.1-100 | 0.33 | 1500 | 40 | Thick, truncated or strongly depleted. Gap? (continuous line) |
| ” | 3500 | 1.95 | 0.4 | 5.410-6 | 0.1-20 | 0.33 | 1500 | 100 | Small grains only. Depleted. Gap? (dashed line) |
| HBC 677 | 3500 | 1.95 | 0.4 | 5.810-6 | 0.1-100 | 0.32 | 1500 | 100 | Low mass disk, relatively thick |
| G-1 | 3900 | 2.50 | 0.6 | 1.210-6 | 0.1-100 | 0.095 | 1500 | 100 | Very dust depleted and settled (dotted line) |
| ” | 3900 | 2.50 | 0.6 | 310-7 | 0.1-100 | 0.085 | 1500 | 30 | Settled, truncated (dashed line) |
| ” | 3900 | 2.50 | 0.6 | 610-7 | 0.1-20 | 0.095 | 1500 | 100 | Small grains only, depleted (continuous line) |
| G-14 | 3500 | 0.41 | 0.3 | 910-7 | 0.1-100 | 0.08 | 1500 | 100 | Grain size differences between inner/outer disk |
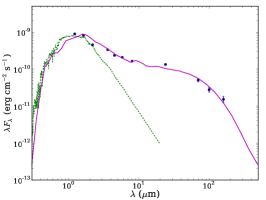
| G-85a | 3800 | 1.60 | 0.6 | 1.710-4 | 0.1-2/0.1-100a | 0.09/0.095a | 1500/200a | 100 | Opt. thin inner disk/gap (pre-transitional) a |
| G-87 | 3700 | 1.15 | 0.5 | 1.610-4 | 0.1-100 | 0.03 | 1500 | 100 | Standard disk model (dashed line) |
| ” | 3700 | 1.15 | 0.5 | 1.610-4 | 20-1000 | 0.02 | 1500 | 100 | Large grains (dotted line) |
| ” | 3700 | 1.15 | 0.5 | 1.610-4 | 20-1000 | 0.02 | 400 | 100 | Best fit: Inner hole plus large grains (continuous line) |
Several of the disks could be well fitted with models that reproduce the typical behavior of CTTS disks: relatively massive, flared disks with a vertical scale height similar to that expected from hydrostatic equilibrium, which suggests little dust settling. These are the cases of the most massive members (T CrA and S CrA) as well as CrA-45 and CrA-466 among the lower-mass stars, although the high excess at 2-8 m observed in S CrA and T CrA suggest the presence of a slightly puffed-up inner rim and the mid-IR emission of CrA-466 suggest some settling (or a departure from hydrostatic equilibrium) or inside-out evolution. The fit of CrA-45 is uncertain due to the lack of information on its spectral type and extinction, and the fact that the mismatches between the 2MASS, IRAC, and MIPS fluxes suggest some degree of IR variability. Even though all these four disks are relatively massive, only the disk around S CrA exceeded the minimum mass for the solar nebula (Weidenschilling 1977), assuming always a standard gas-to-dust ratio of 100. The model fits also proved that, although far-IR and submillimetre data are needed to determine correctly the disk mass, the 30 m IRS data already puts very strong constraints to the amount of dust. For the object with the most complete submillimetre data (S CrA), the SED shape suggests the presence of millimetre-sized grains. A good fit is attained using a dust distribution with sizes 0.1-10000 m and a collisional power law distribution with exponent -3.5.
The Herschel observations reveal the presence of some severely mass depleted disks, with disk masses below 10-5M∗ derived from the Herschel data and the best fit models, and considering a standard gas-to-dust ratio (100): CrA-159, HBC 677, and G-1.
The most remarkable case is CrA-159. While being a relatively flared and optically thick disk with a large vertical scale height and strong near-IR excess, the very low PACS flux can only be reproduced assuming a very low dust mass. A good fit is achieved assuming that the disk is truncated to about 40-50 AU. A modification of the grain distribution (for instance, reducing the amount of 20 m grains; see dashed line for CrA-159 in Figure 12) can explain the low PACS fluxes but still results in too high 24 m fluxes. The fact that the 24 m flux is lower than expected even for a truncated/low mass model could be a sign of the presence of a gap, albeit at a larger radius than in typical pre-transitional disks (Espaillat et al. 2010). A large gap could help to reduce the mid-IR flux without changing the grain size distribution and also explain the low mass of the disk, but further observations are needed to test this hypothesis.
HBC 677 is very similar to CrA-159, although the lack of MIPS data results in a large unexplored region in its SED and thus a large unconstrained area in the disk parameter space. The larger vertical scale height and mass of this disk (compared to CrA-159) make it consistent with a CTTS disk, albeit with very low dust mass, compared to typical Taurus disks around similar stars (Andrews & Williams 2005).
The disk around G-1 was not detected by Herschel/PACS, but the object is located in a region free from extended emission, which allows us to place a very stringent upper limit to its 100m flux. This sets a strong constraint to the disk mass, which would be as low as 110-6 M⊙. A simple model tends to overpredict the Herschel fluxes (dotted line for G-1 in Figure 12). Disk truncation could be also invoked, as in CrA-159, to reduce the flux (dashed line), which could be a possibility since Köhler et al. (2008) suggested that this object could be a binary (0.22” projected separation). In addition, a small-dust-only distribution in a very low-mass disk provides a good fit (continuous line for G-1 in Figure 12). The low near-IR excess points to a small vertical scale height, although given the very low-mass of the disk, the object does not need to be dramatically settled and could be close to hydrostatic equilibrium. The Herschel data thus confirms G-1 to be a good example of a globally dust depleted disk, as it had been previously suggested by the IR observations alone (Currie & Sicilia-Aguilar 2011). The IR observations of G-14 are also consistent with a globally dust depleted disk, although due to the lower luminosity of the object, the Herschel upper limits do not allow to constrain the full dust content and vertical scale height.
The disk around G-85 is consistent with a pre-transitional disk with an inner gap (similar to those in Espaillat et al. 2010). The strong silicate feature and low near-IR excess requires the presence of small silicate grains in an optically thin environment, and the large flux at 100 m reveals a relatively large total disk mass. While previous disk models had classified this object as having a typical CTTS disk (based on broad-band photometry), it is not possible to reproduce both the strong silicate emission and the large mid- and far-IR flux assuming a uniform disk with a single dust composition and a single density power law. The best results for a simple model are achieved if the disk is separated in an inner and an outer part at a distance of about 2 AU, with the inner part being flared and optically thin and the outer part being relatively massive and optically thick. The large silicate feature requires the inner disk to be populated by mostly small grains (here we assume a flat distribution of grains with sizes 0.1-2 m), while the outer disk is consistent with a standard dust grain distribution. Such filtered grain distributions have been predicted theoretically in cases of disks with inner gaps and planets (Rice et al. 2006). The presence of an optically thick inner disk, followed by a relatively clean gap with small grains and an optically thick outer disk cannot be excluded either with the present data.
Although undetected, the Herschel upper limit flux for G-87 puts strong constraints to its disk structure. Fitting of the G-87 disk, that has been successively regarded as a transition (Sicilia-Aguilar et al. 2008), primordial (Ercolano et al. 2009), and transition/homologously depleted (Currie & Sicilia-Aguilar 2011) disk, reveals that it is consistent with a low mass disk (M3.210-4M∗) with an inner hole. Assuming a standard dust distribution (0.1-100 m, exponent -3.5) and varying the vertical scale height results in too large fluxes at 5 m for any values that reproduce the emission at 20-30 m (see G-87 in Figure 12, dashed line), which would have resulted at least in a marginal detection at 100m. The object has a small silicate feature and a large crystallinity fraction (Sicilia-Aguilar et al. 2008), which is typical of disks with strong grain growth where most of the amorphous grains are in aggregates a few microns in size. If we then change the dust distribution to reduce the amount of small dust (10-1000 or 20-1000 m, exponent -3.5), the near-IR flux is reduced for thin enough disks, but the emission in the 5-15 m region is still too large (see G-87 in Figure 12, dotted line). The best fit is achieved including an inner hole of about 0.3-1 AU in size, together with a grain population mostly consistent with large grains (10-1000 or 20-1000 m, exponent -3.5; see G-87 in Figure 12, continuous line). A small fraction of submicron and partly crystalline grains present in the inner hole could account for the observed silicate feature. The models thus point towards the transitional nature of this object.
4.3 The disk-protostar connection?
To summarize the previous sections, despite the youth of the cluster, the Coronet region shows already a rich and diverse disk population, where the signs of disk evolution (small dust depletion, inside-out evolution) are common. The masses of the disks are in general lower than what is typically observed in clusters with similar ages. Figure 13 shows a comparison of the disk masses of the objects detected (or strongly constrained) wiht Herschel versus the stellar mass observed in Taurus (from Andrews & Williams 2005) with our results for the CrA region. Despite the small number of objects in the CrA region (10), we find that the disks around the M-type stars are significantly less massive than their Taurus counterparts. In particular, although there are a few Taurus disks with masses as low as those measured here, most of the Taurus disks are clearly more massive than the typical Coronet disks. Given the small size of the region in comparison with the typical sizes of star-forming Herschel filaments (Arzoumanian et al. 2011), it does not seem likely that the Coronet/CrA region is significantly older than Taurus. Although not all the disks are detected with Herschel, the tendency would be towards detection of the most massive objects (at least, within a given spectral type range), which makes this difference even more striking. On the other hand, the more massive stars S CrA and T CrA have larger masses than the typical 1-2 M⊙ star in Taurus. It is also remarkable that the objects with the largest disk masses or stronger PACS excesses among the solar-type and low-mass stars (S CrA, VV CrA, CrA-45) are not associated with the main cluster core, but rather on the outskirts of the dense cloud.
There are some differences in the way the Taurus disk masses are determined in Andrews & Williams (2005) and the masses derived for the CrA members by fitting their disks with RADMC. The main differences result from the dust opacity and the dust distributions considered. While the dust opacity in the millimetre is in both cases basically the same, changes in the millimetre slope used by Andrews & Williams (2005) for deriving their dust masses can introduce a factor of few difference between the derived masses. We have thus explored the resulting disk mass for the stars T CrA and CrA-466 by using different dust distributions with maximum grain sizes between 100 and 10000 m, finding variations up to a factor of 4 in the derived mass. This would result in a difference of 0.6 dex in Figure 13, which would still place the CrA disks around low-mass stars among the less massive ones, compared to similar Taurus stars. A different mass analysis (Currie & Sicilia-Aguilar 2011), including only optical, 2MASS, and Spitzer observations, also confirms this trend towards lower masses compared to Taurus among the CrA members. The presence of substantial dust mass locked in larger grains cannot be excluded without further observations at longer wavelengths, although in this case the reason why grain growth would have proceeded more efficiently in the Coronet disks than in Taurus objects is not clear.
One potential explanation of this anomalous behavior of the disk properties could lay in the line of the arguments by Fang et al.(2012), who found a clear difference in the disk fraction vs. time in sparse cluster compared to more populous regions. While a exponential trend with a disk lifetime around 2-3 Myr is a very good approach for the disk fractions observed in more massive clusters (several hundreds of members) and OB associations (see also Fedele et al. 2010), a similar diagram for the sparse clusters (including the Coronet cluster) is harder to interpret. Very young regions have relatively moderate disk fractions that to a large extent survive over longer periods of time. Some authors have suggested that such behavior could respond to the lifetimes of disks around binary stars being much shorter than the lifetimes of disks around single stars (Bouwman et al. 2006). In the case of the Coronet cluster, we do not have information about the multiplicity of most the very low-mass stars, although most of the protostars are in multiple systems and a high degree of multiplicity has been suggested for many of the known TTS members (Köhler et al. 2008).
On the other hand, the Herschel data reveals that, although the region is usually assumed to be relatively quiet due to the lack of very massive stars, the cluster center corresponds to a very crowded area, where the region around IRS 7 hosts about 20 objects (counting in multiple systems, protostars, and the intermediate-mass stars R CrA and T CrA) within a region a bit less than 0.1pc in diameter. Moreover, the Herschel data suggest strong interaction at least in some of the systems (IRS 5 complex), which are very likely to affect the formation of their disks. Further observations of the region should be used to trace the early interactions of the systems and to quantify to which extent this may have contributed to shape the disks of the low-mass cluster members.
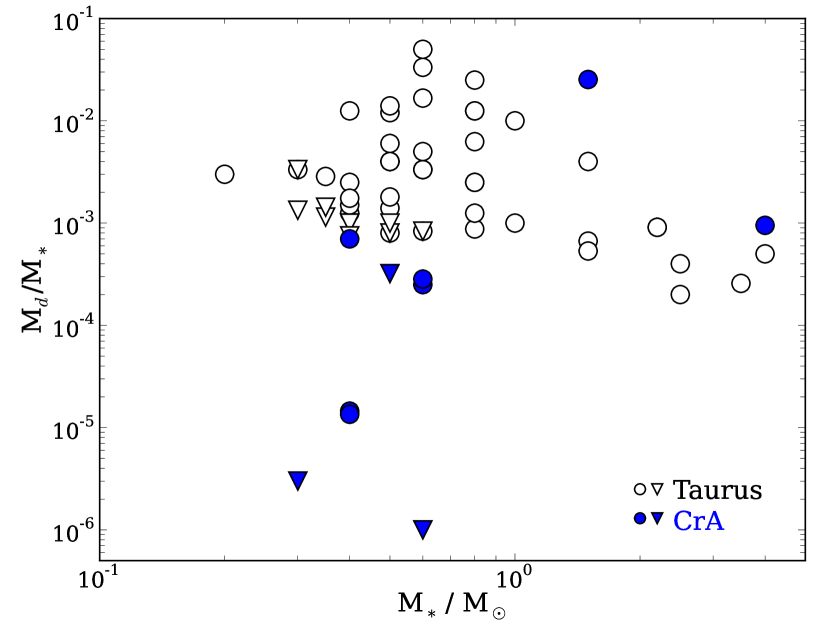
5 Summary and conclusions
We have presented Herschel/PACS observations at 100 and 160 m of the CrA region. The observations have covered the main parts of the Coronet cluster and detected many nearby YSOs, most of which are related to the central, denser part of the cluster with the strongest millimetre/submillimetre emission. Substantial cloud emission around the whole region is also revealed by the observations, including some details of spatially resolved sources. Most of the Herschel compact sources can be traced back to known submillimetre/millimetre condensations (consistent with protostellar objects or dense cloud parts) and to mid-IR sources identified as young T Tauri stars with disks.
-
1.
Although Herschel reveals several extended structures following the path of the extinction maps, most of the star formation in the region, detectable as compact sources, is taking place in the central part of the cluster, which shows the higher densities and extinction (Kainulainen et al. 2009). Given that we are sensitive to disks around very low-mass stars and very low-mass protostars, we can safely exclude active star formation in most of the cloud, which suggest a poor efficiency or cloud densities below the threshold for star formation.
-
2.
We are able to trace fine details of the structure of two Class I protostars, IRS 2 and the IRS 5 complex. The first one appears associated with a bubble-like structure, suggesting the expansion of a wide-angle wind in the molecular cloud material. The components of the IRS 5 multiple protostar, IRS 5a/b and the X-ray source FP-25, appear surrounded by a filamentary extended structure that resembles the spiral arms usually associated to multiple systems by theoretical simulations of binary formation (Bate 2000). The size of the observed filaments is about 7 times larger than the typical sizes predicted by the models, although the models are highly dependent on the initial angular momentum properties and on the mass of the protostars. Another possible explanation could be a similar swept-up, heated structure similar to what we find near IRS 2. Although IRS 5a/b appears brighter in the near- and mid-IR and also at 100 m, FP-25 is brighter at 160 m, suggesting that it is in a more embedded, colder phase.
-
3.
The components of the binary protostar IRS 7w/e are also resolved, although both appear partially blended. IRS 7e, the faintest at wavelengths shorter than 100 m, dominates at 160 m. The region between IRS 7w and IRS 7e is well resolved at 100 m, showing a decrease in emission. The Class 0 candidate source SMM 1 A is located to the South of both. Interestingly, the dip in far-IR emission between the three sources is coincident with the X-ray source FP-34 (Forbrich & Preibisch 2007), which could be thus associated with a third embedded object or maybe to a jet/shock from any of the two protostars (there is further evidence of X-ray emission from optical jets in the region, see object G-80 in Sicilia-Aguilar et al. 2008).
-
4.
The region presents objects in very early evolutionary stages. We confirm the sources SMM 1 A and SMM 1 As as Class 0 candidates with similar grey-body temperature (16 K). On the other hand, the strong submillimetre emission to the North of the IRS 7 complex, named SMM 6 in Nutter et al. (2005) and also detected in our LABOCA maps (Sicilia-Aguilar et al. 2011a) appears as a dark lane in the 100m images and brigther at 160 m, being consistent with a starless core or maybe a pre-stellar condensation.
-
5.
The Herschel/PACS data also reveals several very low-mass protostellar objects. The submillimetre source SMM 2 (Nutter et al. 2005) is probably a M-type Class I object. The mid-IR and X-ray source G-122 (Sicilia-Aguilar et al. 2008) is consistent with an even fainter very low-mass protostar. We also find a second condensation to the East of G-122, which is near the Herschel/PACS detection limit, but resembles to G-122 in color and size.
-
6.
The structure between the stars HD 176386 and TY CrA also reveal interesting characteristics. While the two objects display a double cavity in near- and mid-IR, the Herschel/PACS emission reveals several peaks in the area in between the stars, which suggest that it could be related to heated, dense, compressed material (maybe a first step in triggered star formation). It is noticeable that the Herschel peak in this area does not coincide with the peak of 870 m LABOCA emission, which is mostly centered (but extended) around HD 176386 and should mark the location of the densest cloud material. The whole region shows also strong radial striations, which could be a sign of large-scale collapse motions.
-
7.
We have also detected dust emission from the disks around several of the cluster members. In order to interpret the SEDs, we have constructed radiative transfer models for the disks using the RADMC code (Dullemond & Dominik 2004). While the disk emission around the solar-type and intermediate-mass stars is consistent with flared, massive disks (S CrA, T CrA), the disks around the lower-mass stars (spectral types M0 or later) have remarkably low masses (Md/M∗10-3M⊙/yr). In some cases, the shape of the SED suggest either disk truncation (as in the case of CrA-159) or strong dust depletion (as in the case of HBC 677 and G-1). Some degree of inside-out evolution, like the presence of inner holes or gaps, is also required to explain the full SEDs of some of the disks. In particular, G-85, which has low near-IR flux, strong silicate feature, and relatively high far-IR flux , is best fitted assuming the presence of a gap at few AU, being thus consistent with a pre-transitional disk. G-87 is best fitted by assuming a disk with strong grain growth and an inner hole, as we had previously inferred from its IRAC/IRS data (Sicilia-Aguilar et al. 2008).
-
8.
While the masses of the disks around solar- and intermediate-mass stars appear similar or higher than their Taurus counterparts, all M-type stars have disk masses that are systematically lower than the disk masses of other stars with similar ages (e.g. Taurus; Andrews & Williams 2005). This confirms our previous results inferred from the Spitzer observations (Sicilia-Aguilar et al. 2008; Currie & Sicilia-Aguilar 2011) that were initially interpreted as signs of evolution. The reduced mass of the disks could be either related to very marked early evolution, or be a result of the initial conditions in the star-forming cloud affecting the structure of the disks. Given the youth of the cluster, and that the present star-formation seems to be rich in multiple systems and shows signs of interactions between the stars and the parental cloud, the effect of initial conditions may have played an important role in shaping the disks. Observations in other clusters, revealing differences in the disk fraction vs. time in sparse regions compared to more massive clusters may also point in this direction (Fang et al. 2012).
Acknowledgments: This work is based on Herschel/PACS data. PACS has been developed by a consortium of institutes led by MPE (Germany) and including UVIE (Austria); KU Leuven, CSL, IMEC (Belgium); CEA, LAM (France); MPIA (Germany); INAF-IFSI/OAA/OAP/OAT, LENS, SISSA (Italy); IAC (Spain). This development has been supported by the funding agencies BMVIT (Austria), ESA-PRODEX (Belgium), CEA/CNES (France), DLR (Germany), ASI/INAF (Italy), and CICYT/MCYT (Spain). This work has made use of the SIMBAD database. It also makes use of data products from the Two Micron All Sky Survey, which is a joint project of the University of Massachusetts and the Infrared Processing and Analysis Center/California Institute of Technology, funded by the National Aeronautics and Space Administration and the National Science Foundation. We thank C. P. Dullemond for his help providing the RADMC 2D code, and the anonymous referee for providing useful comments that helped to clarify this paper. A.S.A acknowledges support by the Spanish “Ramón y Cajal” program from the Spanish MICINN, grant number RYC2010-06164.
Facilities: Spitzer, Herschel.
References
- Acke & van den Ancker (2004) Acke, B., & van den Ancker, M. E. 2004, A&A, 426, 151
- André et al. (2010) André, P., Men’shchikov, A., Bontemps, S., et al. 2010, A&A, 518, L102
- Andrews & Williams (2005) Andrews, S.,& Williams, J., 2005, ApJ, 631, 1134
- Arzoumanian et al. (2011) Arzoumanian, D., André, P., Didelon, P., et al. 2011, A&A, 529, L6
- Bate (2000) Bate, M. R. 2000, MNRAS, 314, 33
- Bast et al. (2011) Bast, J. E., Brown, J. M., Herczeg, G. J., van Dishoeck, E. F., & Pontoppidan, K. M. 2011, A&A, 527, A119
- Beckwith et al. (2000) Beckwith, S. V. W., Henning, T., & Nakagawa, Y. 2000, Protostars and Planets IV, 533
- Bibo et al. (1992) Bibo, E. A., The, P. S., & Dawanas, D. N. 1992, A&A, 260, 293
- Chen et al. (1997) Chen, H.; Grenfell, T. G.; Myers, P. C.; Hughes, J. D., 1997, ApJ, 478, 295
- Chini et al. (2003) Chini, R. et al. 2003, A&A, 409, 235
- Currie & Sicilia-Aguilar (2011) Currie, T., Sicilia-Aguilar, A., 2011, ApJ 732, 24
- De Muizon et al. (1980) De Muizon, M., Rouan, D., Lena, P., Nicollier, C., Wijnbergen, J., 1980, AA, 83, 140
- Dorschner et al. (1995) Dorschner, J, Begemann, B., Henning, T., Jäger, C., & Mutschke, H., 1995, A&A, 300, 503
- Dullemond & Dominik (2004) Dullemond, C., & Dominik, C., 2004, A&A, 417, 159
- Eiroa et al. (1997) Eiroa, C., Palacios, J., Casali, M., 1997, ASPC 119, 107
- Espaillat et al. (2010) Espaillat, C., et al. 2010, ApJ, 717, 441
- Fang et al. (2012) Fang, M., van Boekel, R., Bouwman, J., et al. 2012, A&A in press, arXiv:1209.5832
- Favata et al. (2002) Favata, F.; Fridlund, C. V. M.; Micela, G.; Sciortino, S.; Kaas, A. A., 2002, ASPC 277, 467
- Forbrich et al. (2006) Forbrich, J., Preibisch, T., & Menten, K. M. 2006, A&A, 446, 155
- Forbrich & Preibisch (2007) Forbrich, J.; Preibisch, T., 2007, A&A 475, 959
- Garmire & Garmire (2003) Garmire, G., & Garmire, A., 2003, Astron. Nachr. 324, 153
- Garmire et al. (2003) Garmire, G. P., Bautz, M. W., Ford, P. G., Nousek, J. A., & Ricker, G. R., 2003 Proc. SPIE 4851,28.
- Groppi et al. (2004) Groppi et al., 2004, ApJ, 612, 946;
- Groppi et al. (2007) Groppi, C. E., Hunter, T. R., Blundell, R., & Sandell, G. 2007, ApJ, 670, 489
- Gustafsson et al. (2008) Gustafsson, B., et al. 2008, A&A 486, 951
- Gutermuth et al. (2009) Gutermuth, R. A., Megeath, S. T., Myers, P. C., et al. 2009, ApJS, 184, 18
- Hamaguchi et al. (2005) Hamaguchi, K., et al. 2005, ApJ 618, 360
- Harju et al. (1993) Harju, J., Haikala, L.K., Mattila, K., Mauersberger, R., Booth, R.S., Nordth, H.L., 1993, A&A278, 569
- Hennemann et al. (2012) Hennemann, M., Motte, F., Schneider, N., et al. 2012, A&A, 543, L3
- Henning et al. (1994) Henning, Th.; Launhardt, R.; Steinacker, J.; Thamm, E., 1994, A&A, 338, 223
- Jäger et al. (1994) Jäger, C., Mutschke, H., Begeman, B., Dorschner, J., Henning, Th., 1994, AA, 292, 641
- Kainulainen et al. (2009) Kainulainen, J., Beuther, H., Henning, T., & Plume, R. 2009, A&A, 508, L35
- Kataza et al. (2010) Kataza, H., Alfageme, C., Cassatella, A., Cox, N., Fujiwara, H., Ishihara, D., Oyabu, S., Salama, A., Takita, S., and Yamamura, I., 2010, AKARI-IRC Point Source Catalogue Release note Version 1.0
- Kley & Burkert (2000) Kley, W., & Burkert, A. 2000, Disks, Planetesimals, and Planets, 219, 189
- Köhler et al. (2008) Köhler, R., Neuhäuser, R., Krämer, S., et al. 2008, A&A, 488, 997
- Kruger et al. (2011) Kruger, A. J., Richter, M. J., Carr, J. S., et al. 2011, ApJ, 729, 145
- Lindberg & Jørgensen (2012) Lindberg, J. E., & Jørgensen, J. K. 2012, arXiv:1209.4817
- López-Martí et al. (2005) López-Martí, B., Eislöffel, J., Mundt, R., 2005, AA, 444, 175
- López Martí et al. (2010) López Martí, B., et al. 2010, A&A, 515, A31
- Loren (1979) Loren, R. B., 1979, ApJ, 227, 832
- Marraco & Rydgren (1981) Marraco & Rydgren 1981, AJ, 86, 62
- Meyer & Wilking (2009) Meyer, M. R., & Wilking, B. A. 2009, PASP, 121, 350
- Myers & Ladd (1993) Myers, P. C., & Ladd, E. F. 1993, ApJ, 413, L47
- Neuhäuser et al. (2000) Neuhäuser, R., et al., 2000, A&A, 146, 323
- Nisini et al. (2005) Nisini, B.; Antoniucci, S.; Giannini, T.; Lorenzetti, D., 2005, A&A, 429, 543
- Nutter et al. (2005) Nutter, D. J., Ward-Thompson, D., & André, P. 2005, MNRAS, 357, 975
- Ott (2010) Ott, S. 2010, Astronomical Data Analysis Software and Systems XIX, 434, 139
- Peterson et al. (2011) Peterson, D.E., et al. 2011, ApJSS 194, 43
- Pilbratt et al. (2010) Pilbratt, G. L., Riedinger, J. R., Passvogel, T., et al. 2010, A&A, 518, L1
- Poglitsch et al. (2010) Poglitsch, A., Waelkens, C., Geis, N., et al. 2010, A&A, 518, L2
- Ratzka et al. (2008) Ratzka, T., Leinert, C., Przygodda, F., & Wolf, S. 2008, The Power of Optical/IR Interferometry: Recent Scientific Results and 2nd Generation, 519
- Rice et al. (2006) Rice, W., Armitage, P., Wood, K., Lodato, G., 2006, MNRAS 373, 1619
- Roussel (2012) Roussel, H., 2012, arXiv:1205.2576
- Sicilia-Aguilar et al. (2008) Sicilia-Aguilar, A.; Henning, Th.; Juhász, A.; Bouwman, J.; Garmire, G.; Garmire, A., 2008, ApJ, 687, 1145
- Sicilia-Aguilar et al. (2010) Sicilia-Aguilar, A., Henning, Th., Hartmann, L., 2010, ApJ, 710, 597
- Sicilia-Aguilar et al. (2011a) Sicilia-Aguilar, A., Henning, T., Kainulainen, J., & Roccatagliata, V. 2011a, ApJ, 736, 137
- Sicilia-Aguilar et al. (2011b) Sicilia-Aguilar, A., Henning, T., Dullemond, C. P., et al. 2011b, ApJ, 742, 39
- Stutz et al. (2009) Stutz, A. M., Rieke, G. H., Bieging, J. H., et al. 2009, ApJ, 707, 137
- Taylor & Storey (1984) Taylor & Storey, 1984, MNRAS, 209, 5
- Tobin et al. (2011) Tobin, J. J., Hartmann, L., Chiang, H.-F., et al. 2011, ApJ, 740, 45
- Torres et al. (2006) Torres, C. A. O., Quast, G. R., da Silva, L., et al. 2006, A&A, 460, 695
- Walter (1986) Walter, F., 1986, ApJ, 306, 573
- Walter et al. (1997) Walter, F., et al., 1997, AJ, 114, 1544.
- Wang et al. (2004) Wang, H., Mundt, R., Henning, Th., Apai, D., 2004, ApJ 617, 1191
- Weidenschilling (1977) Weidenschilling, S. J. 1977, Ap&SS, 51, 153
- Wilking et al. (1985) Wilking et al., 1985, ApJ, 293, 165
- Williams et al. (1994) Williams, J. P., de Geus, E. J., & Blitz, L. 1994, ApJ, 428, 693