Real Space Approach to CMB deboosting
Abstract
The effect of our Galaxy’s motion through the Cosmic Microwave Background rest frame, which aberrates and Doppler shifts incoming photons measured by current CMB experiments, has been shown to produce mode-mixing in the multipole space temperature coefficients. However, multipole space determinations are subject to many difficulties, and a real-space analysis can provide a straightforward alternative. In this work we describe a numerical method for removing Lorentz-boost effects from real-space temperature maps. We show that to deboost a map so that one can accurately extract the temperature power spectrum requires calculating the boost kernel at a finer pixelization than one might naively expect. In idealized cases that allow for easy comparison to analytic results, we have confirmed that there is indeed mode mixing among the spherical harmonic coefficients of the temperature. We find that using a boost kernel calculated at Nside=8192 leads to a 1% bias in the binned boosted power spectrum at , while individual s exhibit 5% fluctuations around the binned average. However, this bias is dominated by pixelization effects and not the aberration and Doppler shift of CMB photons that causes the fluctuations. Performing analysis on maps with galactic cuts does not induce any additional error in the boosted, binned power spectra over the full sky analysis. For multipoles that are free of resolution effects, there is no detectable deviation between the binned boosted and unboosted spectra. This result arises because the power spectrum is a slowly varying function of and does not show that, in general, Lorentz boosts can be neglected for other cosmological quantities such as polarization maps or higher-point functions.
I Introduction
Forthcoming results from the Planck satellite will set new limits on the primordial CMB temperature field at small angular scales. It will also strengthen our knowledge about fluctuations at very large scales. In this regime, the temperature dipole is overwhelmingly the dominant contribution – a fact usually attributed to the peculiar motion of the solar system, the Galaxy and the Local Group through the universe. As pointed out in Kamionkowski:2002nd , the very high amplitude of this dipole ( times larger than the primordial fluctuations of all higher multipoles) induces a peculiar quadrupole at a level detected by the WMAP satellite and accessible to the Planck satellite. When extracted from its primordial counterpart, this information can be used to further constrain the physics of our motion with respect to the CMB. We might also ask what are the contributions of this peculiar motion to the higher order multipole moments of the temperature power spectrum? This issue was first addressed in Challinor:2002zh , where it was shown that if the s vary smoothly among neighboring modes in comparison to the aberration kernel that boosts the CMB sky, then the main effect is a small and unobservable modulation of the temperature power spectrum. Furthermore, it was also noted in Challinor:2002zh that the multipolar convolution of the s with the aberration kernel has an expansion which is in powers of , where is the Lorentz boost parameter. From this it follows that the expansion in harmonic space is not guaranteed to converge rapidly for , a region which most conspicuously concerns future measurements by Planck. Nevertheless, essentially all approaches devoted to deboost CMB maps were based on standard harmonic-space decompositions Challinor:2002zh ; Kosowsky:2010jm ; Chluba:2011zh ; Amendola:2010ty .
More recently, it has been proposed Notari:2011sb that one can deboost the CMB at the level of time ordered data. A follow-up paper showed that the power spectra derived from simulated aberrated maps affected cosmological parameter estimation Catena:2012hq . For their analysis they modified HEALPix code to produce a simulated, aberrated map from an input set of s. This analysis did not include a way to translate between aberrated maps and non-aberrated maps. Since CMB surveys directly measure time-ordered data which is converted to a temperature map, we will need a method for deboosting this temperature information for future analysis. In this work, we discuss our map deboosting method as well as resolution limitations and give an estimate for appropriate map resolutions for high- CMB analysis.
In this paper we assess the effect of a Lorentz boost on the temperature power spectrum through a full real-space analysis performed on temperature maps. There are two relativistic effects to consider: a Doppler-shift of CMB photons and an aberration. The Doppler shift of a map is determined the magnitude of the monopole and by the boost parameter. To lowest order in , the contribution is a dipolar function multiplying the whole CMB map. At small angular scales the corrections are dominated by the aberration effect, which translates, in real space, into a non-trivial distortion and overlap of CMB pixels. These effects in turn depend on both the resolution and the pixelization scheme used to cover the sphere. Given that Lorentz boosts do not preserve pixel shape, pixels with equal areas but different shapes are distorted differently. Moreover, the overlap of boosted pixels with unboosted ones depends heavily on the tessellation of the sphere. Using the spherical projection pixelization scheme described in Gorski:2004by , which maintains straight line boundaries between equatorial and polar cap pixels and is easily related to the traditional HEALPix equal area pixelization 111http://healpix.jpl.nasa.gov, we construct a real-space matrix that fully accounts for the pixel distortions and overlaps among pixels. Our approach not only circumvents complications associated with an expansion in altogether, but also benefits from the already developed real-space tools used in standard CMB analysis.
We organize the paper as follows: in Section II we review the basics of boosting the CMB in harmonic space and stress its limitations. In Section III we present our general real-space approach and discuss its consequences when applied to the HEALPix pixelization scheme. We apply our method to simulated full sky maps and compare the resulting power spectrum in Section III, we will describe the effect of map resolution on deboosting and present limitations in V, and we present concluding remarks in section VII.
II Lorentz boost effects on CMB photons
Relativistic effects have been outlined in mckinley1980relativistic , here we summarize relevant points and and describe our notation.
If an observer in the rest frame of the CMB (denoted ) measures a photon of frequency arriving along a line of sight , then an observer in another frame, , that is moving with respect to the CMB at velocity will measure the incoming photon to be arriving along a different line-of-sight, , with a different frequency, . (Note that we will not concern ourselves here with any ambiguities in determining associated with the existence of inhomogeneities, in particular a cosmological dipole, on the assumption that that dipole is and smaller than the effects we will uncover.) The motion of the observer in thus induces two effects: a Doppler shift in the photon frequency and an aberration – a shift in the direction from which the photon arrives. These two effects can be seen explicitly in the relation between and
| (1) |
where and . The change in observed frequency in is given by a simple Lorentz transformation
| (2) |
where is the standard Lorentz factor. This angle is related to the angle , measured in the frame , via
| (3) |
For small one can clearly expand in a convergent series in around . It would appear obvious that one can therefore do the same for the spherical harmonic function . However, this is not the case, the correct expansion parameter for is . This expansion will therefore break down (or at least converge poorly) when . (This becomes obvious when one recalls that has zeros between and , thus changing by moves one zero past the next for . ) This issue was originally noticed in Challinor:2002zh where it was indeed recognized that this convergence breakdown leads to severe difficulties in evaluating the transformation of a spherical harmonic expansion of the sky at . Nonetheless, they claimed that if the s are smooth functions of compared to the transformation kernel, then this poor convergence is a red herring, and to second order in :
| (4) |
We want to stress here that these assumptions are idealized, but far from ideal. In practice we do not measure the theoretical power spectrum, only its estimator . Real data is contaminated from many different sources which destroys the assumption of smoothness. This suggests a real-space approach is more appropriate since the aberration can be accounted for in terms of pixel distortions without the need to resort to a expansion. We show in the next section how this can be implemented.
III The Real Space Approach to Boost Corrections
We wish to transform the boosted, pixelized temperature map into an unboosted map that can be analyzed with techniques already available for CMB analysis. To do this we need to compute a boost matrix that characterizes how the unboosted pixels transform into boosted ones.
The pixelized representation of the temperature fluctuation can be defined by:
| (5) |
where the integral is over the pixel which has area . According to this definition, the value at pixel of the boosted fluctuation will be:
| (6) | |||||
| (7) |
where we have made use of the following transformations mckinley1980relativistic :
| (8) | |||||
| (9) | |||||
| (10) |
Note that when going from (6) to (7), the boundary of integration has not changed. In fact, the integral over should be replaced by a sum of integrals over all pixels overlapping with . Note also that the overlaps can (and do) occur among pixels that are not neighbors of the original pixel. We can therefore write
| (11) |
where are matrix coefficients encoding the fraction overlapping of pixels. This transformation includes the pixelized versions of both Doppler, , and aberration, , effects, and can be implemented entirely in pixel-space. The Doppler term is an overall dipole and significantly contributes only at very large scales. The boost matrix coefficients, , on the other hand, are a function of pixels and and strongly depend on the aberration effect. They contain the information about the fractional overlap of an unboosted pixel with a boosted pixel .
To compute the boost matrix, we make use of the spherical projection of the HEALPix sphere described in Gorski:2004by . In this pixelization the pixel boundaries are straight lines in both the equatorial and polar-cap regions which makes the pixels easier to boost. To compute the matrix, we find which new pixel the original pixel center is boosted to and search its nearest neighbors and compute the overlap area of the boosted pixel using an approximation of the exact area integral. These fractional area overlaps comprise the boost matrix.
IV Comparison with exact results
To get a qualitative understanding of how a power spectrum is transformed under a Lorentz boost, we simulated skies with power in only a single mode with . We boosted this sky with , so that significant mode mixing would set in around , and extracted the resulting . The analytic calculation of the integral for the boosted Pereira:2010dn is tractable for this choice of multipole, and provides exact results for comparison to our numerical results.
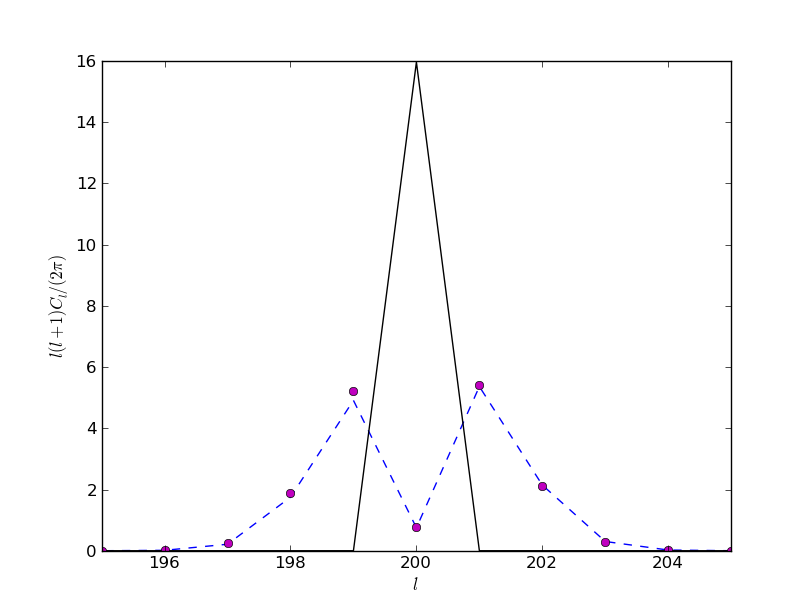
Figure 1 clearly shows that power is shifted from the mode which contained all of the power in the unboosted sky to nearby multipoles in the boosted sky. Additionally, we see that the analytic results are in good agreement with the numerical values for an Nside=512 map. The discrepancies between the numerical and analytic calculations can be attributed to errors induced by pixelization of the temperature map. We will discuss this effect at length in the following section.
V Resolution Effects
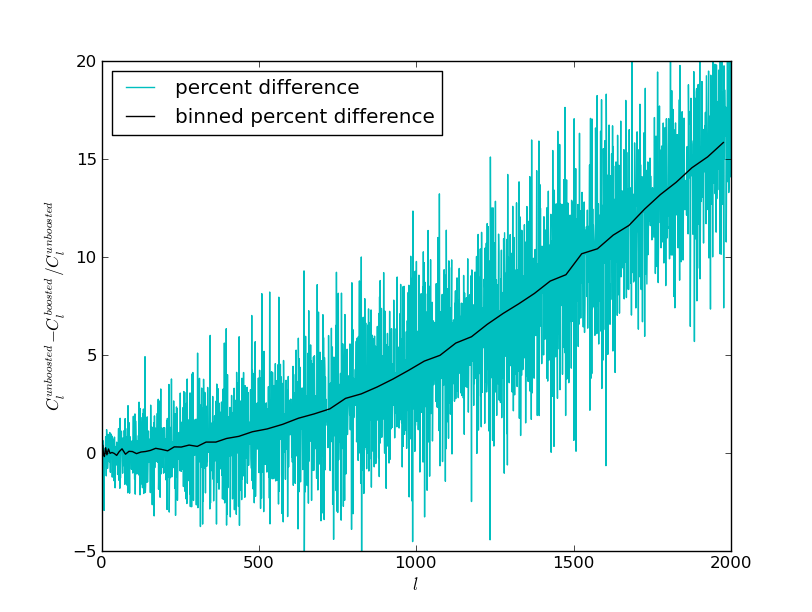
We have found that the resolution of the input map used for deboosting has a direct effect on the resultant power spectrum. This is due to pixelization effects – the inaccuracies inherent in replacing the true mapping between points on the sphere that the boost represents, with mappings from pixels of the unboosted sky, to pixels of the boosted sky. The fractional overlaps contributing to a pixel average inevitably includes area that the original, boosted map should not include. It is therefore important to check that deboosting is done at a suitable resolution for whichever range of is to be included in the subsequent analysis. Higher multipoles are most susceptible to pixelization-induced effects. If the map resolution is sufficient, then after a map has been deboosted, an equal boost in the opposite direction should reproduce the original power spectrum over the full range of to the desired/required accuracy. This can be used to check for residual resolution effects in the map at any preferred scale.
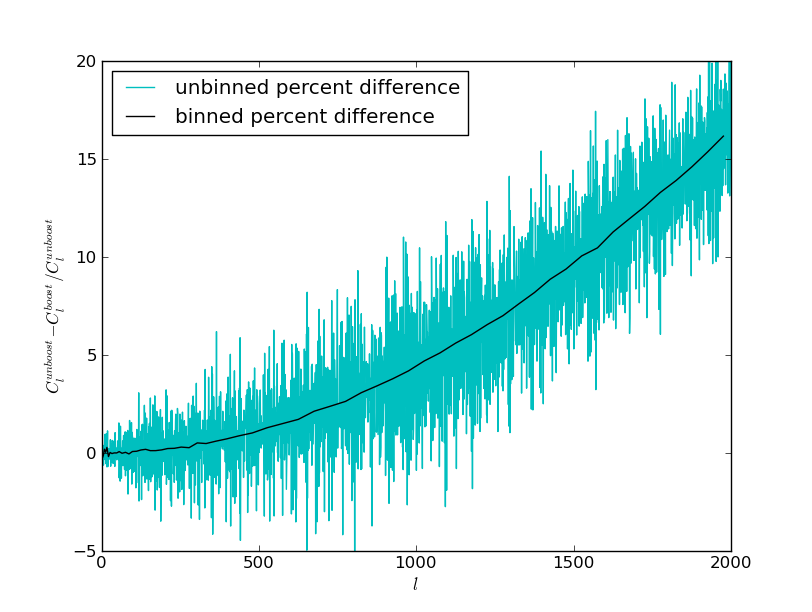
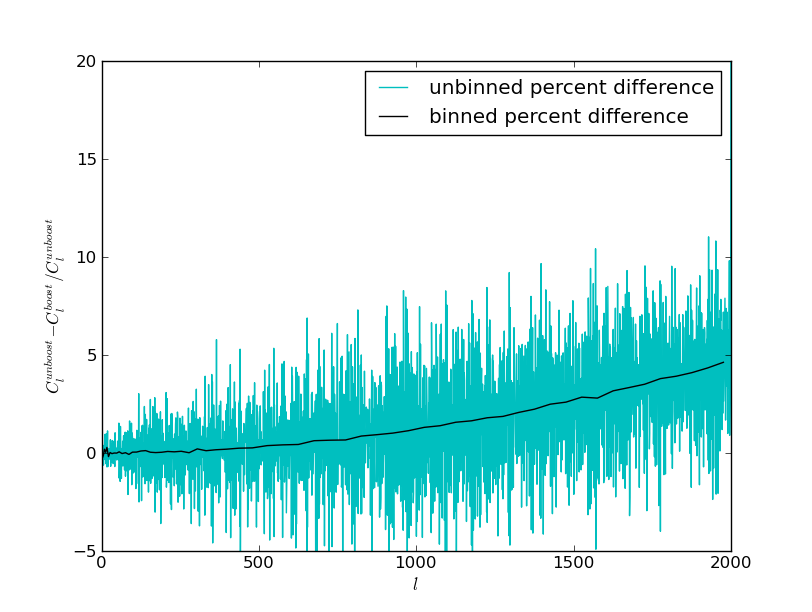
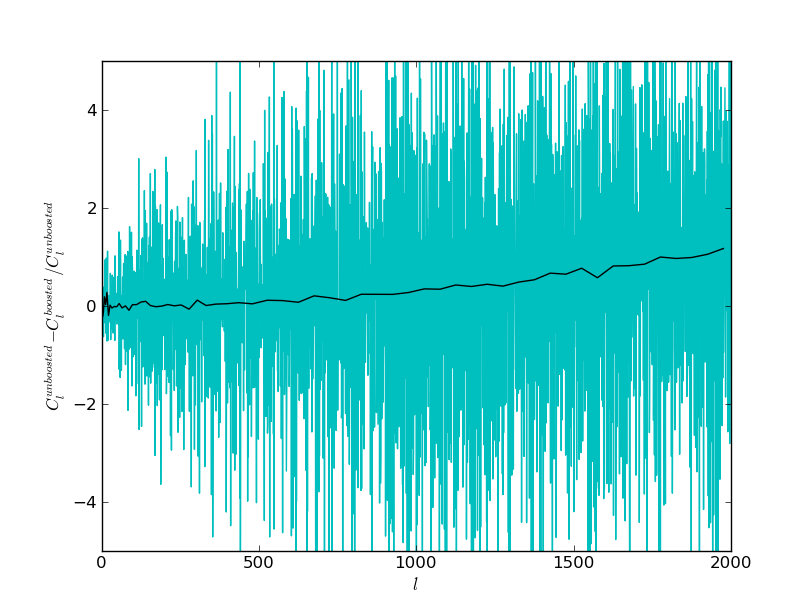
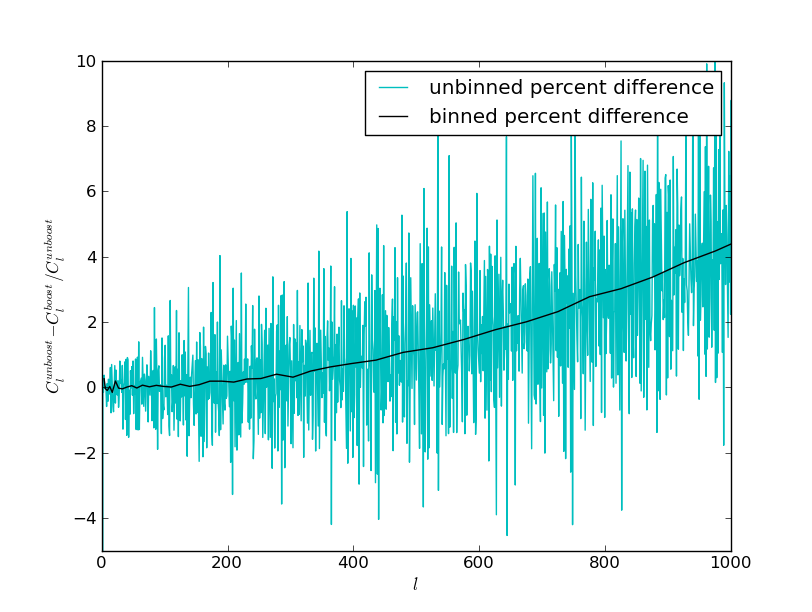
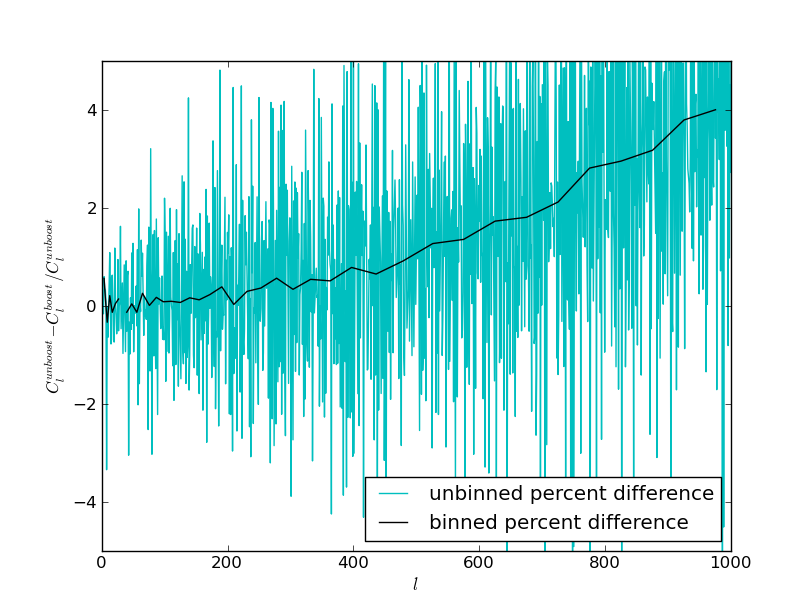
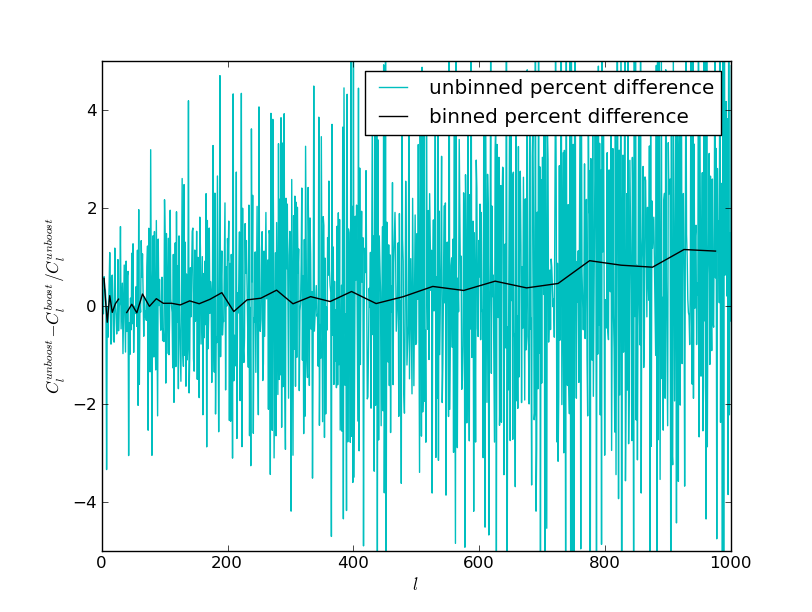
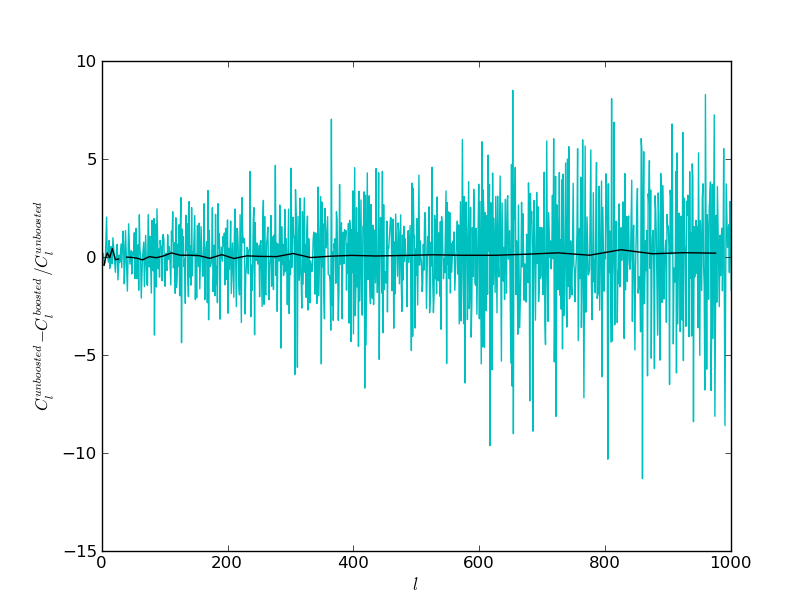
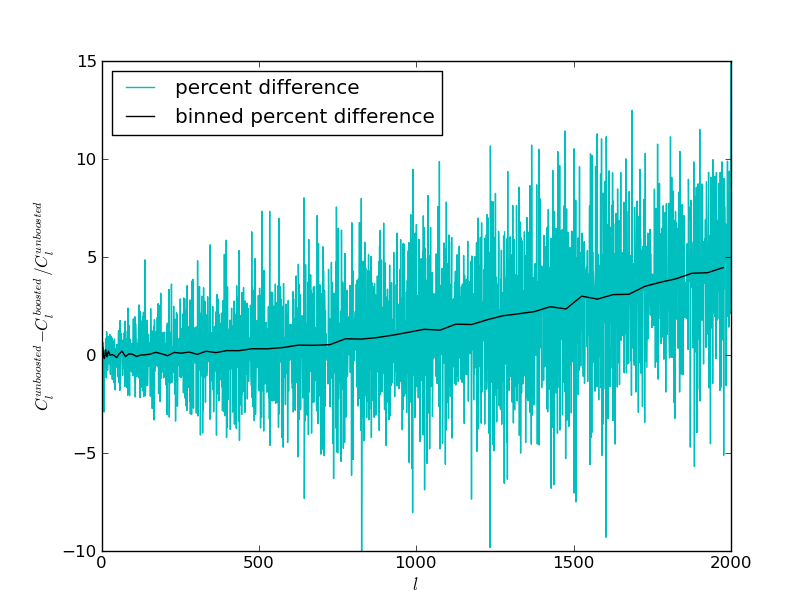
Figure 2 shows how resolution effects change the power spectrum for maps at resolutions of Nside=2048, 4096, and 8192, which are higher than those traditionally used for CMB analysis. We show that in order to circumvent the problem one must overpixelate the boost kernel for accurate deboosting. The Nside=8192 map, which has been deboosted with a boost kernel calculated at Nside=8192, has a 1% difference between the unboosted and boosted power spectrum for . We confirm that this is a resolution based effect, since an Nside=8192 map which has been boosted then deboosted has a 2% residual difference in the power spectrum for as seen in Figure 3, in agreement with the conclusion that the 1% inaccuracy in the power spectrum in Fig. 2 is predominantly due to resolution effects. Interestingly, the fluctuations in the individual s are small for the deboosted map, suggesting that the fluctuations of boosted s around the binned bias in Fig. 2 are not due to pixelization effects.
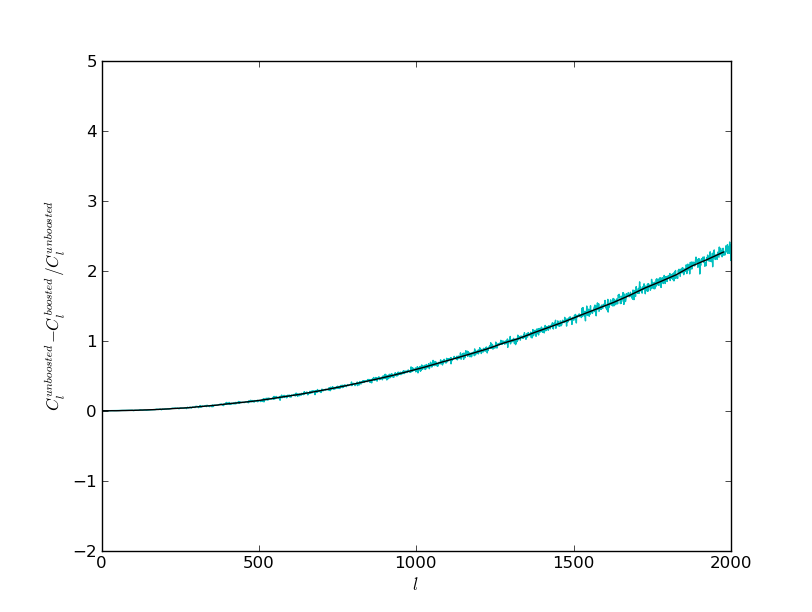
These resolution effects can clearly lead to inaccuracies in the extracted cosmological parameters if the difference in produced power spectra are assumed to be primordial in origin rather than due to the data processing.
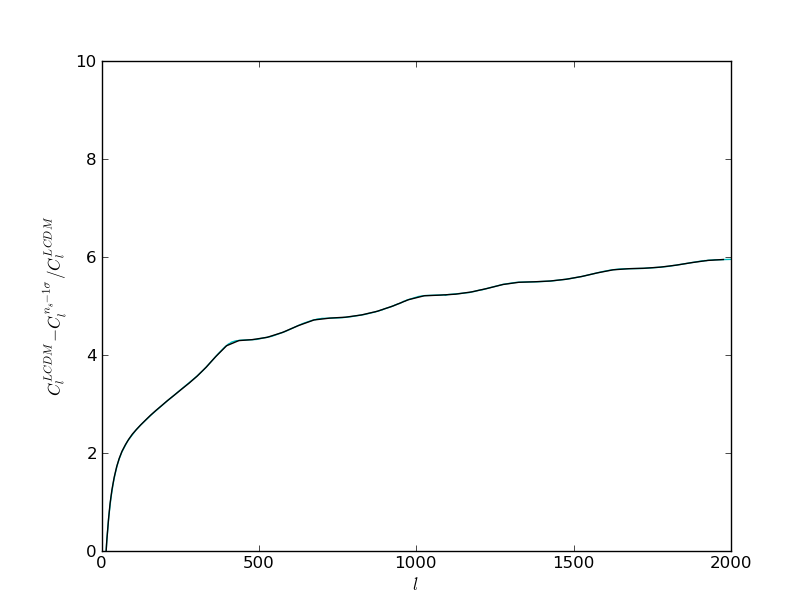
We show in Figure 4 the percent difference between two power spectra that have different values of (one was produced with the WMAP 7-year best-fit value, the other power spectrum was produced with the best-fit value plus one sigma using CAMB 222http://camb.info,Lewis:1999bs ), showing that a difference in the spectrum at large scales gives a similar difference as the resolution effects at Nside=4096. This suggests that resolution effects could be confused with changes in cosmological parameters unless one is careful to deboost with the appropriate boost kernel. As shown in Fig. 2, an Nside=8192 boost kernel would be sufficient to see changes in parameters that result from deviations larger than 1% in the binned power spectrum.
A recent paper by Catena and Notari Catena:2012hq claimed that extracted from simulated maps at a resolution of Nside=2048 with intrinsic aberration and WMAP-like noise differed by approximately 1 sigma from value extracted from an unaberrated map.
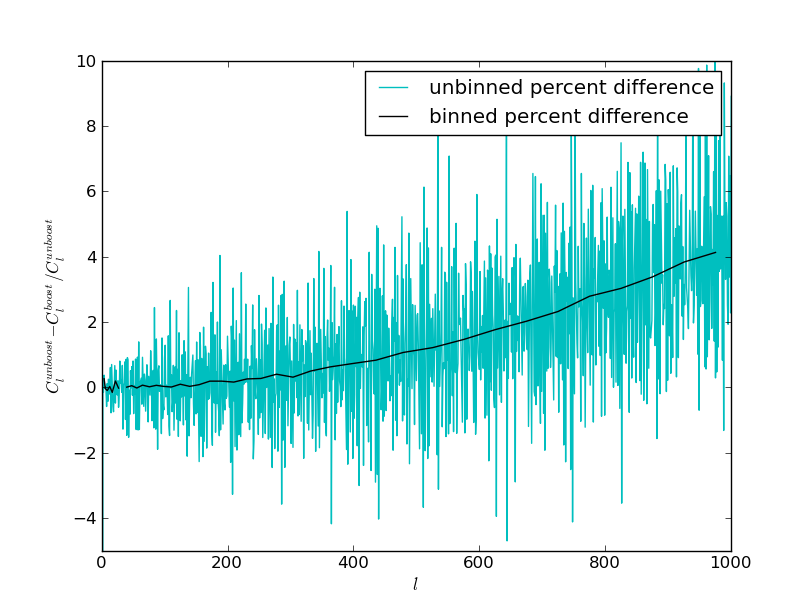
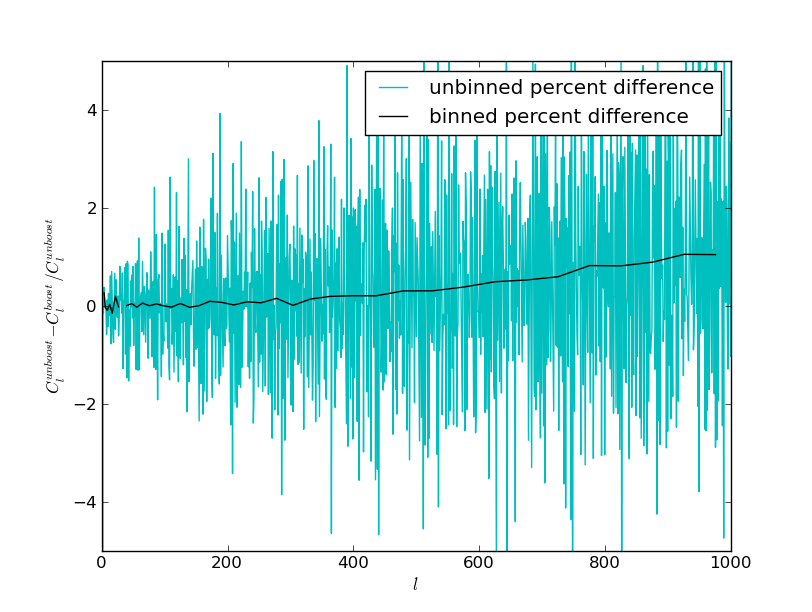
We also note that boosting at a high resolution and downgrading the map before extracting the power spectrum gives better results than simply boosting at the desired resolution from the onset as seen in Figures 5 & 6. Therefore one should calculate their boost kernel at a pixelization well above the map pixelization before applying it to a map.

VI Analysis using masked maps
Because masking a map is known to correlate modes at all scales Hinshaw:2003ex , we wanted to investigate the effect of both boosting and masking a temperature map on the extracted power spectrum. To that end, we employed two methods. We used boosted maps at Nside of 2048, 4096, and 8192, rotated them to the direction of the dipole, downgraded them to both Nside=512 and 1024 (resolutions traditionally used for CMB analysis), and masked then using the conservative galactic mask released by WMAP from the LAMBDA website 333http://lambda.gsfc.nasa.gov. The same was done for unboosted maps for a comparison between the resultant power spectra shown in Figure 7 for Nside=512 and Figure 8 for Nside=1024. We confirmed before doing full mask analysis that rotating each map did not contribute to our results.
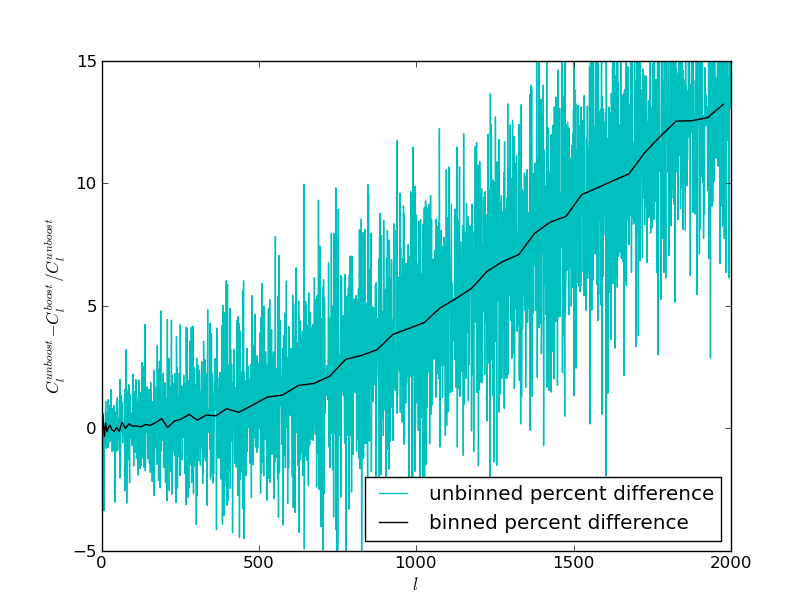
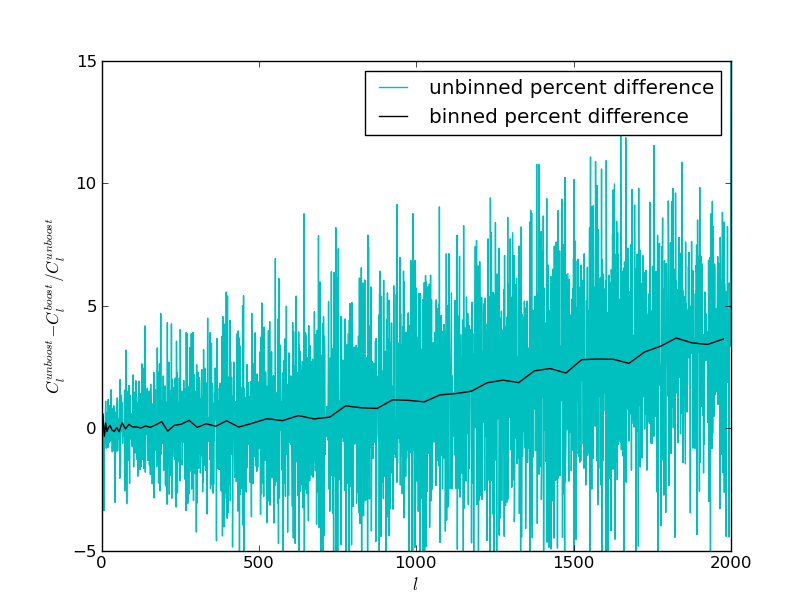

We also directly masked Nside 2048 and 4096 maps with a 20 degree wide isolatitude galactic cut. This was done because the released galactic masks are not produced at resolutions higher than 1024. The results are shown in Figure 9.
For the high resolution maps with isolatitude masks, we have found that masking a map produces a negligible effect on the power spectrum extracted from a boost map. The most noticeable difference is that individual s oscillate by a wider range than the unmasked power spectra, but the binned differences between masked and unmasked are nearly identical.
For the maps that have been masked with a galactic cut, we see that boosting at a much higher Nside, downgrading the map and then masking at either Nside=512 or 1024 give more accurate results than boosting and masking at the same resolution.
VII Discussion
We have investigated a real-space approach to deboosting a CMB temperature map by calculating fractional area overlaps of boosted pixels with the HEALPix grid in the spherical projection. We have shown that the resolution at which the deboosting is performed greatly affects the resulting power spectrum and therefore one should take great care when extracting quantitative information from deboosted maps. We have shown that for a boost kernel that is calculated at Nside=8192, the highest resolution used in this work, there is a 1% difference in the binned angular power spectrum at between full-sky boosted and unboosted maps. Because boosting, rotating the map 180 degrees, and boosting again does not return the power spectrum to its unboosted value but instead further decreases the power at large multipoles at a 2% level, the behavior is dominated by resolution effects and is not predominantly physical in origin.
We have shown that resolution effects could lead one to incorrectly conclude that cosmological quantities were biased by this systematic, as power spectra generated from CAMB with 1 sigma difference in and the WMAP best fit value of have percent differences at large multipoles consistent with those we see from boosted and unboosted maps at Nside=4096.
Since masking maps mixes multipoles, we compared using masked maps that had boost contributions included to using unboosted masked maps for power spectrum calculations. We found that, while masking along with boosting caused the difference between each individual to vary more than for full-sky maps, masking boosted maps had little effect on the differences between binned values. We found that if one wants to deboost a map and later mask with the publicly available galactic cuts released by WMAP (which can be downloaded at Nside=512 or Nside=1024) one should first deboost with a higher resolution boost kernel before masking the map.
But, as Section IV shows, Lorentz boosts do move power to nearby multipoles – the behavior we see here is a feature of our particular power spectrum and the fact that it is a slowly varying function. It is not a generic statement about Lorentz boosts for any cosmological quantity and highlights a need for polarization fields and the three-point function to be investigated.
Acknowledgements.
We would like to thank Anthony Challinor, Arthur Kosowsky, Raul Abramo, Wayne Hu, Kendrick Smith, Maik Stuke, Dominik J. Schwarz, and Pascal Vaudrevange for useful conversations during the preparation of this work. TSP thanks the physics department of Case Western Reserve University and the Institute of Theoretical Astrophysics at Oslo for their hospitalities during the stages of this work. GDS and AY are supported by a grant from the US Department of Energy and were supported early in this work by NASA under cooperative agreement NNX07AG89G. AY is supported by NASA Headquarters under the NASA Earth and Space Science Fellowship Program - Grant TRN507323. We acknowledge the use of the Legacy Archive for Microwave Background Data Analysis (LAMBDA). Support for LAMBDA is provided by the NASA Office of Space Science.References
- (1) M. Kamionkowski and L. Knox, “Aspects of the cosmic microwave background dipole,” Phys. Rev. D 67, 063001 (2003) [astro-ph/0210165].
- (2) A. Challinor and F. van Leeuwen, “Peculiar velocity effects in high resolution microwave background experiments,” Phys. Rev. D 65, 103001 (2002) [astro-ph/0112457].
- (3) A. Kosowsky, T. Kahniashvili, “The Signature of Proper Motion in the Microwave Sky,” [arXiv:1007.4539 [astro-ph.CO]].
- (4) L. Amendola, R. Catena, I. Masina et al., “Measuring our peculiar velocity on the CMB with high-multipole off-diagonal correlations,” [arXiv:1008.1183 [astro-ph.CO]].
- (5) J. Chluba, “Aberrating the CMB sky: fast and accurate computation of the aberration kernel,” arXiv:1102.3415 [astro-ph.CO].
- (6) A. Notari and M. Quartin, JCAP 1202, 026 (2012) [arXiv:1112.1400 [astro-ph.CO]].
- (7) R. Catena and A. Notari, “Cosmological parameter estimation: impact of CMB aberration,” arXiv:1210.2731 [astro-ph.CO].
- (8) K. M. Gorski, E. Hivon, A. J. Banday, B. D. Wandelt, F. K. Hansen, M. Reinecke and M. Bartelman, Astrophys. J. 622, 759 (2005) [astro-ph/0409513].
- (9) McKinley, J.M., “Relativistic transformation of solid angle”, American Journal of Physics, 48, 612–614, 1980.
- (10) T. S. Pereira, A. Yoho, M. Stuke et al., “Effects of a Cut, Lorentz-Boosted sky on the Angular Power Spectrum,” [arXiv:1009.4937 [astro-ph.CO]].
- (11) A. Lewis, A. Challinor, A. Lasenby, Anthony, “Efficient Computation of CMB anisotropies in closed FRW models”, Astrophys. J., 538, 473-476, 2000. astro-ph/9911177”.
- (12) G. Hinshaw et al. [WMAP Collaboration], “First year Wilkinson Microwave Anisotropy Probe (WMAP) observations: The Angular power spectrum,” Astrophys. J. Suppl. 148, 135 (2003) [astro-ph/0302217].