Galaxy Zoo: A Catalog of Overlapping Galaxy Pairs for Dust Studies
Abstract
Analysis of galaxies with overlapping images offers a direct way to probe the distribution of dust extinction and its effects on the background light. We present a catalog of 1990 such galaxy pairs selected from the Sloan Digital Sky Survey (SDSS) by volunteers of the Galaxy Zoo project. We highlight subsamples which are particularly useful for retrieving such properties of the dust distribution as UV extinction, the extent perpendicular to the disk plane, and extinction in the inner parts of disks. The sample spans wide ranges of morphology and surface brightness, opening up the possibility of using this technique to address systematic changes in dust extinction or distribution with galaxy type. This sample will form the basis for forthcoming work on the ranges of dust distributions in local disk galaxies, both for their astrophysical implications and as the low-redshift part of a study of the evolution of dust properties. Separate lists and figures show deep overlaps, where the inner regions of the foreground galaxy are backlit, and the relatively small number of previously-known overlapping pairs outside the SDSS DR7 sky coverage.
1 Introduction
Dust composes only a small fraction of the mass of the interstellar medium in galaxies, but it plays key roles in both their development and observed properties. Radiative cooling by dust facilitates the collapse of massive clouds during episodes of star formation, and grains remain as a key constituent of protoplanetary disks around the nascent stars. At the other end of the stars lives, grains condense in the cooling and enriched gaseous envelopes of supergiants, planetary nebulae, and the ejecta of novae and supernovae. On grander scales, dust influences the evolution of galaxies even as its absorption complicates our ability to interpret the observed properties of galaxies. Correction for dust extinction within galaxies is important for the use of SN Ia as cosmological probes, especially if the extinction curve varies among galaxies. It also affects distance measures via the Tully-Fisher relation, through the required corrections for internal extinction as a function of inclination to our line of sight. If the extinction is high enough toward the cores of luminous spirals, many straightforward estimates of stellar masses and distributions come into question (Driver et al., 2008). We present an extensive catalog of superimposed galaxy pairs, which are useful for measuring dust extinction and allow a much wider study than previously available.
For decades, the standard view on dust effects in galaxies derived from variants of the Holmberg (1958) approach, based on surface brightnesses of disks viewed at different inclinations to the line of sight. Optically thin disks will increase in surface brightness when viewed closer to edge-on, while in the optically thick limit, the surface brightness will remain constant. Holmberg’s data indicated a mild inclination dependence and correspondingly modest internal extinction. This comforting conclusion was eventually challenged by Disney et al. (1989) on theoretical grounds; models with very dusty disks could reproduce the data if the disk scale height of the dust is much less than that of the stars. Around the same time, Valentijn (1990) claimed that extensive analysis of surface photometry of galaxies from the ESO-LV sample suggested nearly constant surface brightness with disk inclination, and much higher internal opacity than previously assumed. These results spurred a rebirth in work on this question, leading to a wide range of studies converging on a general picture of high opacity in spiral arms, resonance rings, and the centers of disks, with diffuse dust fading to very small extinction at the edges of the optical disks (Thronson, 1995). Still, it became clear that substantial variations exist among and within galaxies. Use of the Galaxy Zoo morphological classifications with color data suggested further complications, such as very luminous disks being comparatively dust-deficient (Masters et al., 2010).
All these factors can be exacerbated for galaxies at high redshift. Many have high rates of star formation, suggesting a rich and massive interstellar medium, and are observed most often in the emitted ultraviolet, where dust effects are more important, compared to the emitted optical range where our basis for comparison is more extensive. Different ways of correcting for internal extinction give widely varying results, contributing to the disparate conclusions obtained by several groups on the history of cosmic star formation, even when starting from the same Hubble data in the deep fields (e.g., Madau et al. 1996, Thompson, Weymann, & Storrie-Lombardi 2001).
The dust content and distribution in galaxies may be approached in several ways. Together with models of radiative transfer and constraints from the global energy budget, fits to the spectral energy distributions (SEDs) of galaxies have been used to estimate the typical extinction at various wavelengths and total dust masses. Models must assume the relative distributions of stars and dust, as set out by, for example, Witt, Thronson, & Capuano (1992); dust mixed with the stars gives much less overall extinction than a simple foreground screen. This must be taken into account in deriving extinction laws from comparison of objects’ spectra, as in the effective extinction law derived by Calzetti, Kinney, & Storchi-Bergmann (1999). SED fitting of edge-on spirals consistently underestimates the face-on extinction and amount of UV radiation which is reprocessed (Baes et al. 2003, Baes et al. 2010, Kuchinski et al. 1998), so improved measurements of these quantities are important in refining models of this kind.
Far-infrared emission provides very direct mapping of the dust content of galaxies, modulated by the typical grain temperature. Very cold grains remain difficult to detect, and large fractions of the total dust mass can in principle be found only by careful spectral decomposition of the submillimetre emission, in view of the dominant contribution of the warmest grains. Far-IR data have hinted that some spirals have very extensive dust distributions, at least through a larger disk scale length for dust than for starlight (Davies et al. 1999, Sun & Hirashita 2011). Aside from the detectability of dust being strongly weighted to warmer grain populations, far-IR emission studies still suffer from having spatial resolutions much poorer than is available using optical techniques.
Herschel observations have contributed considerably to understanding the radial and temperature distributions of galactic dust, and the total mass in grains. With adequate spatial resolution, the mix of grain temperatures should be coupled to location in the galaxy through the radiation field of starlight. Herschel traces dust at 350 m out to 0.8–1.3 times the diameter of the de Vaucouleurs isophote in luminous spirals (Bendo et al. 2010, Pohlen et al. 2010). While the gas/dust ratio increases with radius in Virgo spirals, as might be expected from metallicity gradients (Smith et al. 2010, Pohlen et al. 2010), the dust shows a cutoff matching that of H I in stripped galaxies (Cortese et al., 2010), testifying to a dynamical link between gas and dust. Typical Herschel observations reach dust column densities close to 0.05 pc-2 at K (e.g. Smith et al. 2010). Even with these dramatic improvements in sensitivity and angular resolution, degeneracies remain in interpreting the grain populations in galaxies. These arise largely because changes in the emissivity parameter can mimic changes in the relative contributions of warm and cold dust across the FIR and submm regimes. The value of expresses departures from the blackbody intensity for an emitter which is small compared to the relevant wavelengths, of the form . Changes in the distribution of grain size will affect , although it remains unclear whether this would be measurable when averaged across whole galaxies (Alton et al. 2000, James et al. 2002).
Absorption studies have the high angular resolution of optical or ultraviolet imaging, but are limited to regions with background sources that are adequate in solid-angle coverage and our understanding of their properties. When the background light arises within the galaxy under study, other issues arise in our knowledge of the relative distribution of stars and dust, and the role of scattering; these are approached in such ways as modeling the -distribution of disk stars of various kinds to interpret multicolor absorption measurements (Elmegreen, 1980). In comparison, use of a more distant galaxy as the backlighting source gives several advantages, at the expense of dramatically reducing the range of galaxies available for analysis. The spatial resolution is limited only by the telescope’s image quality, and we need know nothing about the internal stellar structure of the foreground galaxy. Scattering corrections are negligible once the two galaxies have a line-of-sight separation only a few times their diameters, satisfied if their redshift difference indicates that the galaxies are far apart along the line of sight. High-quality extinction measurements can be obtained even in the outskirts of a galaxy disk.
Results of both these approaches to absorption will have a clumping dependence; internal structure in absorption can make small clumps harder to detect if they are below the spatial resolution of the data, and the derived reddening law will generally be flatter (grayer) than the intrinsic form given by the grain properties, due to mixing of regions with different transparency within a single resolution element. The dust clumping also enters into the distinction between dust mean column density as derived from modeling FIR measurements and the optical extinction we measure here.
Application of the overlap technique has improved with data quality. Keel (1983) showed a first application to NGC 3314 and the foreground system in NGC 1275, with vidicon imagery of limited signal-to-noise ratio. This approach was put on a genuinely quantitative footing with analyses of CCD imagery by Andredakis & van der Kruit (1992), White & Keel (1992), Berlind et al. (1997), White et al. (2000) and Domingue et al. (1999) (D1999) , in the last case comparing optical extinction with far-IR and submillimeter data to compare dust masses estimated from emission and absorption. Broadly, these studies show that extinction may be high () within spiral arms at a wide range of galactocentric radii, with interarm extinction smaller and declining outward in a roughly exponential manner. Extinction in the inner kpc has been measured only in NGC 3314a, where it reaches . One resonance-ring spiral was observed, in which the ring opacity is much larger than that found on either side of it. Extending the analysis to the resolution of tens of parsecs enabled by the Hubble Space Telescope (Keel & White 2001a, Keel & White 2001b, Elmegreen et al. 2001, Holwerda et al. 2009) showed that the effective reddening law depends significantly on linear resolution. For a clumpy distribution of dust, this is unavoidable, since the weighting of regions in transmission becomes wavelength-dependent (Fischera, Dopita, & Sutherland, 2003). The values measured in the outer disks of several spirals at HST resolution approach the local Milky Way mean, suggesting that the extinction contrast of dust structure on these scales is modest enough that we may plausibly be approaching the true grain reddening behavior. These studies were all limited by the small number of suitable and nearby galaxy pairs known, so that the behavior with galaxy type and its variance could not be explored. In particular, only the most symmetric spirals - grand-design and strongly ringed systems - could be measured when the sample size was too small to average over unmodelled structure in individual galaxy disks.
The ideal pair for mapping dust would consist of a face-on, fairly symmetric spiral, seen nearly half backlit by a smooth elliptical or S0 system, of which half is seen free of any foreground extinction. In such a system, there is a large region in which each galaxy is seen essentially by itself so that a good model of each galaxy can be produced, and a large region over which dust can be mapped. If is the background intensity and the foreground intensity, modelled point-by-point, the optical depth may be estimated from the observed intensity using
Various compromises may have to be allowed for some uses; for example, only in spiral/spiral overlaps is there enough flux to measure extinction into the ultraviolet, although the point-by-point errors are unavoidably large due to the rich structure of spirals which is most pronounced at such short wavelengths. If they are seen through particular parts of a spiral, even background galaxies of comparatively small angular size may be useful (if seen at the disk edge or across a spiral arm, for example); selection effects dictate care in analysis because of the small objects that will not be seen through relatively opaque regions (Holwerda et al., 2007c). Useful spectroscopic estimates of extinction can be made even when there are significant departures from symmetry, using the relative amounts of light at each galaxy’s redshift (Domingue et al. 2000; D2000).
The ability to harvest large samples of overlapping galaxies from surveys like the SDSS has reinvigorated the study of extinction using backlighting. We present here a new, large listing of galaxy pairs suitable for such dust studies. Its production has relied on contributions from many of the volunteer participants in the Galaxy Zoo project (Lintott et al., 2008). We will use this sample to address a range of issues in galaxy dust content via this single technique. What are the systematics with Hubble type, central surface brightness, strength of bars or rings? How common are the kinds of extended dusty disks found by Holwerda et al. (2009)? Is there a very dusty morphological disk sequence which doesn’t stand out in color alone (Thronson, 1995)? In addition to the study of dust extinction in a variety of environments, uses of the listing range from testing image-decomposition routines to correlation with supernova detections as a way of measuring reddening laws.
2 Galaxy Selection
The bulk of this catalog consists of pairs originally selected by volunteer members of the Galaxy Zoo project111http://www.galaxyzoo.org. As described by Lintott et al. (2008), the main goals of the project are reached by visual classification of galaxies from the SDSS via a web interface. This project operated outside the primary statistically-oriented framework of the Galaxy Zoo project, as so-called forum science. After noticing that some of the pairs being shown and discussed on the project forum222http://www.galaxyzooforum.org were likely non-interacting, overlapping pairs, WCK posted a specific request for such systems on the forum. Users responded enthusiastically, posting images and identifications for large numbers of candidates333The dedicated discussion thread for these pairs is http://www.galaxyzooforum.org/index.php?topic=6732.0. We inspected these candidate pairs (and objects appearing on other discussion threads of the forum, a total of suggested pairs) for overlap, utility for dust study, and evidence of interaction or other asymmetry, with surviving candidates going into our working list. Galaxy Zoo visual detections are now by far the dominant source for low-redshift overlapping systems. Prior to surveys from the SDSS images (Holwerda et al. 2007b and this work), no more than 25 such pairs were mentioned in the literature (Appendix A).
For completeness, we checked for pairs already selected spectroscopically from the SDSS (Holwerda et al., 2007b). Modifying the criteria used for the gravitational-lens search by Bolton et al. (2004), that project selected objects where the SDSS spectra showed an emission-line redshift lower than the cross-correlation (absorption-line) value. This target list was winnowed visually for appropriate geometry (images actually overlapping) to give a final set of 83 pairs. Of these, 34 are not useful morphologically for our sample here, and 9 were already selected by the Galaxy Zoo project. The remainder were objects in which two galaxies are not apparent on inspection of the SDSS images, such as having a low-luminosity foreground object closely aligned with a luminous background galaxy (so our image analysis is not appropriate, at least with ground-based data).
Some of the newly-recognized systems are large enough and bright enough to appear in earlier surveys (such as the Palomar Sky Survey), but the depth of the SDSS data and the helpful generation of color-composite images with high-dynamic-range mapping (Lupton et al., 2004) made it easy to recognize features that were overexposed on most digital representations of the Palomar photographs. The color information was especially valuable for finding reddened galaxies behind the disks of spirals, which may be prominent only in the and bands.
As an additional check for automated selection of overlapping pairs, Galaxy Zoo volunteer Lionel Pöffel contributed the results of an SQL query to identify pairs of objects closer than the sum of their listed Petrosian radii, with redshift difference . With hindsight, this approach was rendered less effective by blending issues; for strongly overlapping galaxy images, the SDSS photometric pipeline often extracts only the nucleus of one galaxy, assigning a Petrosian radius too small by factors 4–5. A converse issue is that stars can be misclassified as galaxies when superimposed on the outskirts of a large galaxy image. Indeed, of 120 candidate pairs from this selection, 24 involve a foreground star. Even after removing these false alarms, this query added 28 new pairs to the catalog, and recovered 14 otherwise selected (plus 49 objects which had been considered from forum postings and rejected for reasons of symmetry, low surface brightness in the overlapping regions, or inappropriate orientations). This comparison testifies to the utility of visual selection by the Galaxy Zoo volunteers in generating a candidate sample for this project.
Not all galaxies in our catalog are in the SDSS database. A few were otherwise known from earlier results and lie outside its footprint (Appendix A). Even within the imaging coverage, some have at least one member not identified as a separate photometric object.
Of 1990 pairs comprising our final catalog, 1713 (86%) have one or more known redshifts measured in the SDSS or tabulated by NED444http://ned.ipac.caltech.edu/. The NED additions are for bright galaxies or companions to galaxies with SDSS spectra, where there is no SDSS spectrum because of sampling or fiber-collision limitations. We adopt a redshift-difference criterion to flat the subset of pairs which cannot be physically interacting, driven by the range of seen in tidally-interacting galaxy pairs and including high-velocity encounters in clusters. We adopt ( km s-1, a very conservative value which would distinguish non-associated galaxies even in the presence of significant redshift errors. Of 494 pairs with both redshifts known, 218 satisfy this criterion, ruling out gravitational interaction with each other. For this subset, scattering effects are guaranteed to be negligible in measurements of obscuration (White et al., 2000), and there will be no asymmetries driven by interaction between the pair members. We rejected candidate pairs which have these large redshift differences, but in the wrong sense to be useful for dust studies (such as an elliptical galaxy in the foreground of a spiral).
The catalog properties in distance and are illustrated in Fig. 1, which shows a histogram of the smaller redshift value , when both are known, or the single known redshift, and plots values when both and are known. For systems with one redshift known, the median value is , with quartiles 0.041, 0.105. Combining single redshifts with foreground values when both are known, the median is (quartiles 0.036, 0.097), while for background systems when both values are known, the range rises as expected: median and quartiles 0.040, 0.127.

WCK screened pairs posted by Galaxy Zoo participants for suitability, in particular rejecting pairs with obvious tidal interaction as seen on the SDSS color composite images. In a final round, WCK and AMM independently re-examined candidates, to check for clearly interacting pairs which had survived the initial round. At this stage, we rejected about 10% of systems initially selected for the catalog. These were pairs with obvious tidal tails or decentered nuclei, objects where it was not clear whether there are in fact two distinct galaxies rather than unusual substructure in a single one, and pairs in which the redshift difference is both in the wrong sense to be useful for dust studies (spiral behind elliptical) and large enough to clearly show that the galaxies are not in the same group, so that the redshifts will indicate distance ordering. This “discard” list is available in case some of these systems prove of use for related questions. We required positive evidence of tidal distortion to reject a candidate pair; some interacting systems with only weak distortion, or tidal features evident only at low surface brightness, will remain in the sample.
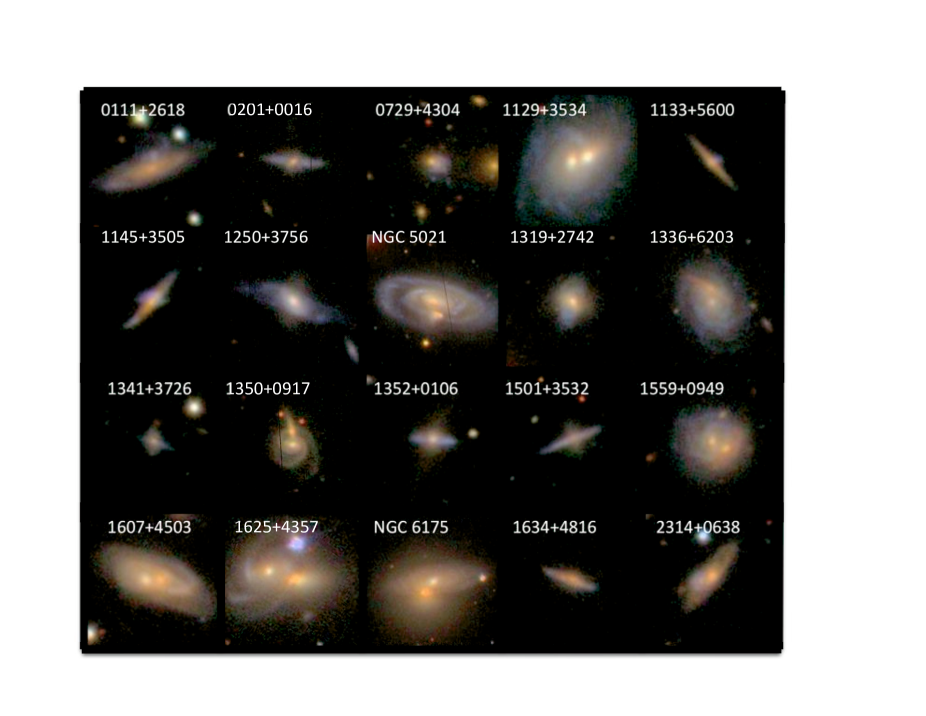
Our catalog of 1990 overlapping galaxy pairs is listed in Table 1. The entire listing is given in the online edition; the printed version includes a subset to illustrate content and format. This subset includes the initial lines of the RA-ordered list, all the newly-found objects shown in Fig. 2, and a few additional objects to illustrate the combinations of data and identifications found. Data for previously known pairs in Fig. 2 are listed in Table 4. SDSS pairs are listed with the coordinate designation of the brighter member. Magnitudes are SDSS modelmag_r values in the band. These must be treated with caution, if not suspicion, because pipeline separation of strongly blended galaxy images often results in assigning much of the fainter galaxy’s flux to the brighter one (section 2.2), and spot checks also show some pairs in which even a smooth symmetric galaxy is broken into multiple SDSS photometric objects.. A second magnitude with only one significant figure past the decimal was estimated from the SDSS composite image, if the galaxy was not detected as an SDSS object (or as multiple objects). A value of 30.00 was assigned if the images are so strongly blended that no estimate for the fainter galaxy was reasonable. In some cases there are multiple background galaxies; the magnitude listed is for the brightest of these. We include redshifts where features for both members were clearly detected in a single SDSS spectrum (indicated by fg and bg for fore/background). The catalog in sortable web form, with additional PDF files with finding charts and additional data on each pair as well as our “reject” list, is available from http://data.zooniverse.org/overlaps.html.
2.1 Pair categories
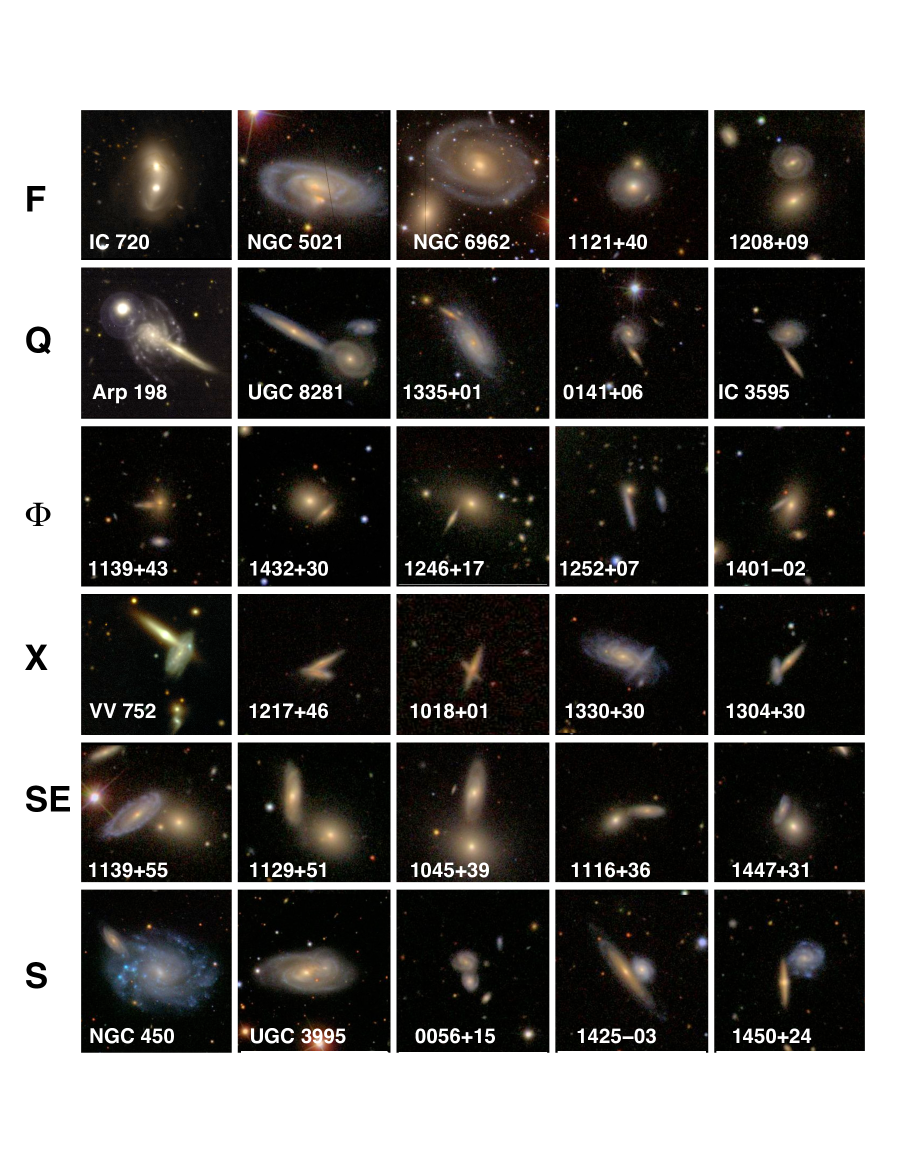
We note some special categories defined by geometry or redshifts with a “type” indicator in Table 1, which mark subsets of the catalog particularly useful for various purposes. They are denoted by mnemonic designations, which are summarized along with their frequency in the catalog in Table 2. A selection of each is illustrated in Fig. 2.
F: spirals seen nearly face-on in front of an elliptical or S0 background system. These are closest to the ideal for most kinds of extinction studies. For our purposes, these include spirals face-on enough that the extinction structure is dominated by arm/interarm variations, rather than the extent of dust perpendicular to the disk. In practice this includes spirals with planes inclined as much as 60∘ to the plane of the sky.
Q: the background galaxy is nearly edge-on and is projected nearly radial to the foreground galaxy, so the backlit area spans a large range in radius but a narrow one azimuthally within the foreground system. This means that symmetry requirements on the foreground galaxy can be relaxed substantially, modeling it by interpolation across a narrow angular sector. Arp 198 (UGC 6073, VV 267; Fig. 2) is a good example, in which the run of extinction with radius can be retrieved even in the presence of a rather complex foreground spiral pattern. In the most favorable cases, the SDSS images show evidence of extinction to indicate that the edge-on galaxy is in the background; better imagery may show some of the fainter Q systems to in fact have the edge-on galaxy in front.
: the spiral is seen essentially edge-on, at least partially backlit by a smooth galaxy. These are useful for studying the structure of extinction perpendicular to the disk of the foreground galaxy, and the radial extent of extinction to very sensitive levels. The letter is selected to remind one of a thin disk with a round galaxy behind it.
X: both galaxies are seen nearly edge-on, with their disks crossing as seen either near both nuclei or along one disk. These are relevant to the occurrence of extended -distributions of dust (as in types), as well as to questions of the distributions of angular momenta in pairs (with geometrically-based corrections for the likelihood of seeing the disks intersect when they have various actual angular differences). A handful of these (coded with R, as below) may in fact be polar-ring systems seen edge-on to both the central galaxy and the ring.
SE: spiral/elliptical superpositions that do not fall in one of the other geometric categories above.
S: spiral/spiral overlaps. These have much richer background structure than S/E overlaps, but are useful in probing extinction into the ultraviolet because the background source will remain detectable at much shorter wavelengths. At least using averaging techniques, they can be used to compare optical and UV extinction. With high-quaIity images, additional symmetry clues such as the direction of arm features can help separate foreground and background structure (Keel & White, 2001b).
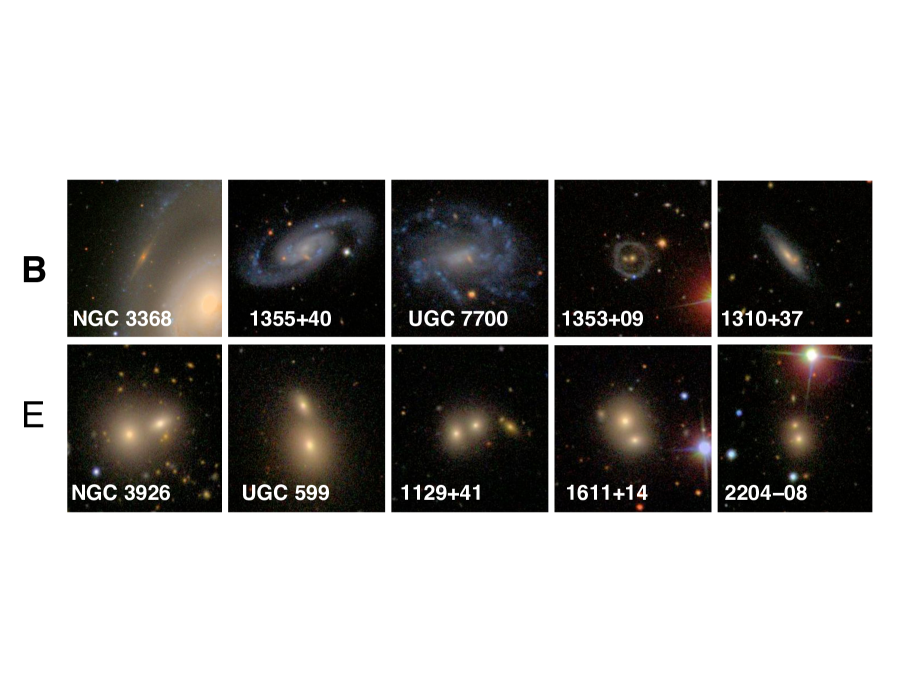
B: the background galaxy has much smaller angular size than the foreground disk. Such alignments are universal for small enough background systems (transitioning, when their statistics are large, into the “synthetic field” technique matching galaxy counts and colors to global means and taking into account the cosmic variance; Holwerda et al. 2005a, Holwerda et al. 2005b, Holwerda et al. 2005c, Holwerda et al. 2007a). As these papers demonstrate, considerable care is needed using numerous small background galaxies to map extinction, because of bias in favour of the more transparent regions. Therefore, our listing includes only those where the line of sight to the background galaxy is particularly useful as a dust probe – edge of the optical disk, inside a resonance ring, or behind an outer spiral arm. In these cases even a local measurement of differential extinction can be useful. This category in particular employed subjective criteria as to utility.
E: pairs containing only elliptical or S0 galaxies, as judged from the SDSS. Our search concentrated on spirals, so coverage of these systems is much less complete. Many such pairs occur in clusters, but the possibility of subtle tidal distortions makes use of pairs with large redshift differences more valuable in seeking even low-opacity diffuse dust components.
R: we use this code to flag a few objects which might be either near-central superpositions or polar rings, where better imagery or spectroscopic information would be needed to be sure. All of these, if overlaps, have very small central impact parameters and also appear in our list of deep overlaps.
Nineteen pairs do not fall in any of these geometrically-defined categories, and are labelled simply “misc” in the table.
: these are selected to have a known redshift difference so large that the two galaxies will not be interacting with each other. Starting with known pairs, we take as the demarcation point. These pairs are the least likely to show tidal features or have tidally-induced asymmetries, and are so far apart that scattering corrections are negligible (White et al., 2000). This category is independent of the morphological categories, and subsets of each type fulfill the criterion. The electronic table lists this in a separate column for ease of search.
Among several of these categories we find deep overlaps, pairs in which the background galaxy is seen through the inner part of the foreground system. The reddening is often so strong that they can be selected from the SDSS composites for showing the background nucleus only at . The nearby type example is NGC 3314 (Keel & White, 2001b); this catalog includes several additional examples of central spiral/spiral overlaps, as well as some fairly nearby instances of backlighting extending almost to the foreground nucleus. These objects are important (although we do not know how complete the selection is) because of evidence that the inner parts of some disks have significant optical depth even in the band, making further IR observations a promising approach for extinction measurements very deep inside these spirals. Table 3 lists such deep overlaps from our catalog which are like NGC 3314 in the sense of having a background galaxy large and bright enough, projected close enough, for high-surface-brightness backlighting of the inner regions (typically inner 3 kpc) of a foreground spiral which is not nearly edge-on. Six of these fall in our type R, which may also be polar ring systems. Table 3 includes the projected angular separation between galaxy nuclei.
It is difficult to make an external assessment of the completeness of our catalog in magnitude, since the SDSS photometric pipeline sometimes fails in apportioning flux between deeply blended objects. Likewise, the pipeline size measurements, such as Petrosian radius, are not reliable for much of the sample.
2.2 Redshifts
Since photometric redshifts can be accurate enough, in some applications, to pick out galaxy pairs with matching redshifts (Quadri & Williams, 2010), we have explored the use of the SDSS photometric redshift estimators to distinguish additional pairs with large redshift differences, with disappointing (although not wholly unexpected) results. For 156 distinct pairs having two spectroscopic redshifts from SDSS DR7, we considered the template-based and neural-network estimates photoz, photoz2 and their error estimates from the SDSS database. Of these, 33 showed catastrophic failures in both estimators, with error , traceable to deblending problems. In these cases, at least one pair member has its Petrosian radius underestimated by factors , due to the deblending algorithm assigning only the nucleus to this object and the additional diffuse flux to the other galaxy or to neither. This generally carries corresponding photometric errors; a strong correlation between errors for the two estimators indicates that the photometric errors are mostly responsible. Even for pair members without obvious photometric problems, the photometric estimates provide almost no information for (where both are biased upward, by 0.03 for photoz and 0.04 for photoz2), and are useful only for (in which case the apparent sizes of the galaxies otherwise suggest large differences independently).
Our best assessment of the completeness of sample selection at this point comes from the subset with spectroscopic redshifts, which we can compare to the entire SDSS to ask what fraction of galaxies are selected as a function of . Fig. 4 shows the fraction of SDSS galaxies in our catalog as a function of redshift. We take the lower redshift of a pair when both values are known, since the foreground galaxy is the one under study. A galaxy is 10 times more likely to be selected at as at , although the probability stay roughly constant from . We can investigate how much of this effect is due to B-type pairs, with a faint background system; for more distant foreground systems, there is less volume available for background systems within the effective distance limit for seeing structure in SDSS images. This effect is significant only for ; the lower trace in Fig. 4 shows the result of omitting the B-type foreground systems where the smaller system would be missed at greater distances. This accounts for only a small fraction of the selection change with . A large part of the effect must be in resolution, as the characteristic structures picking out two galaxies, and distinguishing spirals from ellipticals, become so blurred that only more obvious pairings are found.
2.3 Magnitude selection
Statistics with pair and component magnitude provide some insight into the sample selection, subject to the caveats above about pipeline magnitudes for blended images. Following Darg et al. (2010), who deal with magnitudes for merging systems, we use the magnitude of the -band light from both components of each pair, which is more robust to how the light was deblended into constituent galaxies. The magnitude difference between pair members shows, as expected, a systematic decrease for fainter pairs, albeit with large scatter, the whole range remains well populated for objects brighter than (Fig. 5.
The counts of sample pairs with magnitude follow the Euclidean slope only at the bright end (Fig. 6). When separated into bins by , the distributions remain broadly similar; incompleteness becomes serious at levels , reaching fainter for more nearly equal pairs. Again, as one might expect, more equal pairs are selected preferentially among fainter systems.


3 Summary
From thousands of candidates identified by Galaxy Zoo participants using the Sloan Digital Sky Survey, we have produced a catalog of 1990 galaxy pairs with geometry of overlap suitable for use in the study of dust extinction. These are coded to distinguish various kinds of overlap useful for different aspects of the problem - spirals partially backlit by E or S0 galaxies, spiral/spiral pairs, systems with the background galaxy edge-on and radial to the foreground system, and so on. About 11% of these have known redshift differences large enough to eliminate the possibility of interaction with one another, and thus the possibility of such an interaction causing a breakdown of the galaxy symmetry needed to analyze the extinction. Use of these pairs to study extinction complements infrared techniques, giving the high angular resolution of optical observations and retaining sensitivity to even very cold grain populations. This sample can also be used to search for additional examples of very extended dust structures, such as found by Holwerda et al. (2009). Additional uses of this listing might include correlation with supernova searches, yielding complementary reddening information, use of foreground absorption to distinguish which members of galaxy pairs are in the foreground and hence constrain their orbital location via redshift differences, and use of “wrong-way” redshift differences as a probe of peculiar motions.
Further papers will deal with analysis of the images of a larger subset of these galaxies from optical and ultraviolet images, using these additional data to address the spatial distribution and reddening law of the dust in the optical and ultraviolet ranges.
References
- Alton et al. (2000) Alton, P.B., Xilouris, E.M.,, Bianchi, S., Davies, J. & Kylafis, N. 2000 A&A 356, 795
- Andredakis & van der Kruit (1992) Andredakis, Y.C. & van der Kruit, P.C. 1992, A&A 265,396
- Baes et al. (2003) Baes, M., et al. 2003, MNRAS, 343, 1081
- Baes et al. (2010) Baes, M., et al. 2010, A&A, 518, L39
- Bendo et al. (2010) Bendo, G.J. et al. 2010, A&A 518, L65
- Berlind et al. (1997) Berlind, A. A., Quillen, A. C., Pogge, R. W., & Sellgren, K. 1997, AJ, 114, 107
- Bolton et al. (2004) Bolton, A. S., Burles, S., Schlegel, D. J., Eisenstein, D. J., & Brinkmann, J. 2004, AJ, 127, 1860
- Calzetti, Kinney, & Storchi-Bergmann (1999) Calzetti, D., Kinney, A. L., & Storchi-Bergmann, T. 1994, ApJ, 429, 582
- Cortese et al. (2010) Cortese, L. et al. 2010, A&A 518, L49
- Darg et al. (2010) Darg, D. et al. 2010, MNRAS 401, 1043
- Davies et al. (1999) Davies, J. I., Alton, P., Trewhella, M., Evans, R., & Bianchi, S. 1999, MNRAS, 304, 495
- Disney et al. (1989) Disney, M., Davies, J., & Philipps, S. 1989, MNRAS, 239, 939
- Domingue et al. (1999) Domingue, D. L., Keel, W. C., & White, R. E., III 2000, AJ, 118, 1542
- Domingue et al. (2000) Domingue, D. L., Keel, W. C., Ryder, S. D., & White, R. E., III 2000, ApJ, 545, 171 (D2000)
- Driver et al. (2008) Driver, S.P., Popescu, C., Tuffs, R.J., Graham, A.W., Liske, J. & Baldry, I. 2008, ApJ 678, L101
- Elmegreen et al. (2001) Elmegreen, D. M., 678, L101 Kaufman, M., Elmegreen, B. G., Brinks, E., Struck, C., Klarić, M., & Thomasson, M. 2001, AJ, 121, 182
- Elmegreen (1980) Elmegreen, D. M., 1980, ApJS, 43, 37
- Fischera, Dopita, & Sutherland (2003) Fischera, J., Dopita, M.A., & Sutherland, R.A. 2003, ApJ, 599. L21
- Holmberg (1958) Holmberg, E. 1958, Medd. Lunds Astro. Obs. 2, 136
- Holwerda et al. (2005a) Holwerda, B. W., Gonzalez, R. A., Allen, R. J., & van der Kruit, P. C. 2005, AJ, 129, 1381
- Holwerda et al. (2005b) Holwerda, B. W., Gonzalez, R. A., Allen, R. J., & van der Kruit, P. C. 2005, AJ, 129, 1396
- Holwerda et al. (2005c) Holwerda, B. W., González, R. A., Allen, R. J., & van der Kruit, P. C. 2005, A&A, 444, 101
- Holwerda et al. (2007a) Holwerda, B. W., et al. 2007a, AJ, 134, 2226
- Holwerda et al. (2007b) Holwerda, B. W., Keel, W. C., & Bolton, A. 2007b, AJ, 134, 2385
- Holwerda et al. (2007c) Holwerda, B. W., et al. 2007c, AJ, 134, 1685
- Holwerda et al. (2009) Holwerda, B. W., Keel, W. C., Williams, B., Dalcanton, J. J., & de Jong, R. S. 2009, AJ, 137, 3000
- James et al. ( 2002) James, A.J., Dunne, L., Eales, S., & Edmunds, M.G. 2002, MNRAS 335, 753
- Keel (1983) Keel, W. C. 1983, AJ, 88, 1579
- Keel (1985) Keel, W. C. 1985, AJ, 90, 2207
- Keel & White (2001a) Keel, W. C., & White, R. E., III 2001, AJ, 121, 1442
- Keel & White (2001b) Keel, W. C., & White, R. E., III 2001, AJ, 122, 1369
- Kuchinski et al. (1998) Kuchinski, L. E., Terndrup, D. M., Gordon, K. D., & Witt, A. N. 1998, AJ, 115, 1438
- Lintott et al. (2008) Lintott, C. J., et al. 2008, MNRAS, 389, 1179
- Lupton et al. (2004) Lupton, R., Blanton, M. R., Fekete, G., Hogg, D. W., O’Mullane, W., Szalay, A., & Wherry, N. 2004, PASP, 116, 133
- Madau et al. (1996) Madau, P., Ferguson, H.C., Dickinson, M.E., Giavalisco, M., Steidel, C.C. & Fruchter, A. 1996, MNRAS, 281, 1388
- Marziani et al. (1999) Marziani, P., D’Onofrio, M., Dultzin-Hacyan, D,., & Sulentic, J.W. 1999, AJ 117, 2736
- Masters et al. (2010) Masters, K.L. et al. 2010, MNRAS, 04, 792
- Pohlen et al. (2010) Pohlen, M. et al. 2010, A&A 518, L72
- Quadri & Williams (2010) Quadri, R. F., & Williams, R. J. 2010, ApJ 725, 794
- Smith et al. (2010) Smith, M.W.L. et al. 2010. A&A 518, L51
- Sun & Hirashita (2011) Sun, A.-L. & Hirashita, H. 2011, MNRAS 411, 1707
- Thilker et al. (2007) Thilker, D. et al. 2007 ApJS 173, 538
- Thompson, Weymann, & Storrie-Lombardi (2001) Thompson, R.J., Weymann, R.J., & Storrie-Lombardi, L.J., 2001, ApJ 546, 694
- Thronson (1995) Thronson, H.A. 1995, in The Opacity of Spiral Disks, eds. J. Davis & M. Disney, NATO ASI Ser. C, vol. 469, p, 369 & Kaiser, N. 2004, Scientific Detectors for Astronomy, The Beginning of a New Era, 300, 385
- White & Keel (1992) White, R. E., & Keel, W. C. 1992, Nature, 359, 655 (WK92)
- White et al. (2000) White, R. E., III, Keel, W. C., & Conselice, C. J. 2000, ApJ, 542, 761 (WKC)
- Witt, Thronson, & Capuano (1992) Witt, A. N., Thronson, H. A., Jr., & Capuano, J. M., Jr. 1992 ApJ, 393, 611
- Valentijn (1990) Valentijn, E. 1990, Nature, 346, 153
Appendix A Previously known pairs and pairs outside the SDSS
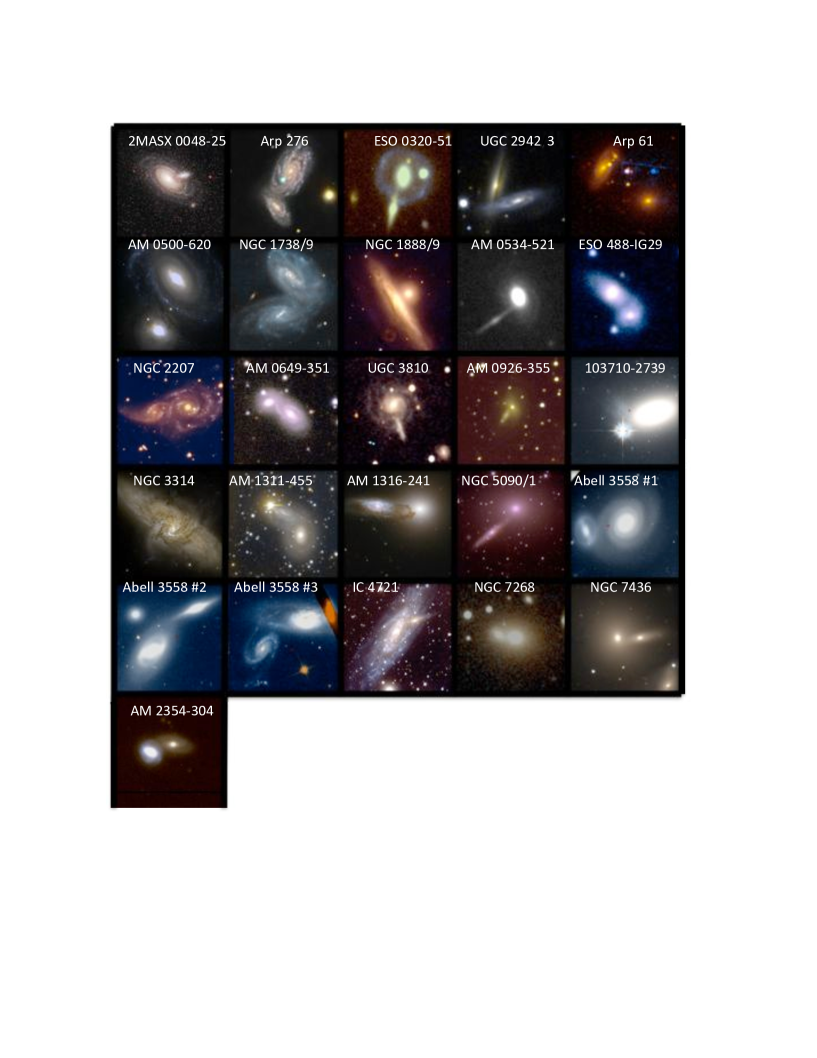
For convenience of comparison, we list in Table 4 the handful of overlapping pairs noted in other studies (including 5 recognized serendipitously in HST images, at redshifts low enough to be included in the catalog). Among these, 9 lie within the SDSS sky coverage, all of which were independently found in the Galaxy Zoo project. Fig. 7 shows the pairs outside the SDSS DR8 imaging region, collecting color images for ease for comparison. These are included in the catalog, and may be recognized by their lack of an SDSS ObjID identifier.
| Coordinate name | SDSS ObjID | Type | Cross-ID | ||||
|---|---|---|---|---|---|---|---|
| SDSS J000007.03+081645.1 | 587743960499880043 | 13.43 | 14.84 | 0.0387 S | E | UGC 12890 | |
| SDSS J000046.97+282407.3 | 758874298530726152 | 13.42 | 14.60 | 0.0272 E | 0.0292 W | F | UGC 12899 |
| SDSS J000058.93+285442.1 | 758874371533308165 | 13.82 | 16.17 | 0.0230 | Q | UGC 12901 | |
| SDSS J000103.67+343911.0 | 758874373141496140 | 14.11 | 19.98 | 0.0423 SE | F | ||
| SDSS J000140.21+010531.2 | 587731187814695060 | 15.72 | 21.66 | 0.0611 fg | |||
| SDSS J000253.63+315102.2 | 758874300139962790 | 18.09 | 18.92 | Q | |||
| SDSS J000320.46+083707.5 | 587743961037078573 | 13.78 | 15.39 | 0.0397 | S | UGC 10 | |
| SDSS J000400.79+160110.4 | 587727223561453822 | 15.95 | 11092 (S) | F | |||
| SDSS J000401.52-111027.3 | 587727177913008261 | 14.75 | 11392 (SW) | S | |||
| SDSS J000620.75-105653.7 | 587727225153978471 | 17.73 | 18.32 | 0.1091 NE | F | ||
| SDSS J000954.49-050116.8 | 587747122131304642 | 16.56 | 21.50 | misc | |||
| SDSS J001122.29+062321.6 | 587743795144425534 | 12.83 | 15.47 | 0.0201 W | S | ||
| SDSS J001315.28+000240.7 | 588015509270822939 | 17.03 | 17.78 | 0.0902 SE | 0.0390 NW | Q | |
| SDSS J001347.12+004612.9 | 587731187279134987 | 16.56 | 21.50 | 0.1556 N | 0.1531 S | E | |
| SDSS J001430.96+154907.2 | 587727180601163792 | 16.18 | 16.84 | 0.0806 S | S | ||
| SDSS J001531.05-004805.6 | 588015508197343379 | 15.15 | 17.64 | 00685 E | 0.1556 W | F | |
| SDSS J001725.83-005842.5 | 587731185132109990 | 14.09 | 20.37 | 0.0181 N | S | ||
| SDSS J001747.95-122422.2 | 587747073275003048 | 14.96 | 15.37 | F | |||
| SDSS J002305.73+064506.0 | 587744044784156688 | 14.25 | 17.38 | 0.0494 N | S | ||
| SDSS J002315.77+241310.9 | 587740522933715074 | 17.43 | 18.5 | X | |||
| SDSS J005618.88+152531.9 | 587724199351025860 | 16.01 | 16.29 | 0.0709 N | 0.0771 S | S | |
| SDSS J005745.03-002509.9 | 588015508738801700 | 13.51 | 14.98 | 0.0408 N | 0.0437 S | E | UGC 599 |
| SDSS J014145.47+060151.9 | 587744293354668078 | 15.61 | 16.90 | Q | |||
| SDSS J101800.73+012116.3 | 587726031700492467 | 17.42 | 30.0 | 0.1265 ctr | X | ||
| SDSS J104524.96+390949.9 | 587735661016318093 | 14.09 | 144.3 | 0.0254 S | 0.0265 N | SE | |
| SDSS J104645.67+114911.8 | 588017703996424196 | 10.16 | 15.73 | 0.0030 SW | S | NGC 3368, M96 | |
| SDSS J105946.49+173912.4 | 587742865816944739 | 14.55 | 17.77 | 0.0295 W | 0.0294 E | Q | Arp 198 |
| SDSS J111605.47+361410.1 | 587739097520799818 | 15.24 | 16.02 | 0.0776 E | 0.0785 W | SE | |
| SDSS J112116.82+402043.4 | 588017719566467080 | 14.31 | 16.49 | 0.0209 S | 0.1147 S | F | |
| SDSS J112924.32+415219.3 | 588017721177800860 | 15.15 | 15.15 | E | |||
| SDSS J112943.31+511415.7 | 587732134846070798 | 14.08 | 14.29 | 0.0335 E | 0.0345 W | SE | |
| SDSS J113912.22+553957.8 | 587731870706565177 | 14.15 | 14.42 | 0.0623 SW | 0.0615 NE | SE | |
| SDSS J113947.32+435031.7 | 588017625615368313 | 16.11 | 17.33 | 0.1344 W | |||
| SDSS J114222.33+084611.5 | 587732769978777642 | 13.91 | 13.98 | 0.0216 N | 0.0220 S | F | IC 720 |
| SDSS J115128.22+220133.4 | 587742061070057546 | 13.48 | 15.06 | 0.0284 W | 0.0257 E | E | NGC 3926 |
| SDSS J120802.07+094557.0 | 587732771055337475 | 14.52 | 15.27 | 0.0694 S | F | UGC 7114 | |
| SDSS J121748.55+463454.8 | 588298661962973323 | 17.84 | 20.0 | 0.0658 | X | ||
| SDSS J123232.82+635238.3 | 587728676858101872 | 14.35 | 18.3 | 0.0099 N | B | UGC 7700 | |
| SDSS J123706.39+234712.7 | 587742188833210435 | 15.89 | 16.49 | 0.0570 S | Q | IC 3595 | |
| SDSS J124613.57+171012.8 | 587742774026633226 | 14.69 | 16.90 | 0.0804 NW | |||
| SDSS J125224.50+071053.3 | 588017724940878045 | 16.68 | 17.01 | 0.0806 N | |||
| SDSS J130431.54+303417.7 | 587739721901932619 | 15.69 | 16.98 | 0.0622 E | X | ||
| SDSS J131012.03+373125.4 | 587739098604503163 | 15.21 | 16.82 | 0.0429 NE | B | ||
| SDSS J131158.38+444832.1 | 588017627233124523 | 14.75 | 14.75 | Q | UGC 8281 | ||
| SDSS J131206.27+461146.1 | 588298662503972874 | 12.9 | 17.8 | 0.0283 N | F | NGC 5021 | |
| SDSS J133026.37+300144.4 | 587739709015261237 | 14.53 | 17.5 | 0.0373 NE | X | UGC 8497 | |
| SDSS J133558.58+014348.2 | 587726031722184751 | 14.38 | 15.90 | 0.0228 S | Q | ||
| SDSS J135316.39+094017.5 | 587736543089000513 | 17.33 | 18.15 | 0.1349 W | B | ||
| SDSS J135507.95+401003.4 | 587736585499246631 | 14.45 | 20.06 | 0.0083 NE | B | UGC 8841 | |
| SDSS J140138.45-022558.8 | 587729777442488436 | 15.08 | 17.63 | 0.0505 SW | |||
| SDSS J142459.13-030401.2 | 587729776371302561 | 14.87 | 15.07 | 0.516 SE | 0.0513 NW | S | |
| SDSS J143243.04+301320.8 | 587739380987592822 | 14.52 | 16.16 | 0.0623 (NE) | |||
| SDSS J143243.90+301329.2 | 587739380987592820 | 14.52 | 16.16 | 0.0623 NE | Phi | ||
| SDSS J144230.35+222110.7 | 587739809952890969 | 14.51 | 15.54 | 0.0507 NE | X | VV 752 | |
| SDSS J144750.76+314553.3 | 587739132421799955 | 14.63 | 16.58 | 0.0557 NE | 0.0454 SW | SE z | IC 4508 |
| SDSS J145013.12+241919.0 | 587739720301871290 | 15.26 | 15.38 | 0.0329 NW | 0.0329 SE | S | |
| SDSS J161117.22+141531.5 | 587739845394366485 | 14.01 | 14.98 | 0.0329 N | E | ||
| SDSS J204719.06+001914.8 | 587731173842026987 | 12.37 | 12.63 | 0.0140 NW | 0.0127 SE | F | NGC 6962 |
| SDSS J220412.01-083836.0 | 587730816822411334 | 15.19 | 16.86 | 0.0640 S | 0.1353 N | E |
| Code | Description | Number |
|---|---|---|
| F | Face-on spiral and background E/S0 | 369 |
| Q | Background galaxy edge-on and radial | 237 |
| Foreground disk edge-on and background E/S0 | 156 | |
| X | Crossing edge-on disks | 200 |
| SE | Spiral/elliptical pairs not otherwise listed | 102 |
| S | Two spirals | 584 |
| B | Background galaxy has small angular size | 181 |
| E | Two E/S0 galaxies | 59 |
| R | Could also be polar ring | 6 |
| Redshifts indicate not physically associated | 218 |
| Coordinate designation | SDSS ObjID | Obj | Obj | Type | Nuc sep” | Cross-ID | ||
|---|---|---|---|---|---|---|---|---|
| SDSS J011128.81+261816.6 | 758877156282466365 | S | 4.3 | |||||
| SDSS J020149.25+001646.7 | 587731513147785324 | 0.0434 | R | |||||
| SDSS J072900.48+430402.7 | 587738066725896649 | 0.1885 | abs | 0.1827 | em | SE | 2.8 | |
| 103713.20-274104.0 | 0.0095 | fg | 0.0155 | bg | S | 2.9 | NGC 3314 | |
| SDSS J112917.08+353432.6 | 587739305286303747 | 0.0346 | NW | 0.0345 | SE | S | 5.8 | NGC 3695 |
| SDSS J113336.25+560030.9 | 587731889502748827 | 0.0609 | X | 1.2 | ||||
| SDSS J114512.95+350510.4 | 587739304213938297 | 0.0674 | S | 1.0 | ||||
| SDSS J125020.69+375656.1 | 587739098602733640 | 0.0351 | ctr | R | IC 3828 | |||
| SDSS J131206.27+461146.0 | 588298662503972874 | 0.0283 | N | F | 9.2 | NGC 5021 | ||
| SDSS J131940.07+274221.7 | 587741603111632925 | 0.0231 | R | |||||
| SDSS J133642.56+620337.3 | 588011219671908454 | 0.0311 | fg | 0.01037 | bg | S | 5.5 | |
| SDSS J134134.82+372625.7 | 588017977826345079 | 0.0628 | fg | 0.1713 | bg | S | 1.2 | |
| SDSS J135031.55+091704.1 | 587736542551802124 | 0.0653 | N | Q | 4.7 | |||
| SDSS J135239.37+010609.1 | 588848901535629486 | 0.0716 | R | |||||
| SDSS J150153.48+353239.5 | 587736586042212586 | 0.0496 | R | |||||
| SDSS J153322.82+332933.3 | 588017604701257882 | 0.0769 | fg | R | ” | |||
| SDSS J155929.99+094900.6 | 587742610274845009 | 0.0731 | fg | 0.1025 | bg | S | 5.2 | CGCG 079-018 |
| SDSS J160737.22+450355.2 | 588011101034774582 | 0.0441 | W | 0.0442 | E | S | 5.5 | |
| SDSS J162557.25+435743.5 | 587729753278578838 | 0.0320 | E | F | 10.1 | |||
| SDSS J162957.52+403750.5 | 587729652348223597 | 0.0300 | NW | 0.0289 | SE | F | 10.2 | NGC 6175 |
| SDSS J163451.17+481623.7 | 587725994646634705 | R | ||||||
| SDSS J231444.84+063821.3 | 587743958884286603 | S | 4.4 |
| Coordinate designation | obj | obj | Type | Cross-ID | Image | References | ||
|---|---|---|---|---|---|---|---|---|
| Outside SDSS coverage: | ||||||||
| 004821.85-250736.5 | 0.064 | fg | 0.065 | bg | S | 2MASX, in NGC 253 field | HST | Holwerda et al. 2009 |
| 022811.1 +193557 | 0.0138 | N | 0.0134 | S | S | NGC 935/IC1801; Arp 276 | 0.25m | |
| 032140.55-513934.2 | 0.058 | N | Q | ESO 0320-51, Fairall 299 | CTIO1.5 | WKC | ||
| 040409.75+220753.7 | 0.0212 | NW | 0.0212 | SE | X | UGC 2942/3 | CTIO1.5 | WKC |
| 043654.7 -021647.0 | 0.0325 | SE | B | Arp 61, UGC 3104 | SARA-N | |||
| 050033.90-620350.0 | 0.0281 | S | F | AM0500-620, ESO 119-IG27 | HST | WKC, KW2001a | ||
| 050146.70-180925.4 | 0.0133 | NW | 0.0130 | SE | S | NGC 1738/9 | CTIO1.5 | WKC, D2000 |
| 052234.4 -112958 | 0.0081 | SW | 0.0083 | NE | SE | NGC 1888/9 | WIYN | D2000 |
| 053546.5 -520832 | 0.0147 | Q | AM 0534-521 | CTIO 4m | Keel (1985) | |||
| 054844.25-253335.8 | 0.0370 | SW | 0.0413 | NE | S | ESO 488-IG29 | SARA-S | WKC, D2000 |
| 061622.03-212221.6 | 0.0091 | W | 0.0092 | E | S | NGC 2207/IC 2163 | SARA-S | Elmegreen et al. (2001), D2000 |
| 065054.41-352056.1 | 0.0345 | NE | 0.0333 | SW | S | AM 0649-351 | SARA-S | D2000 |
| 072151.8 +465038 | 0.0336 | Q | UGC 3810 | SARA-N | Keel (1985) | |||
| 092821.7 -361002 | AM 0926-355 | SARA-S | ||||||
| 103710.27-273927.2 | F | in NGC 3314 HST field | HST | |||||
| 103713.20-274104.0 | 0.0095 | fg | 0.0155 | bg | S | NGC 3314 | HST | Keel (1983), WKC, KW2001b |
| 131423.6 -460646.3 | 0.0104 | SE | 0.0103 | NW | S | AM1311-455 | CTIO1.5 | WKC |
| 131932.6 -242914 | 0.0346 | SE | 0.0320 | NW | F | AM 1316-241 | HST | WKC, KW2001a,D1999, WK92 |
| 132112.80-434216.4 | 0.0114 | E | 0.0118 | S | SE | NGC 5090/1, AM1318-432 | CTIO1.5 | D1999 |
| 132758.99-312912.4 | S | in Abell 3558 | HST | |||||
| 132801.02-314458.4 | Q | in Abell 3558 | HST | |||||
| 132802.02-314650.3 | S | in Abell 3558 | HST | |||||
| 183424.7 -582948 | 0.0075 | E | Q | IC 4721, AM1830-583 | CTIO1.5 | |||
| 222541.40-311202.0 | 0.0294 | B | 0.0281 | A | F | NGC 7268 | SARA-N | D2000 |
| 225756.90+260900.0 | 0.0245 | B | 0.0256 | A | NGC 7436 | WIYN | D2000 | |
| 235727.30-302737.0 | 0.0307 | fg | 0.0614 | bg | S | AM 2354-304 | CTIO | WKC, D2000 |
| Recovered within SDSS: | ||||||||
| SDSS J011530.44-005139.5 | 0.0059 | fg | 0.0381 | bg | S | NGC 450/UGC 807 | WKC Andredakis & van der Kruit (1992) | |
| SDSS J074409.12+291450.6 | 0.0158 | W | 0.0160 | E | S | UGC 3995 | WKC, Marziani et al. (1999), D2000 | |
| SDSS J105945.17+173901.6 | 0.0295 | W | 0.0294 | E | Q | Arp 198 | D2000 | |
| SDSS J123634.26+111419.9 | 0.0075 | E | 0.0075 | W | S | NGC 4567/8 | WKC | |
| SDSS J124332.49+113456.6 | 0.0037 | SE | 0.0047 | NW | F | NGC 4647/9 | WKC | |
| SDSS J132921.43+372450.4 | 0.0568 | N | 0.0569 | S | S | Arp 40, IC 4271 | WKC | |
| SDSS J141702.52+363417.7 | 0.0101 | W | 0.0103 | E | S | NGC 5544/5 | WKC, D1999 | |
| SDSS J172243.81+620957.8 | 0.0283 | S | 0.0268 | N | Q | Arp 30, NGC 6365 | D2000 | |
| SDSS J225505.54-002454.0 | 0.067 | SE | S | MCG-2-58-11 | D2000 | |||