Search for gamma-ray emission from four accreting millisecond pulsars with Fermi/LAT
Abstract
We report our search for -ray emission in the energy range from 100 MeV to 300 GeV from four Accreting Millisecond Pulsars (AMPs), SAX J1808.43658, IGR J002915934, XTE J1814338, and XTE J0929314. The data are from four-year observations carried out by Large Area Telescope (LAT) onboard the Fermi -ray Space Telescope. The AMPs were not detected, and their -ray luminosity upper limits we obtain are ergs s-1 for SAX J1808.43658, ergs s-1 for IGR J002915934, ergs s-1 for XTE J1814338, and ergs s-1 for XTE J0929314. We compare our results with -ray irradiation luminosities required for producing optical modulations seen from the companions in the AMPs, which has been suggested by Takata et al. (2012), and our upper limits have excluded -ray emission as the heating source in these systems except XTE J0929314, the upper limit of which is not deep enough. Our results also do not support the model proposed by Takata et al. (2012) that relatively strong -ray emission could arise from the outer gap of a high-mass neutron star controlled by the photon-photon pair-creation for the AMPs. Two AMPs, SAX J1808.43658 and IGR J002915934, have the measurements of their spin-down rates, and we derive the upper limits of their -ray conversion efficiencies, which are 57% and 3%, respectively. We discuss the implications to the AMP systems by comparing the efficiency upper limit values with that of 20 -ray millisecond pulsars (MSP) detected by Fermi and the newly discovered transitional MSP binary J1023+0038.
Subject headings:
pulsars: general – stars: neutron – binaries: close – gamma rays: stars1. Introduction
Accreting millisecond pulsars (AMPs) are all in low mass X-ray binary (LMXB) systems, spinning at frequencies more than 100 Hz and containing companion stars with masses less than (Patruno & Watts, 2012). The periodical pulsed emission from AMPs is accretion powered, which distinguishes them from normal radio millisecond pulsars (MSPs) that are powered by rotation. AMPs are believed to be the progenitors of MSPs spun up from old slowly rotating neutron stars (NSs) by the recycling scenario (Alpar et al., 1982; Bhattacharya & van den Heuvel, 1991; Srinivasan, 2010), that is when a NS in a binary system switches off the pulsed radio emission, the mass and angular momentum of the companion star are transferred to the NS through accretion, producing a recycled pulsar that eventually spins at a period of milliseconds. The currently known AMPs are all transient systems with recurrent times of years. Evolution of their accretion disks leads to weeks-long outbursts, during which pulsed X-ray emission is detected.
The first known AMP SAX J1808.43658 was found by the BeppoSAX mission in 1996 (in ’t Zand et al., 1998) and discovered to have pulsed X-ray emission with the Rossi X-ray Timing Explorer (RXTE) during its 1998 outburst (Wijnands & van der Klis, 1998; Chakrabarty & Morgan, 1998). Since then, over a dozen of AMP systems have been discovered (Patruno & Watts, 2012). One interesting property of AMP binaries was first pointed out by Burderi et al. (2003): because the orbital optical modulation seen in SAX J1808.43658 has a larger than expected amplitude in the quiescent state (Homer et al., 2001), the AMP probably switches to be rotation-powered and thus is able to provide the required energy output to heating of the companion. Followup observations of SAX J1808.43658 at X-ray and optical energies have firmly verified the inconsistency between the large optical modulation and low X-ray luminosity in quiescence (Campana et al., 2004; Deloye et al., 2008; Wang et al., 2009b). X-ray emission from accreting compact stars normally is the heating source to cause orbital optical modulations seen in LMXBs (e.g., van Paradijs & McClintock 1995). In addition, the inconsistency has also been seen in two other AMP systems, IGR J002915934 and XTE J1814338 (D’Avanzo et al., 2007; Jonker et al., 2008; D’Avanzo et al., 2009), which suggests a common property of being able to switch to be radio pulsars in quiescence for AMP systems, although no direct evidence has been found from radio observations of them (Burgay et al., 2003).
The more recent discovery of the millisecond pulsar binary PSR J10230038 (Archibald et al., 2009) has strengthened the likelihood of the radio-pulsar switching property of the AMP systems. The binary is considered to be the first system found at the end of its evolution from a LMXB to a MSP binary, as a short-term accretion disk was seen in it (Wang et al., 2009a, 2012). -ray emission from PSR J10230038 was also found from observations carried out by Fermi Gamma-ray Space Telescope (Tam et al., 2010). Considering PSR J10230038 as an end product of LMXB evolution closely related to AMP systems, Takata et al. (2012) studied possible -ray emission mechanisms for the AMP systems known with large-amplitude optical modulations (see Table 1). In their work, they attributed the optical modulations of the AMP systems to -ray irradiation of the companions, which required -ray luminosity ergs s-1. The predicted -ray emission is possibly detectable by Fermi, and any detection would provide strong evidence for the existence of radio pulsars in these AMP systems in quiescence. We thus searched for -ray emission from the four AMPs in the data obtained by Fermi and report our results in this paper. The general properties of the four AMPs are summarized in Table 1.
2. Observation and data analysis
LAT is an imaging instrument onboard the Fermi Gamma-ray Space Telescope. Its main objective is to conduct continuous -ray monitoring of a large sample of sources in energy range from 20 MeV to 300 GeV with much improved sensitivity compared with former -ray telescopes (Atwood et al., 2009). In our data analysis we selected LAT events within 15 degrees centered at the positions of the four AMPs during time period from the start of the releasing of Fermi public data 2008-08-04 15:43:36 (UTC) to 2012-07-08 18:59:57 (UTC) from the Fermi Pass 7 database. We included events in an energy range from 100 MeV to 300 GeV. Following recommendations of the LAT team, we required events zenith angle to be less than 100 degrees to prevent the Earth’s limb contamination, and excluded events in time intervals when spacecraft events affected the quality of the LAT data.
2.1. Maximum likelihood analysis
We rejected events below 200 MeV and included only events in energy range from 200 MeV to 300 GeV for the likelihood analysis, because the instrument response function of LAT has relative large uncertainties in lower energy range. We included all sources within 20 degrees centered at the four AMPs to make the source models based on the Fermi 2-year catalog. Most of them are point sources, while a few of them are diffuse sources. The spectral function forms of these sources were selected the same as those in the catalog. We let the spectral normalization parameters of sources within 3 degrees from the four AMPs free, and fixed all the other parameters of sources included in our source models to their catalog values. The four AMPs we are interested in were not included in the Fermi catalog. We modeled the -ray spectra of them with a exponentially cut-off power law which is the typical spectral form of pulsars (Abdo et al., 2009, 2010c). The exponentially cut-off power law can be expressed by , where is the spectral index and is the cut-off energy. In addition we considered the Galactic and extragalactic diffuse emission using the model gal_2yearp7v6_v0.fits and the spectrum file iso_p7v6source.txt, respectively. The value of the Galactic diffuse emission model and the normalization of the extragalactic diffuse emission model were let free.
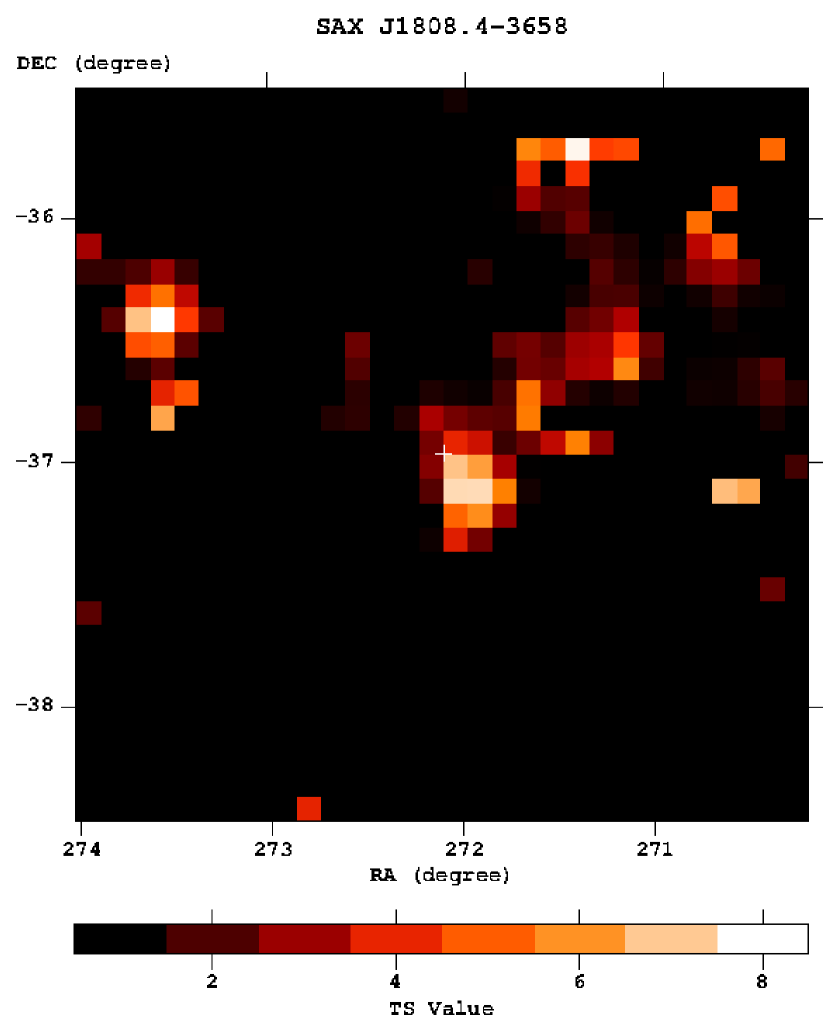
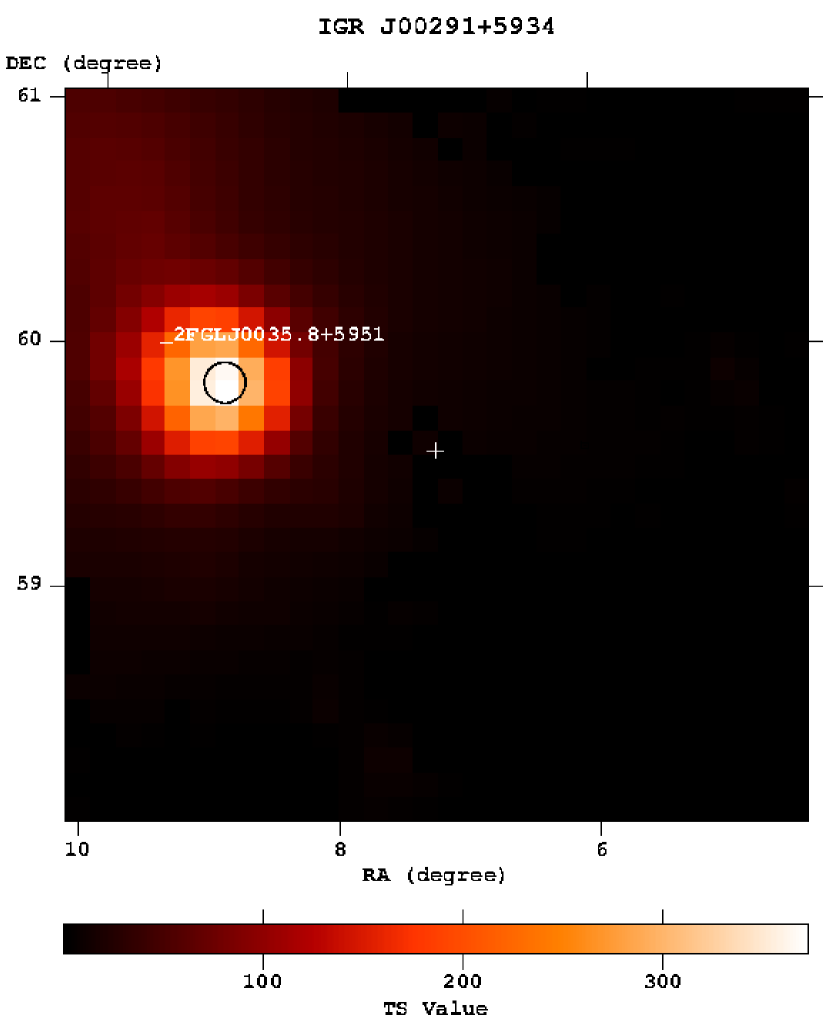
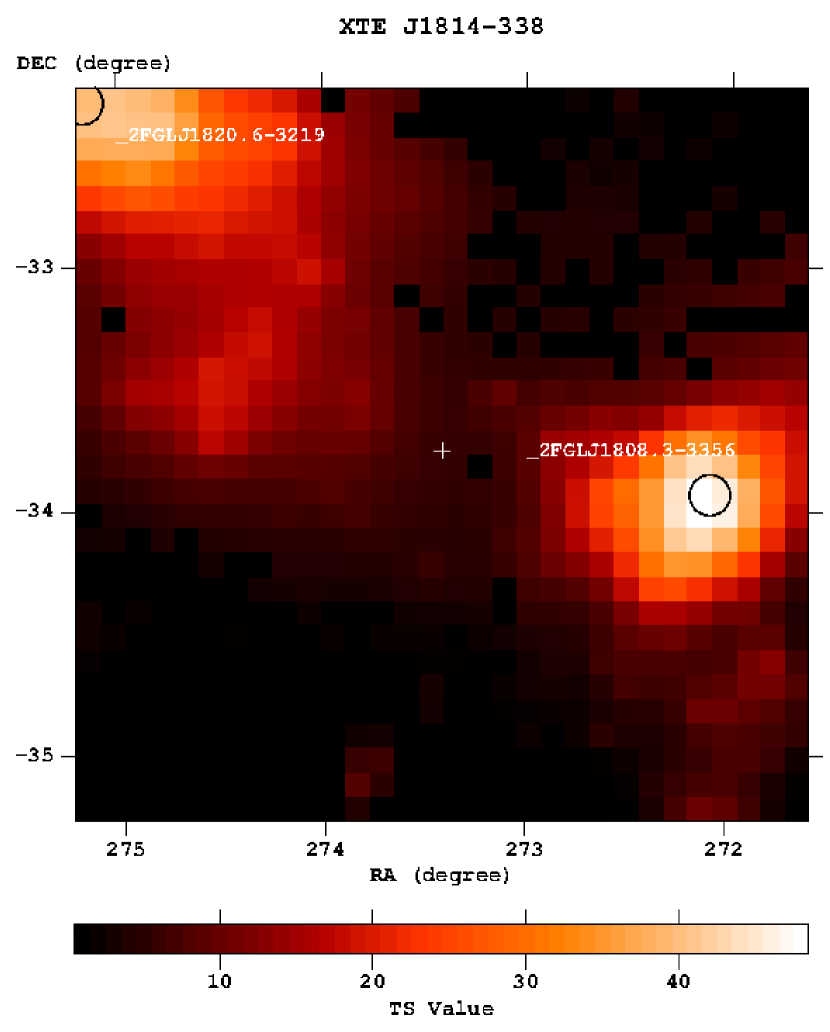
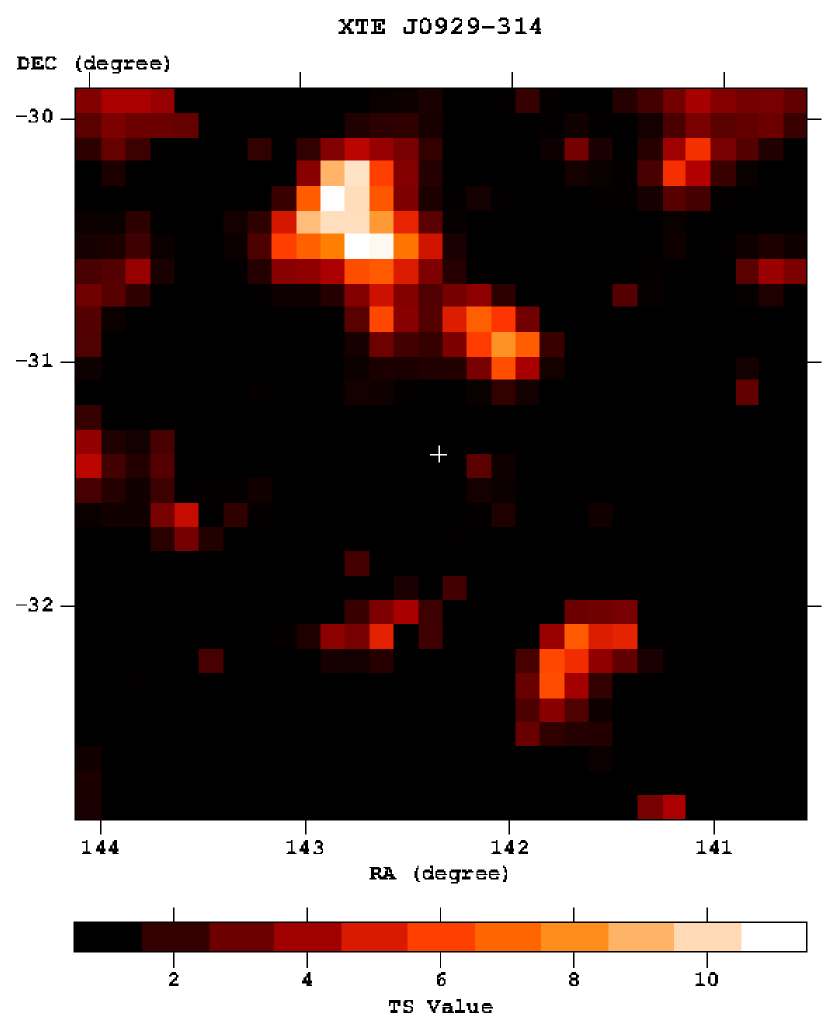
We performed standard binned likelihood analysis with the LAT science tools software package v9r27p1. The binned likelihood used events in a square region instead of a circle, so we selected events inside a region centered at each interested source, which is nearly the inscribed square of the circular region we selected above. We obtained the Test Statistic (TS) of the four AMPs, and the TS maps of regions centered at each of the four AMPs are shown in Figure 1. Each of the maps was extracted by assuming a putative source and performing binned likelihood analysis to obtain the TS value at each grid point of the regions. The sources in the source models outside of the regions, and the Galactic and extragalactic diffuse emission were considered. We found that IGR J002915934, XTE J1814338, and XTE J0929314 had TS values of 0, and SAX J1808.43658 had a TS value of 3. A TS value is approxmiately the square of the detection significance of a source and it can be used to assess whether a source exists or not. Actually in the Fermi source catalog only sources with TS values greater than 25 were included, which corresponds to the detection significance of 4.6 (Abdo et al., 2010b). The TS values of the four AMPs thus indicate that they were not detected by Fermi/LAT in 200 MeV 300 GeV band.
2.2. Flux Upper limit Calculation
The -ray flux upper limits of these four AMPs were estimated by the binned likelihood analysis with the source models we described above. We fixed the and parameters of the spectral models of the four AMPs to 1.4 and 1.6 GeV respectively, which are the averaged spectral parameters of the eight MSPs Fermi detected during the first six months monitoring (Abdo et al., 2009, 2010c) and derived from the Fermi 2-year catalog (see Table 2). The spectral normalization factors were let free. We extracted the upper limits of normalization factors by increasing these factors until the maximum likelihood values decreased by e/2 in logarithm, following the procedure introduced by the LAT team. Then using the upper limits of normalization factors we derived the 95 flux upper limits in energy range from 100 MeV to 300 GeV by integrating the spectral models. Assuming isotropic -ray emission, the upper limits of the -ray luminosities of these four sources were calculated, where the distance values of the sources listed in Table 1 were used.
2.3. Timing analysis
We performed timing analysis of the Fermi/LAT observations of the four AMPs to search for any -ray pulsations. We included events in energy range from 100 MeV to 300 GeV within 1 degree centered at the positions of these four sources, and folded them into 20 phase bins using X-ray ephemerides (Table 1). The frequency derivatives were considered for the sources with the measurements of their spin-down rates. We obtained the folded light curves of these sources (Figure 2) and made test and H test to identify possible presence of -ray pulsations. The four folded light curves have values in the range of 1128 which are comparable to the 19 degrees of freedom (Larsson, 1996), and H values in the range of 0.410.8 which are significantly smaller than the value (H42) used by the LAT team to comfirm -ray pulsations (Abdo et al., 2010c), thereby indicating no significant -ray pulsations from these four AMPs were detected. In addition, since our targets are all located in the Galactic plane, contamination from diffuse emission and nearby sources may prevent the detections of -ray pulsations. We thus tested to decrease the radii of the target regions from 1 degree to 0.5 degree to search for -ray pulsations. However no significant -ray pulsations were detected either with values of 732 (19 degrees of freedom) and H values of 0.19.3.
For SAX J1808.43658 and IGR J002915934, which had X-ray outbursts after August 2008 under the Fermi coverage, we also searched their -ray pulsations during the outbursts. SAX J1808.43658 had the X-ray outbursts in 2008 starting at MJD 54730 with of and of Hz s-1 (Hartman et al., 2009), and in 2011 starting at MJD 55865 with of and non-significant of Hz s-1 (Patruno et al., 2012). IGR J002915934 had two X-ray outbursts in 2008 starting at MJD 54691 and MJD 54727 (Lewis et al., 2010). X-ray observations in MJD 54691.94–54696.77 revealed of and of Hz s-1, and in MJD 54730.51–54742.89 revealed of and of Hz s-1 (Patruno, 2010). We searched -ray pulsations of SAX J1808.43658 during MJD 54735–54760 and MJD 55870–55886, and of IGR J002915934 during the X-ray observations of its two outbursts, using their spin parameters given above. No detections of -ray pulsations were found from these two sources.
2.4. Analysis of the Data in the Quiescent State
The data used in our analyses in § 2.1 and § 2.2 were nearly four years from 2008–2012. As given in § 2.3, during the time period SAX J1808.43658 had two X-ray outbursts and IGR J002915934 had two close X-ray outbursts. According to the current models for the -ray emission mechanism for pulsars (see discussion in § 4), accretion of the MSPs in these two binaries in the outbursts should have quenched -ray emission from their magnetospheres. Although the durations of the outbursts were short compared to the 4-year length of the total data, we checked whether our non-detections of the two sources and upper limit calculations would be significantly affected. The outburst state of the two sources lasted about 20–50 days (Hartman et al., 2009; Patruno et al., 2012; Lewis et al., 2010), and optical observations showed the brightening of the accretion disks started several tens of days before the outbursts (Wang et al., 2013; Lewis et al., 2010). We excluded Fermi/LAT data from 10 days prior to and 50 days after the starting of each outburst and performed likelihood analysis using the data only in the quiescent state given in Table 1. With the same event selections and source models, the TS values we obtained in quiescent state are 3 for SAX J1808.43658 and 0 for IGR J002915934, and the -ray luminosity upper limits are ergs s-1 for SAX J1808.43658 and ergs s-1 for IGR J002915934, which are nearly the same as that we obtained using the total data sets.
3. Results
We found that the four AMPs included in our work were not detected by Fermi/LAT at -ray energies. We obtained upper limits of their -ray luminosities, that are ergs s-1 for SAX J1808.43658, ergs s-1 for IGR J002915934, ergs s-1 for XTE J1814338, and ergs s-1 for XTE J0929314, where is the source distance with its subscript indicating the value (in units of kpc; Table 1) used. These results are summarized in Table 1. Two AMPs—SAX J1808.43658 and IGR J002915934—have measurements of their spin-down rates (Table 1), through which we estimated the spin-down luminosities by , where is the NS moment of inertia and assumed to have a canonical value of g cm2. We calculated the upper limit of -ray conversion efficiency for these two sources with the upper limits of -ray luminosities we obtained above. SAX J1808.43658 has of 0.57, and IGR J002915934 has of 0.03. The latter provides a strong constraint on the -ray emission from this source.
4. Discussion
We searched -ray emission from four AMPs, SAX J1808.43658, IGR J002915934, XTE J1814338, and XTE J0929314 with Fermi/LAT observations. The four sources were not detected by Fermi/LAT in the 200 MeV to 300 GeV energy range. We obtained the 100 MeV to 300 GeV -ray luminosity upper limits of these four sources. In addition for two of them, SAX J1808.43658 and IGR J002915934, with the measurements of the spin-down rates, we estimated the 100 MeV to 300 GeV -ray conversion efficiency upper limits. The obtained values of these sources can be used to compare with model predictions of AMPs and conversion efficiencies of -ray MSPs, which provides constraints on their properties including -ray emission mechanisms.
Depending on different assumptions, a wide range of values for the four AMPs have been predicted by Takata et al. (2012). Futhermore they have suggested that optical modulations seen in the AMP binaries could be caused by -ray irradiation of the companion stars. The irradiation -ray luminosities of these sources required for optical modulations were used to constrain the theoretical emission models. For SAX J1808.43658, IGR J002915934 and XTE J1814338, the inferred -ray irradiation luminosities of ergs s-1 favored the outer gap model with a high-mass NS controlled by the photon-photon pair-creation between -rays and X-rays from full surface cooling emission, or the outer gap model controlled by the magnetic pair-creation process (Takata et al., 2012). Such a high luminosity can not be produced by the outer gap model controlled by the photon-photon pair-creation between -rays and X-rays from the heated polar cap because an unreasonably high NS magnetic field is required. For XTE J0929314 with a lower inferred -ray irradiation luminosity of ergs s-1, the outer gap model with a low-mass NS controlled by the photon-photon pair-creation between -rays and X-rays from full surface cooling emission might be prefered (Takata et al., 2012).
In our work, we found that the -ray luminosities of SAX J1808.43658 and IGR J002915934 observed by Fermi/LAT had the upper limits of ergs s-1 and ergs s-1 respectively, which are significantly lower than the required -ray irradiation luminosities of these two sources. For XTE J1814338 and XTE J0929314, the -ray luminosity upper limits of ergs s-1 and ergs s-1 are consistent with the required -ray irradiation luminosities. However for XTE J1814338, the -ray irradiation luminosity lower limit given by Takata et al. (2012) is nearly equal to the luminosity upper limit we obtained. Considering the actual luminosities of these AMPs might be significantly smaller than the upper limits, the Fermi observations of these sources indicate that the -ray emission of three AMPs, SAX J1808.43658, IGR J002915934, and XTE J1814338, are lower than the values needed to interpret the optical modulations. Thus -ray irradiation from the AMPs should not be the main heating source of their companions. The irradiation from release of the rotational energy of the pulsars should be prefered, which indeed provide the required energy output of ergs s-1 to heat the companions (Burderi et al. 2003, Table 1), although there are a few unresolved theoretical uncertainties in this model (Burderi et al., 2003; Takata et al., 2012).
-ray emission from pulsars is generally agreed to originate from accelerations of charged particles, while it is still uncertain where the accelerations occur. At present there are polar cap, outer gap, and slot gap models to be advanced to interpret the high energy emission of pulsars. The polar cap model (Ruderman & Sutherland, 1975) has acceleration regions near the surface of a NS, which predicts pulsed emission aligned with the magnetic poles. The model fails to interpret the -ray pulsed profiles of pulsars because most of pulsars have two sharp peaks which are not aligned with radio peaks (Abdo et al., 2009, 2010c). The outer gap (Muslimov & Harding, 2004) and slot gap models (Cheng et al., 1986) have acceleration regions along the last open field lines to near the light cylinder, starting from the null surface and the polar cap, respectively. The two models both predict to have wide-fan beams which are not aligned with magnetic poles so that they are more prefered to interpret -ray emission from pulsars. Comparing with that on the basis of the outer gap model predicted by Takata et al. (2012), our results basically rule out their model of a high-mass NS controlled by the photon-photon pair-creation between -rays and X-rays from full surface cooling emission for SAX J1808.43658, IGR J002915934 and XTE J1814338. For XTE J0929314, the outer gap emission with a low-mass NS is predicted and our results is still consistent with their model prediction.
The newly born MSP PSR J10230038 from an LMXB system has been detected by Fermi/LAT with a detection significance of 7 in the 200 MeV to 20 GeV band (Tam et al., 2010), which greatly motivated our search for -ray emission from the AMPs to verify the possible existence of rotation-powered pulsars in the quiescent state. However, although many -ray MSPs have been detected by Fermi/LAT (Abdo et al., 2009, 2010c), no -ray AMPs have been found. In our work we gave the upper limits of 100 MeV to 300 GeV for two AMPs, that are 57 for SAX J1808.43658 and 3 for IGR J002915934. We compared them with MSPs detected by Fermi/LAT. In the Fermi 2-year catalog there are 38 possible -ray MSPs, among which 20 are confirmed MSPs that have typical spectral form of pulsars (exponentially cut-off power law) and pulsations detected in -ray band. A summary of these 20 MSPs is given in Table 2. We calculated the 100 MeV to 100 GeV of these MSPs with flux values given in the catalog and timing parameters listed in Table 2. These sources’ are plotted in Figure 3, with uncertainties derived from flux uncertainties given in the catalog. In addition the uncertainties related to distance measurements are approximately 60 presuming 30 distance uncertainties. As can be seen, the -ray conversion efficiency of 3 of IGR J002915934 lies in the very lower range of that of -ray MSPs. This upper limit is a strict constraint on the -ray emission of IGR J002915934, which likely suggests that this source may not emit in -ray band, or its -ray beam, at least the bright portion of its -ray beam, may not cross the earth. For SAX J1808.43658, its -ray conversion efficiency is 57, which is not sufficiently low suggesting this source as a candidate -ray source for further monitoring with longer observation time.
It can be noted that PSR J10230038 has been detected with the lowest conversion efficiency of 0.5 in 100 MeV band (Figure 3; derived from spectral parameters given in Tam et al. 2010). This may suggest that -ray emission of MSPs is related to their evolutionary stage. The fast rotating AMPs may have almost no -ray emission, but at the end of the accreting phase the newly born MSPs begin to emit in -ray band with low -ray conversion efficiencies. We have also searched for pulsed emission from J1023+0038 in the Fermi data from 2008 to the present time (data in Tam et al. 2010 were to 2010 July), but have not found any detection. Comparisons of the properties of its -ray pulsed emission with that of its radio emission may have implications to what are expected from AMPs. In addition, we note that no -ray MSPs are located in the low-right corner of Figure 3. We may approximately define a ‘death line’, where is the characteristic age in units of 109 yrs, by making all -ray MSPs above the line. Comparing to a theoretical death line, for example , which was recently derived by Wang & Hirotani (2011) for -ray MSPs on the basis of the outer gap model, the line is nearly straight in Figure 3 if a constant is considered (dotted line; ergs s-1 is used to draw the line). Takata et al. (2012) found that ergs s-1 fits luminosities of -ray MSPs relatively well [derived from the outer gap model controlled by magnetic pair-creation; cf. Eq. (32)], which implies that is generally inversely proportional to [note or when the death line of is used]. The line we define instead suggests that older detectable MSPs tend to have higher . If this is a true feature, SAX J1808.43658 would have no -ray emission detectable because its conversion efficiency upper limit is very close to the line. Hopefully with more MSPs detected by Fermi in the near future, whether this line exists or not can be verified.
Finally the complex regions near the Galactic plane, in which the four AMPs are located, certainly affects the -ray detections and the upper limit evaluations of them. As can be seen from the TS maps (Figure 1), while the Galactic diffuse emission was removed from the source regions at a satisfactory level, there is excess in these regions in addition to those corresponding to the nearby -ray sources in the catalog, particularly for SAX J1808.43658. The TS excess near the location of SAX J1808.43658 is not sufficiently strong for the -ray detection of this source due to the low TS value. On the other hand if we consider the TS excess as indications of other possible weak sources, the luminosity upper limit of the source should be slightly lower than that we have obtained. It is also worth noting that our likelihood analysis of -ray emission from the four AMPs have uncertainties including that from the LAT instrument response function, Galactic diffuse emission, and nearby sources’ emission. Data of longer monitoring by Fermi/LAT will help reduce the uncertainties and thus provide tighter constraints on the emission properties of the AMPs.
References
- Abdo et al. (2009) Abdo, A. A., Ackermann, M., Ajello, M., et al. 2009, Science, 325, 848
- Abdo et al. (2010a) —. 2010a, ApJ, 712, 957
- Abdo et al. (2010b) —. 2010b, ApJS, 188, 405
- Abdo et al. (2010c) —. 2010c, ApJS, 187, 460
- Alpar et al. (1982) Alpar, M. A., Cheng, A. F., Ruderman, M. A., & Shaham, J. 1982, Nature, 300, 728
- Archibald et al. (2009) Archibald, A. M., et al. 2009, Science, 324, 1411
- Atwood et al. (2009) Atwood, W. B., Abdo, A. A., Ackermann, M., et al. 2009, ApJ, 697, 1071
- Bhattacharya & van den Heuvel (1991) Bhattacharya, D., & van den Heuvel, E. P. J. 1991, Phys. Rep., 203, 1
- Burderi et al. (2003) Burderi, L., Di Salvo, T., D’Antona, F., Robba, N. R., & Testa, V. 2003, A&A, 404, L43
- Burgay et al. (2003) Burgay, M., et al. 2003, ApJ, 589, 902
- Campana et al. (2004) Campana, S., et al. 2004, ApJ, 614, L49
- Chakrabarty & Morgan (1998) Chakrabarty, D., & Morgan, E. H. 1998, Nature, 394, 346
- Cheng et al. (1986) Cheng, K. S., Ho, C., & Ruderman, M. 1986, ApJ, 300, 500
- Cognard et al. (2011) Cognard, I., Guillemot, L., Johnson, T. J., et al. 2011, ApJ, 732, 47
- D’Avanzo et al. (2009) D’Avanzo, P., Campana, S., Casares, J., et al. 2009, A&A, 508, 297
- D’Avanzo et al. (2007) D’Avanzo, P., Campana, S., Covino, S., et al. 2007, A&A, 472, 881
- Deloye et al. (2008) Deloye, C. J., Heinke, C. O., Taam, R. E., & Jonker, P. G. 2008, MNRAS, 391, 1619
- Falanga et al. (2005) Falanga, M., Kuiper, L., Poutanen, J., et al. 2005, A&A, 444, 15
- Freire et al. (2011) Freire, P. C. C., Abdo, A. A., Ajello, M., et al. 2011, Science, 334, 1107
- Galloway (2006) Galloway, D. K. 2006, in American Institute of Physics Conference Series, Vol. 840, The Transient Milky Way: A Perspective for MIRAX, ed. F. D’Amico, J. Braga, & R. E. Rothschild, 50–54
- Galloway et al. (2002) Galloway, D. K., Chakrabarty, D., Morgan, E. H., & Remillard, R. A. 2002, ApJ, 576, L137
- Guillemot et al. (2012a) Guillemot, L., Freire, P. C. C., Cognard, I., et al. 2012a, MNRAS, 422, 1294
- Guillemot et al. (2012b) Guillemot, L., Johnson, T. J., Venter, C., et al. 2012b, ApJ, 744, 33
- Hartman et al. (2009) Hartman, J. M., Patruno, A., Chakrabarty, D., et al. 2009, ApJ, 702, 1673
- Homer et al. (2001) Homer, L., Charles, P. A., Chakrabarty, D., & van Zyl, L. 2001, MNRAS, 325, 1471
- Iacolina et al. (2009) Iacolina, M. N., Burgay, M., Burderi, L., Possenti, A., & di Salvo, T. 2009, A&A, 497, 445
- in ’t Zand et al. (1998) in ’t Zand, J. J. M., Heise, J., Muller, J. M., et al. 1998, A&A, 331, L25
- Jonker et al. (2008) Jonker, P. G., Torres, M. A. P., & Steeghs, D. 2008, ApJ, 680, 615
- Keith et al. (2011) Keith, M. J., Johnston, S., Ray, P. S., et al. 2011, MNRAS, 414, 1292
- Kerr et al. (2012) Kerr, M., Camilo, F., Johnson, T. J., et al. 2012, ApJ, 748, L2
- Larsson (1996) Larsson, S. 1996, A&AS, 117, 197
- Lewis et al. (2010) Lewis, F., Russell, D. M., Jonker, P. G., et al. 2010, A&A, 517, A72
- Muslimov & Harding (2004) Muslimov, A. G., & Harding, A. K. 2004, ApJ, 606, 1143
- Pallanca et al. (2012) Pallanca, C., Mignani, R. P., Dalessandro, E., et al. 2012, ApJ, 755, 180
- Papitto et al. (2007) Papitto, A., di Salvo, T., Burderi, L., et al. 2007, MNRAS, 375, 971
- Patruno (2010) Patruno, A. 2010, ApJ, 722, 909
- Patruno et al. (2012) Patruno, A., Bult, P., Gopakumar, A., et al. 2012, ApJ, 746, L27
- Patruno & Watts (2012) Patruno, A., & Watts, A. L. 2012, ArXiv e-prints
- Ransom et al. (2011) Ransom, S. M., Ray, P. S., Camilo, F., et al. 2011, ApJ, 727, L16
- Ruderman & Sutherland (1975) Ruderman, M. A., & Sutherland, P. G. 1975, ApJ, 196, 51
- Srinivasan (2010) Srinivasan, G. 2010, New A Rev, 54, 93
- Strohmayer et al. (2003) Strohmayer, T. E., Markwardt, C. B., Swank, J. H., & in’t Zand, J. 2003, ApJ, 596, L67
- Takata et al. (2012) Takata, J., Cheng, K. S., & Taam, R. E. 2012, ApJ, 745, 100
- Tam et al. (2010) Tam, P. H. T., Hui, C. Y., Huang, R. H. H., et al. 2010, ApJ, 724, L207
- van Paradijs & McClintock (1995) van Paradijs, J., & McClintock, J. E. 1995, Optical and Ultraviolet Observations of X-ray Binaries (X-ray Binaries, eds. W.H.G. Lewin, J. van Paradijs, and E.P.J. van den Heuvel, Cambridge: Cambridge Univ. Press), 58
- Wang et al. (2009a) Wang, Z., Archibald, A. M., Thorstensen, J. R., et al. 2009a, ApJ, 703, 2017
- Wang et al. (2009b) Wang, Z., Bassa, C., Cumming, A., & Kaspi, V. M. 2009b, ApJ, 694, 1115
- Wang et al. (2013) Wang, Z., Breton, R. P., Heinke, C. O., Deloye, C. J., & Zhong, J. 2013, ApJ, 765, 151
- Wang & Hirotani (2011) Wang, R.-B., & Hirotani, K. 2011, ApJ, 736, 127
- Wang et al. (2012) Wang, X., Wang, Z., & Morrell, N. 2012, ArXiv e-prints
- Wijnands & van der Klis (1998) Wijnands, R., & van der Klis, M. 1998, Nature, 394, 344
| Source name | Quiescence | |||||||
|---|---|---|---|---|---|---|---|---|
| (kpc) | () | ( Hz s-1) | ( ergs s-1) | (109 yrs) | (MJD) | ( ergs s-1) | ||
| SAX J1808.43658 | 3.5a | 400.97521024f | -0.55f | 9 | 11.56 | 5468254720 | 5.1 | 0.57 |
| 5478055855 | ||||||||
| 5591556116 | ||||||||
| IGR J002915934 | 5b | 598.89213061g | -3.0g | 70 | 3.17 | 5477756116 | 2.1 | 0.03 |
| XTE J1814338 | 8c | 314.35610879h | – | – | – | – | 12 | – |
| XTE J0929314 | 6d,e | 185.105259i | – | – | – | – | 2.2 | – |
Note. — Column 5 are the spin-down luminosities of the sources with spin-down rate measurements. Column 6 lists the characteristic ages derived by . Column 7 lists the epoch of quiescent state defined in this paper. Column 8 lists the 100 MeV to 300 GeV -ray luminosity upper limits resulting from binned likelihood analysis of the LAT data with and of the spectral models of these sources fixed to 1.4 and 1.6 GeV. Column 9 are the 100 MeV to 300 GeV -ray conversion efficiency upper limits for the sources with measurements of spin-down rates. a: Galloway 2006. b: Falanga et al. 2005. c: Strohmayer et al. 2003. d: Galloway et al. 2002. e: Iacolina et al. 2009. f: The epoch time is MJD 52499.9602472 (Hartman et al., 2009). g: The epoch time is MJD 54692.0 (Patruno, 2010). h: The epoch time is MJD 52797.27387859868 (Papitto et al., 2007). i: The epoch time is MJD 52405.48676 (Iacolina et al., 2009).
| Source Name | d | ||||||
|---|---|---|---|---|---|---|---|
| (kpc) | (Hz) | ( Hz s-1) | ( ergs s-1) | (109 yrs) | ( ergs s-1) | ||
| J00300451∗ | 0.3a | 205.3b | -0.4b | 3 | 7.72 | ||
| J00340534 | 0.5c | 531.9c | -1.4c | 30 | 5.96 | ||
| J01016422 | 0.6d | 389.1d | -0.8d | 12 | 7.84 | ||
| J02184232∗ | 2.7a | 431.0b | -14.3b | 243 | 0.48 | ||
| J04374715∗ | 0.2a | 173.6b | -0.4b | 3 | 6.52 | ||
| J06102100 | 3.5e | 263.2e | -0.9e | 9 | 4.88 | ||
| J06130200∗ | 0.5a | 326.8b | -1.0b | 12 | 5.39 | ||
| J06143329 | 1.9f | 317.5f | -1.8f | 22 | 2.85 | ||
| J07511807∗ | 0.6a | 287.4b | -0.5b | 6 | 9.20 | ||
| J12311411 | 0.4f | 271.7f | -1.7f | 18 | 2.56 | ||
| J16142230∗ | 1.3a | 317.5b | -0.4b | 5 | 12.49 | ||
| J17441134∗ | 0.5a | 245.7b | -0.4b | 4 | 9.22 | ||
| J18233021A | 8.4g | 183.8g | -114.2g | 829 | 0.03 | ||
| J19592048 | 2.5h | 625.0h | -6.6h | 163 | 1.50 | ||
| J20170603 | 1.6i | 344.8i | -1.0i | 13 | 5.54 | ||
| J20431710 | 1.8j | 420.2j | -0.9j | 15 | 7.20 | ||
| J21243358∗ | 0.3a | 202.8b | -0.5b | 4 | 6.51 | ||
| J22143000 | 1.5f | 320.5f | -1.4f | 18 | 3.53 | ||
| J22415236 | 0.5k | 457.3k | -1.4k | 25 | 5.19 | ||
| J23024442 | 1.2i | 192.7i | -0.5i | 4 | 6.19 |
Note. — Observational properties of the 20 confirmed -ray MSPs in Fermi 2-year catalog. The sources marked with are the first eight -ray MSPs detected by Fermi/LAT. Column 2 lists the distance of each source. Columns 3 and 4 list the frequency and spin-down rate of each source. Column 5 lists the spin-down luminosities of sources. Column 6 lists the characteristic ages derived by . Column 7 lists the 100 MeV 100 GeV -ray luminosities derived from catalog. Column 8 lists the 100 MeV 100 GeV -ray conversion efficiencies. The uncertainties of luminosities and efficiencies are derived from flux uncertainties, the distance uncertainties are not considered here. a: Abdo et al. 2009. b: Abdo et al. 2010c. c: Abdo et al. 2010a. d: Kerr et al. 2012. e: Pallanca et al. 2012. f: Ransom et al. 2011. g: Freire et al. 2011. h: Guillemot et al. 2012b. i: Cognard et al. 2011. j: Guillemot et al. 2012a. k: Keith et al. 2011.