The Molecular Gas Density in Galaxy Centers and How It Connects to Bulges
Abstract
In this paper we present gas density, star formation rate, stellar masses, and bulge disk decompositions for a sample of 60 galaxies. Our sample is the combined sample of BIMA SONG, CARMA STING, and PdBI NUGA surveys. We study the effect of using CO-to-H2 conversion factors that depend on the CO surface brightness, and also that of correcting star formation rates for diffuse emission from old stellar populations. We estimate that star formation rates in bulges are typically lower by 20% when correcting for diffuse emission. Using the surface brightness dependent conversion factor, we find that over half of the galaxies in our sample have M⊙ pc-2. Though our sample is not complete in any sense, our results are enough to rule out the assumption that bulges are uniformly gas poor systems. We find a trend between gas density of bulges and bulge Sérsic index; bulges with lower Sérsic index have higher gas density. Those bulges with low Sérsic index (pseudobulges) have gas fractions that are similar to that of disks. Conversely the typical molecular gas fraction in classical bulges is more similar to that of an elliptical galaxy. We also find that there is a strong correlation between bulges with the highest gas surface density and the galaxy being barred. However, we also find that classical bulges with low gas surface density can be barred as well. Our results suggest that understanding the connection between the central surface density of gas in disk galaxies and the presence of bars should also take into account the total gas content of the galaxy. Finally, we show that when using the corrected star formation rates and gas densities, the correlation between star formation rate surface density and gas surface density of bulges is similar to that of disks. This implies that at the scale of the bulges the timescale for converting gas into stars is comparable to those results found in disks.
Subject headings:
galaxies: bulges — galaxies: formation — galaxies: evolution — galaxies: structure — galaxies: fundamental parameters, ,
1. Introduction
The stellar populations and gas densities in the centers of nearby bulge-disk galaxies is not uniformly old and non-star forming. Results from millimeter wave interferometers show that the centers of many bulge-disk galaxies are gas rich (see for example Regan et al., 2001; Helfer et al., 2003). Similarly, results from Spitzer and GALEX show that star formation rate densities of many bulges are high and star formation is significant compared to the bulge stellar mass (Fisher, 2006; Fisher et al., 2009). Also, results from stellar populations show that many bulges are young and growing (Peletier & Balcells, 1996; Ganda et al., 2007; MacArthur et al., 2009). We now understand that there is a great variety in the radial distribution of molecular gas in bulge-disk galaxies.
In the main bodies of disks, total gas density profiles are very well described by exponential decay (Young et al., 1995; Schruba et al., 2011; Bigiel & Blitz, 2012). However, for radii smaller than 25% of the optical radius there is a very large amount of scatter from galaxy-to-galaxy. Regan et al. (2001) shows that the gas density in galaxy centers frequently breaks from the exponential disk, and often increases in density similar to star light. These small regions in the centers of disks are the same location as bulges in the stellar light profiles. Other than the special case of outflows, the gas in the centers of bulge-disk galaxies is likely in a thin layer that is only a few hundred parsecs in thickness (e.g. García-Burillo et al., 1999). However, typical bulge-disk decompositions do not consider the thickness of the bulge-component, only the surface density of stars. Therefore, the gas in the centers of disks that is higher in surface density than the exponential profile is likely making stars that are, from the point-of-view of bulge-disk decompositions, in the “bulge.” However, in this case the “bulge” is not a 3-dimensional spheroid at the center of a galaxy disk, rather in this paper we adopt the definition of “bulge” to be the centrally located high surface-density component of a galaxy surface brightness profile, in excess over the inward extrapolation of an exponential disk. This definition of bulge is clearly observationally motivated.
Bulges are heterogeneous in more ways than just the star formation. Once thought to be uniformly similar to elliptical galaxies, observations of bulge dynamics, stellar populations structure and morphology, now show that there are at least two categories of bulges (respectively Kormendy, 1993; Peletier & Balcells, 1996; Carollo et al., 1997; Fisher & Drory, 2010, also see Kormendy & Kennicutt, 2004 for a review). This dichotomy of bulge properties can be summarized as follows: some bulges have properties similar to disk galaxies, and other bulges have properties similar to elliptical galaxies. Those bulges with properties similar to disks are called “pseudobulges” and those with properties similar to elliptical galaxies are referred to as “classical bulges”. Note that as used in this paper the terms pseudobulge and classical bulge are observationally based, and do not make any a priori assumption about the formation mechanism. Also note, that in this paper the word “bulge” refers to the bulge in surface brightness profiles of non-edge on galaxies.
This dichotomy is not a sequence in bulge-to-total ratio; at a constant bulge-to-total ratio bulges separate into two classes, even at small bulge-to-total ratios (Drory & Fisher, 2007). Also, it appears to be consistent within different means of identifying pseudobulges and classical bulges. For example, bulges with higher 3.6-8.0 m colors, indicative of higher specific star formation rates, have lower Sérsic index (Fisher & Drory, 2010). Also bulges with low velocity dispersion are more likely to be identified as pseudobulges (Fabricius et al., 2012). In this paper, we wish to directly compare molecular gas density to pseudobulge diagnostics, like Sérsic index.
A number of simulations show that barred gravitational potentials lead to central concentrations of gas in simulated disk galaxies (e.g. Simkin et al., 1980; Combes & Gerin, 1985; Heller et al., 2007). In principle, the bar torques the gas, this torque facilitates an exchange of angular momentum (García-Burillo et al., 2005). Inside of corotation a common, but not universal, reponse to bar torques is a angular monentum loss, and thus the gas falls to smaller radius. Athanassoula (1992) shows with hydrodynamical models that indeed bars are capable of driving significant masses of gas; this occurs due to shocks on the leading edges of bars that efficiently drive inward flows of gas. Regan et al. (1997) show that the motion of gas in bars is consistent with that of shocks predicted in the simulations of Athanassoula (1992), and the net effect is inflow in the central parts of a barred disk galaxy. Detailed studies of individual galaxies have shown that torques introduced by bars in disk galaxies are likely responsible for inward flowing gas, however the flow of gas in galaxies is often complicated by the details of the disk García-Burillo et al. (2005); Hunt et al. (2008); Haan et al. (2009). These studies show that bars can drive gaseous inflows; typical rates of inflow are of order 0.1-10 . Several studies find a high-scatter correlation between the presence of a bar and high densities of gas in the central kiloparsec of disks (Sakamoto et al., 1999; Jogee et al., 2005; Sheth et al., 2005). Similarly, barred disks are more likely to have bluer (younger) bulges (Gadotti & dos Anjos, 2001), and are star forming Fisher (2006); Wang et al. (2012); Oh et al. (2012).
The scatter in the bar-central gas density correlation is large enough to suggest that simply dividing galaxies into barred vs. unbarred is an oversimplification. A number of factors could be adding to the dispersion between the correlation of bars and central gas density. Simulations show that bars can dissolve (e.g. Friedli, 1999; Shen & Sellwood, 2004). Also, spirals can similarly torque gas (Zhang, 1999). Accretion or weak interactions with neighboring galaxies could drive central concentrations of gas (Combes et al., 1994; Espada et al., 2010). Indeed, Bournaud & Combes (2002) show that bar driven “secular” evolution and evolution driven through accretion/merging is not mutually exclusive .
Thus far, arguments that high gas densities in bulges are increasing the stellar bulge-to-total ratio of galaxies (e.g. Fisher et al., 2009) are built on the assumption that star formation in bulges is the same as in spiral arms of disks. Bolatto et al. (2008) shows that typical giant molecular clouds in nearby galaxies are of the order 50-300 M⊙ pc-2. Gas densities observed in the centers of disks can be an order of magnitude higher (e.g. Jogee et al., 2005). The increased pressure from a higher density of stars could significantly affect the formation of stars (for a discussion see Blitz et al., 2007). Furthermore, emission from a nearby AGN could ionize gas. It is therefore not clear if the formation of stars out of gas has similar efficiency in bulges and disks over the full range of bulge properties. In this paper we will investigate modifications to both the CO-to-molecular gas conversion factor and also to the calculation of star formation rates suited to the environment of bulges, we will also investigate the star formation law of bulges to determine if star formation in bulges is, at least to low order, similar to what is observed in disks.
In this paper we will implement new methods to determine both star formation rates and gas masses in ways that are more appropriate for bulges. We will then determine what structural properties of the bulge and galaxy are associated with high gas density. (Schruba et al., 2011; Bigiel & Blitz, 2012)
2. Sample
The properties of galaxies in our sample are listed in Table 1. Our sample is the superset of 3 surveys which map the CO(1-0) in nearby bulge-disk galaxies. Those surveys are the SONG (described in Helfer et al., 2003) conducted on the Berkeley-Illinois-Maryland Association (BIMA) interferometer (Welch et al., 1996), the NUGA (described in García-Burillo et al., 2003; PIs: S. García-Burillo and F. Combes) survey conducted on the Plateau de Bure (PdBI) interferometer, and the STING (described in Rahman et al., 2012; PI:A. Bolatto).
In addition to the molecular gas mass, for each galaxy we also determine the star formation rate, stellar mass and carry out bulge-disk decompositions to the near infrared stellar light profile (these methods are described below). Therefore we require that all galaxies have MIPS data from Spitzer Space Telescope. Also the galaxy must have near IR data with high enough spatial resolution to accurately decompose the stellar light profile (for a detailed discussion see Fisher & Drory, 2008). Two galaxies are thus excluded due to lack of ancillary data. NGC 3718 does not have MIPS data, and NGC 6574 did not have adequate data for bulge-disk decomposition. Also, we are interested in the properties of disks, so we omit those galaxies that are experiencing major mergers from the sample: NGC 5953, NGC 1961, NGC 4490. The AGN in NGC 1068 makes both decomposition and measurement of the star formation rate unreliable; it is thus omitted. Finally, due to Galactic extinction we could not reliably estimate the mass-to-light ratio of IC 342 & NGC 1569 (E(B-V) = 0.558 & 0.700 mag respectively, Schlegel et al., 1998); they are thus removed from the sample. The resulting combined sample is 60 galaxies.
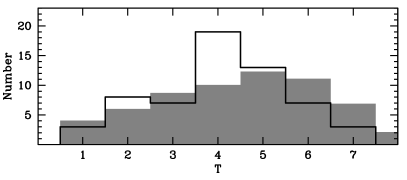
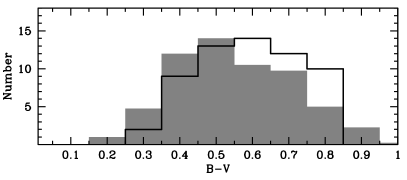
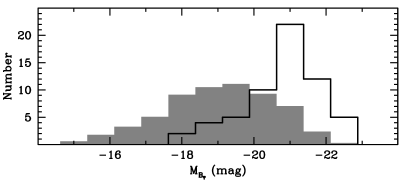
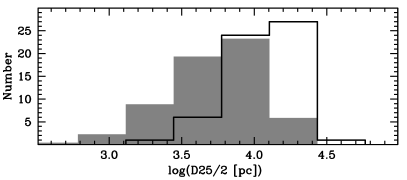
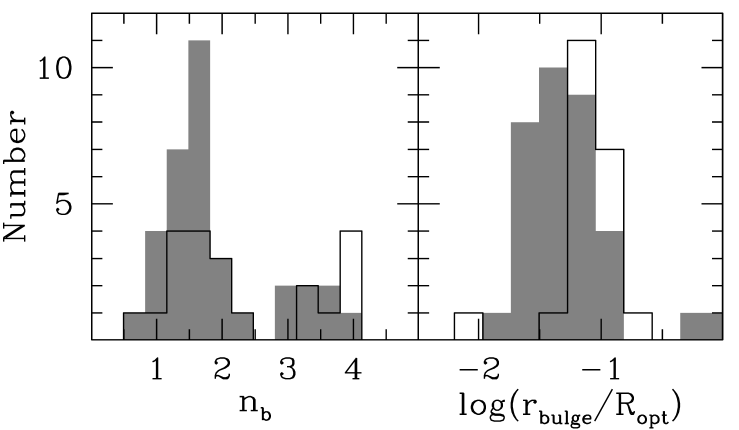
We combine the multiple surveys simply to increase the number of galaxies, and thus obtain better statistics. This is especially useful for separation into sub-samples for comparison (e.g. barred vs unbarred or pseudo- vs classical bulges). However, the trade off is that our sample is not based on a uniform set of selection criteria. In Fig. 1 we show the basic properties of our sample. For comparison we also show the distribution of basic properties of galaxies from the RC3 (de Vaucouleurs et al., 1991) that cover the same range in Hubble type. We have scaled the numbers of the RC3 galaxies to match our sample. In the top panel we show the distribution of morphological T-types of our sample. The sample includes spiral galaxies from Sa to Sd, with a preference toward intermediate types. The sample will thus favor medium size bulges (Simien & de Vaucouleurs, 1986), however, it should adequately cover parameter space. In the second panel we show the distribution optical color, and our sample adequately covers the range of in typical spiral galaxies. In the bottom two panels we show absolute galaxy magnitude and galaxy size. It is clear that our sample preferentially includes brighter, larger galaxies. Therefore, the results we find are most applicable to massive spiral galaxies.
3. Methods
In this paper we wish to compare gas masses of bulges, to bulge-disk decompositions, stellar masses, and star formation rates. Therefore, we require data from a wide variety of sources and must employ vastly different techniques, across a wide range in wavelengths. In this section we will describe each technique employed.
We take distances from the NASA Extragalactic Database (NED). We use the NED averaged redshift independent distance. In the event that an extreme outlier exists from the average, we remove the outlier and re-average.
3.1. Near-IR Surface Photometry & Bulge-Disk Decompositions
For each galaxy, we first carry out bulge-disk decomposition to the starlight. This allows us to measure the radius inside which the bulge dominates the surface brightness profile. Also we will use the decomposition parameters to study how gas density scales with those properties of the starlight. Our method is described in detail in several publications, including Fisher & Drory (2008, 2010); Kormendy et al. (2009).
A key part of our decomposition method is combining surface photometry from multiple data sources to construct a single 2-D surface brightness distribution. This technique reduces systematic errors in a particular data set (e.g. sky subtraction and point-spread function), as well as increasing dynamic fitting range, in radius, by combining high spatial resolution (typically HST) data with wide field ground-based data. This method is specifically optimized to reduce the uncertainty in bulge paramaters. Maximizing the dynamic fitting range in log(radius), not necessarily adding azimuthal information, is critical to accurately fit the curvature in the surface brightness profile, which is represented by the Sérsic index, for a particular bulge.
Our primary source of data for measuring the bulge-disk decomposition is the 2MASS H-band maps. Although 2MASS band is slightly less sensitive to dust emission and variations in mass-to-light ratio, the -band data goes much deeper in surface brightness. The improved sensitivity to the faint isophotes gives a better constraint to the disk parameters in the bulge-disk decompositions. When available we use the higher quality images from the 2MASS Large Galaxy Atlas (Jarrett et al., 2003). Otherwise -band images are taken from the 2MASS archive1112MASS archive is available at http://irsa.ipac.caltech.edu. We also frequently add data, when available, from the OSU Bright Galaxy Survey (Eskridge et al., 2002).
For all ground-based images we calculate sky values by fitting a plane to the areas of the image not affected by galaxy light or bright stars. We then subtract the surface representing the sky from the image. As we state above, comparison of multiple data sources facilitates identification of inaccurate sky-subtraction. When a galaxy has only one source of wide-field -band data we then carry out the surface photometry using data available from Spitzer/IRAC at 3.6 m. Uncertainties in sky subtraction of -band images are typically 0.1 mag.
Fine spatial resolution is crucial for accurate bulge-disk decomposition using the Sérsic function (for a detailed discussion see Fisher & Drory, 2008, 2010). Fisher & Drory (2010) finds that in most cases resolution of 100 pc is sufficient for robust decompositions. Since 2MASS has a typical resolution of 2” we must include higher resolution data in decompositions of galaxies at greater distance than 10 Mpc. For nearby galaxies including high resolution data significantly reduces the uncertainty in the fit. The most common source of high resolution data is publicly available images in the HST archive222Hubble Legacy Survey can be found at http://hla.stsci.edu/. HST data is always measured with the F160W filter (H-band).
To calculate the 2-D surface brightness distribution, we use the isophote fitting routine of Bender & Moellenhoff (1987). First, interfering foreground objects are identified in each image and masked via automatic routines in Source Extractor (Bertin & Arnouts, 1996). We then run multiple iterations of manual masking. Isophotes are sampled by 256 points equally spaced in an angle relating to polar angle by , where is the polar angle and is the axial ratio. An ellipse is then fitted to each isophote by least squares. The software determines six parameters for each ellipse: relative surface brightness, center position, major and minor axis lengths, and position angle along the major axis. We then combine the surface photometry of different data sources by averaging the profiles.
All profiles are scaled to match the zero-point of 2MASS data. For example, when we include Spitzer 3.6 m data we calculate the H-3.6 color over a region that is trustworthy (not likely affected by either point-spread-function or sky subtraction), and then shift the surface brightness of the 3.6 m to match the 2MASS image. This is carried out for all data sources.
We determine bulge and disk parameters by fitting each surface brightness profile with a one-dimensional Sérsic function plus an exponential outer disk,
| (1) |
where and represent the central surface brightness and scale length of the bulge, and represent the central surface brightness and scale length of the outer disk, and represents the bulge Sérsic index. The half-light radius, , of the bulge is obtained by converting ,
| (2) |
where the value of is a proportionality constant defined such that . and are the complete and incomplete gamma functions, respectively. We use the approximation . We restrict our range in possible Sérsic indices to to ensure that the approximation of is accurate (Caon et al., 1994; MacArthur et al., 2003). A more precise expansion is given in MacArthur et al., 2003. (Also, see Graham & Driver, 2005 for a review of the properties of the Sérsic function.)
Because the Sérsic parameters are only determined to fit the major axis profile, they do not include information about the azimuthal shape of the bulge or disk. We therefore adjust all luminosities by the average ellipticity in the region in which that parameter dominates the light.
Despite its successes, the Sérsic bulge plus outer exponential disk model of bulge-disk galaxies does not account for many features of galaxy surface brightness profiles. Disks of intermediate type galaxies commonly have features such as bars, rings, and lenses (see Kormendy, 1982 for a description of how these manifest in surface brightness profiles), similar features are now well known to exist in the centers of galaxies (e.g. nuclear rings and nuclear star clusters). In general there are two methods for dealing with perturbations to a fit. In some cases authors attempt to fit the extra components, other authors mask those components. We choose the later. Both have advantages and disadvantages. Fitting extra components (such as bars and nuclear star clusters) introduces degeneracies between the two components, where as masking data can introduce selection biases. Detailed testing and description of our method to deal with these structures can be found in Fisher & Drory (2008). The appendix of Fisher & Drory (2008) investigates the stability of Sérsic parameters to the masking of bars and nuclear clusters. In cases in which the bulge is well resolved these methods recovers bulge and disk parameters that are equivalent (also MacArthur et al., 2003). In the subsequent paragraphs we describe how we deal with these structure:
Bars: We mask the isophotes that are affected by bars and rings, and they are not included in the fit. This is a subjective procedure, as it requires selectively removing data from a galaxy’s profile, and undoubtedly has an effect on the resulting parameters. Fisher & Drory (2008) investigate the affects of this procedure in detail on surface brightness profiles; see the appendix of that paper. Typically, the structure of the ellipticity profile aids in identification of bars, as described in Marinova & Jogee (2007). In a galaxy in which we identify a bar (either using the ellipticity profile or near-IR imaging) we identify isophotes associated with the bar, then remove those isophotes, and re-fit Eq. 1. We continue this process, iteratively, until the systematic deviations in the residual profile converge on a robust solution. Fisher & Drory (2008) find that the largest effect of masking larger ranges is to increase the uncertainty. The size of the bulge remains roughly constant; there is a tendenancy for the Sérsic index to decrease very slightly (). We stress that the reason we can do this is that our technique relies upon resolving the bulge well, either from the galaxy being very close or from having HST data.
Bulges in unbarred galaxies are larger than those in barred galaxies.This is not likeley an artifact of our method to remove bars from fits because the same result can be found in the samples of other works that carry out bulge-bar-disk decomposition. This is true both when we compare physical size, and the size of bulges that has been normalized by the size of the galaxy. We will discuss later (in §3.6) that the small size difference is not what is responsible for the differences in bulge CO surface brightness between either barred or unbarred galaxies or classical or pseudobulges.
In our sample we find that the median size of bulges in unbarred galaxies are 1.5 the size of bulges in bared galaxies. To check that this is not a bias introduced by our method, we compile data from both Laurikainen et al. (2004) and Gadotti (2009) to find a similar result; both of these papers use 2-D decompositions, that include parameterizations for the bulge, bar, and disk. Gadotti (2009) finds, similar to us that the median bulge half-light radius for classical bulges () is the median re of pseudobulges (). We reconfirm this with data from Laurikainen et al. (2004) who also carries out bulge-bar-disk decomposition to 181 bright spiral galaxies in the OSUBGS (Eskridge et al., 2002). It is important to take into account the size of the galaxy; bigger bulges may simply reside in bigger halos. So we recheck this result, this time we normalize all samples by the optical radius of the galaxy (). We find the same result. The median bulge in an unbarred disk is the size of that in a barred disk (when normalized by the disk scale-length).
In Fig. 2 we show the distribution of Sérsic indices and bulge sizes for our sample galaxies. The size of the bulge is the radius at which the Sérsic function of the bulge, and the exponential function of the disk have equal surface brightness. We do not see a significant offset in either or bulge size. The distribution of Sérsic indices in this sample appears to be very similar to that of Fisher & Drory (2008, 2010); the bimodality in bulge Sérsic index is clearly visible for barred and unbarred galaxies. In bulge size there is a slight preference for unbarred bulges to be larger fraction of the optical radius. But as we state above, this is likely an unavoidable physical phenomenon. We will discuss below that this difference does not bias our CO surface brightness measurements. In our sample, bulges in unbarred galaxies are typically 1.5 the sizes of bulges in barred galaxies, when normalized either by disk scale-length or .
A few pseudobulges have very small Sérsic indices (). They are NGC 0925, 2403, 2903. Gadotti (2008) shows that bars can have very low Sérsic index. It is therefore possible that one could misidentify a bar as a pseudobulge, with very low Sérsic index. In NGC 0925 and NGC 2903 we detect very clear, prominent large-scale bars in the stellar light distribution. They are masked from the fit. Therefore, in these galaxies the bulge is not a misidentified large-scale bar. In NGC 2403 we do not identify a bar. The galaxy is flocculent, and morphologically similar to M 33. The bulge in NGC 2403 is small. It has and the radial size of the bulge of is roughly 4% of the disk scale length. Also, the isophotes of NGC 2403 do not become flatter (that is more bar like) in the bulge region. We feel this small size and isophote shape likely indicate that this is a bulge and not a bar.
Nuclear Point Sources: We do not include nuclear star clusters in the fit. Similar to bars they are masked. We do not attempt to model the PSF of instrument in the surface brightness profile. We simply do not attempt to fit isophotes that are smaller than the beam size of the instrument, and if a nuclear point source is identifiable we do not fit that region either. Fisher & Drory (2008) describe in detail the uncertainty introduced in this method. Similar to removing a bar, removing the isophotes of a nuclear point source is an iterative process in which we try to minimize systematic deviations in the residual profile.
Rings, Warps and Tidal Features: In our sample 14 galaxies show signs of interaction. In some cases the interaction is significant enough to manifest as perturbations in the surface brightness profile at large radius. Also galaxies can contain large scale rings that are not exponential in a surface brightness profile. Our decomposition method assumes that the surface brightness profile becomes exponential at large radius. Violations to this assumption are well documented (eg. van der Kruit & Searle, 1981; Kormendy, 1982; Erwin et al., 2005). A few examples in which this occurs in our sample are NGC1637, NGC5371,NGC3953. In cases where the galaxy clearly does not agree with this assumption we truncate the fit at a radius shorter than the disturbing feature. As with bars and nuclear point sources the exact radius is chosen through iteratively refitting.
3.2. Pseudobulge Identification
Identifying bulges as pseudobulges or classical bulges remains a topic of ongoing research. A common method is to base the bulge classification on the morphology of the broadband optical emission at high spatial resolution (for detailed descriptions see Kormendy & Kennicutt, 2004; Fisher & Drory, 2008). In this method, it seems quite plausible that the spiral will be more easily identified in a bulge with more dust. In this paper, we are specifically studying the distribution of gas, therefore identifying bulges based on morphology may introduce a circular selection criteria.
Fisher & Drory (2008, 2010) show that the Sérsic index, from Eq. 1, fitted to near infrared surface photometry offers a means of identifying pseudobulges and classical bulges that is less affected by the dust and gas content of the bulge. A typical disk has a roughly exponential decline, and therefore has where as a typical elliptical galaxy has larger Sérsic indices . The bulges in Fisher & Drory (2008) show a bimodal distribution of Sérsic indices, and the minimum of the distribution is at . They also show that 90% of bulges with disk like morphology have . Also Fisher & Drory (2010) show that bulges with are not on the same scaling relations as elliptical galaxies (such as size-luminosity) but those with larger Sérsic index are on those correlations. (Fabricius et al., 2012) show that using the Sérsic index to identify bulge, agrees with dynamical methods to identify pseudobulges. Though more work on the field of pseudobulge identification is certainly needed it appears that the Sérsic index is able to distinguish physically different objects. Lower Sérsic index bulges are, on average, lower velocity dispersion systems and establish different scaling relations between size, luminosity and surface density.
3.3. Stellar Masses
We estimate the mass-to-light ratio separately for bulges and disk to account for variation in the stellar populations and extinction within the galaxy. We use multicolor imaging to estimate the mass-to-light ratio in the bulge separately from the disk. We use two separate methods to determine the mass-to-light ratio, depending upon available data. All of our sample galaxies have data available in 2MASS, and 42 galaxies are covered in the Sloan Digital Sky Survey (SDSS) data release 8. The 42 galaxies with available SDSS data allow us to carry out direct SED fits to determine the mass-to-light ratio. Note that all magnitudes are corrected for Galactic extinction using values from Schlegel et al. (1998), and extinction curves from Cardelli et al. (1989).

For the galaxies covered in SDSS we measure the stellar mass directly from fitting Bruzual & Charlot (2003) models to the multicolor (ugriz-JHK) photometry. The models include composite stellar populations of varying star formation history, age, metallicity, burst fractions, and dust content, and assume a Salpeter initial mass function. The uncertainty in the fit to these models is typically 0.1 dex. For a detailed description of the model see Drory et al. (2004).
Not all galaxies in our sample are covered in SDSS. We therefore must choose a means of estimating the mass-to-light ratio that is available on all galaxies. Sources of data that are widely available on nearby galaxies include near-IR colors (J-K), a combination of GALEX and 2MASS data (NUV-J), and RC3 (B-V)T total galaxy colors. To determine which metric is best, we measure the correlation for those galaxies with mass-to-light ratios determined with SDSS data. We find that has the smallest scatter and the strongest correlation coefficient. This correlation is shown in Fig. 3. We find a relationship such that,
| (3) |
The relationship between and is shown in Fig. 3. A Pearson’s correlation coefficient for this relationship is r=0.74. From our SDSS sample, we determine that the scatter in mass-to-light ratio using the NUV-J color is 0.1 dex.
For the -band flux used to measure the bulge mass, we use the total flux in the same region that the FUV and 24 m are measured. To be clear this is not the flux from a Sérsic fit. Using the flux from a Sérsic function returns masses that are systematically large by roughly 20%.
For each galaxy we note which method was used to determine the stellar mass in Table 2 & 3. In our sample 42 galaxies have mass-to-light ratios determined with full optical-near IR SED, and 18 are determined only with the single color. The uncertainty in the final stellar mass is determined by adding the uncertainty from the bulge-disk decomposition with the uncertainty in the mass-to-light ratio. We use the typical uncertainty of 0.1 dex for galaxies with the full SED fit and 0.15 dex for the NUV-J determined stellar masses.
3.4. Global Star Formation Rates
We calculate the star formation rate (SFR) by combining and 24 m fluxes. The reason for combining and 24 m data to trace the SFR is fairly straightforward. The emission of young O and B stars heavily dominates the wavelength range covered by the filter. However, this very blue light is heavily affected by extinction. The emission at 24 m around a star forming region, is mainly from hot dust grains. For a more detailed discussion of these processes we refer the reader to Calzetti et al. (1995); Kennicutt (1998); Buat et al. (2002); Calzetti et al. (2007); Kennicutt et al. (2009). Indeed, both and 24 m luminosity have been shown to strongly correlate with SFR independently (respectively Salim et al., 2007; Calzetti et al., 2007). The method of combining UV and IR data has been used by many authors (for a detailed discussion see Leroy et al., 2012). A very practical reason for this method is the large number of galaxies with available data in Spitzer and GALEX archives, and these sources are well matched in resolution to typical interferometric maps of CO(1-0).
When available we use the high quality maps from the SINGS survey (Kennicutt et al., 2003) otherwise we download the post-basic calibrated data from the Spitzer Archive333available at http://sha.ipac.caltech.edu. Similarly, when available we use data from the Nearby Galaxies Survey (Gil de Paz et al., 2007), otherwise we take the deepest available image of each galaxy. Images are then background subtracted, in a similar way to the sky subtraction described in the photometry subsection. That is we fit a surface to parts of the image that are not affected by galaxy emission. We measure fluxes in and m bands for the region where the bulge dominates the starlight, and also the total galaxy. We estimate disk flux as the total minus the bulges, .

The stated assumptions that (1) the star formation rate can be broken down into two components of emission, unobscurred and obscured star formation, and (2) these components can be traced, respectively, by the FUV and 24 m luminosities, is quantified with the following equation,
| (4) |
Where we define the luminosities as and similarly for IR, . The coefficient relating the FUV emission to the unobscurred star formation is taken from Salim et al. (2007); they find , where SFR is in and L(FUV) is in erg s-1. To determine the coefficient relating obscured star formation to the L(24) we solve . For this we take the data from Kennicutt et al. (2009) to use as a control set of star formation rates, we find . In our sample 3 galaxies did not have FUV data, for these galaxies, we use the 24 m emission alone from Calzetti et al. (2007). Fig. 4 we compare our SFR to those from Kennicutt et al. (2009), for the 24 galaxies which exist in both samples. The solid line indicates the line of equality (y=x), the two are strongly correlated with Pearson’s correlation coefficient of r=0.9. The scatter in the correlation is 0.2 dex. Therefore, our uncertainty for star formation rates will be determined by adding 0.2 dex with measurement uncertainties of 24 m and FUV flux. In the case of bulge star formation rates, a significant source of uncertainty comes from the relative beam size of GALEX and MIPS to the size of bulges. We estimate this simply by determining the flux in regions 1 beam sizes, the uncertainty from beam sampling is typically a few percent of the total flux. The beam size of Spitzer 24 m and GALEX FUV are both 6r̈oughly. Two galaxies, NGC 4273 & 4654, have bulges that are smaller than the beam size of these instruments. In these galaxies we take all fluxes to be the size of the MIPS beam.
3.5. Estimating Star Formation Rates of Bulges
The luminosity we measure in Spitzer and GALEX images can be thought of as a superposition of emission from both young stars and old non-star forming populations, as follows,
| (5) |
| (6) |
The old stars emit some light in the UV, hence . Also the old stellar populations could heat dust causing it to reradiate, hence . This is some times referred to as “diffuse emission” or “cirrus emission.” The determination of the star formation rate in Eq. 4 relies upon the assumption that the FUV and 24 m flux is coming from, or at least strongly dominated by, young stellar populations. At the least star formation rate indicators that are calibrated to unobscured emission for HII regions using Pa lines, (e.g. Kennicutt et al., 2009) implicitly account for deviations from this assumption. Furthermore, the total flux from a galaxy in FUV and 24 m is likely to be heavily dominated by emission from star forming regions. Therefore, global star formation rates, likewise include a correction for this. However, measuring the star formation rate for substructure within galaxies may result in specious estimations of the star formation rate. The problem of diffuse emission affecting star formation rate indicators is discussed in numerous papers, for recent discussion see Leroy et al. (2012); Kennicutt & Evans (2012).
This phenomenon is likely stronger in bulges because they are systematically higher in stellar surface density than the outer disk.In the most extreme case some bulges in the nearby Universe, for example M 31, are very old (Saglia et al., 2010) and may be completely empty of young star forming regions (Groves et al., 2012). Although this is clearly not the case for all bulges. Those containing nuclear rings, like NGC 3351, show clear signs of active star formation that is easily identifiable in NICMOS Pa maps.
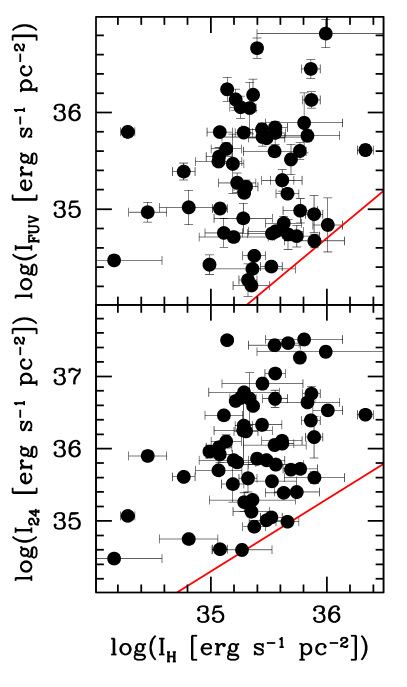
Leroy et al. (2012) estimate the diffuse radiation field through models of dust emission. Such an approach is grounded in physically based arguments, but requires a significant amount of ancillary data that is not always available for large samples of galaxies, or at adequate spatial resolution to study bulges. In this paper, we adopt an ad hoc approach to estimating the contribution of old stars in bulges. Our method for estimating the flux from old stars is based on the assumption that at least some of the bulges in our sample are dominated by emission from old stellar populations, and . In these bulges we are assuming that the 24 m emission is due to dust grain heating from evolved stellar populations. In this limit we then make the approximation that (and similarly for FUV), where is the luminosity of the same region in -band. The bulges with the lowest values of and are then used to determine the correction for the 24 m and FUV fluxes.
In Fig. 5 we plot the surface brightness of bulges in FUV (, top) and 24 m (, bottom) against the surface brightness in -band, . These figures are intended to illustrate the magnitude of the correction in each band. For the -band flux we use the total flux in the same region that the FUV and 24 m are measured. To be clear this is not the flux from a Sérsic fit. We find that the 24 m luminosity is never lower than 20% of , and the FUV luminosity is never less than 5% (units are erg s-1). Red lines indicate these ratios in Fig. 5. Average flux ratios for bulges in our sample are and . We then invert Eqs. 5 & 6, and substitute in the estimates of the old stellar populations
| (7) |
| (8) |
We now calculate the SFR of a bulge the same as total galaxies, however, we now use corrected fluxes from Eqs. 7 & 8. The corrections in Eqs. 7 & 8 are intended to be taken as rough estimates. A better approach would include detailed modeling of both the optical SED (preferably from IFU data) and the IR SED including Spitzer & Herschel data; such analysis is beyond the scope of this work. We will investigate the effect of using corrected and uncorrected fluxes on the star formation law later in this work.
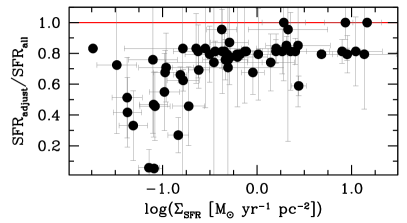
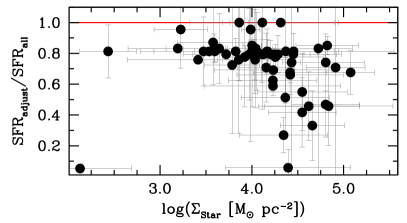
In Fig. 6 we compare the star formation rates determined from the total flux at FUV & 24 m to those corrected emission from old stars. In the top panel, we plot the ratio of star formation rates against the star formation rate density from the uncorrected flux. We find that in bulges the median ratio of corrected to uncorrected star formation rate is 80%. At low star formation rate surface densities the correction becomes much larger. There appears to be a break near , below which the and m flux is more heavily affected by old stars. In the bottom panel, we plot the ratio of star formation rates against the stellar surface density of bulges. As one would expect, the emission from old stars becomes a larger fraction at higher stellar mass densities. However, it is notable that having a large stellar mass surface density does not necessarily mean that the flux in Eqs. 5 & 6 is dominated by old stars. There are several bulges with high stellar surface densities that are still dominated by young stars. We remind the reader, that the correction of almost 100% of the flux in two galaxies is set by definition.
The galaxies in which the correction to the SFR is more than 50% are NGC 2841, 3521, 7217, 4725, 3031, 3953, 3992, 3486. 6 of 8 are classical bulges (larger Sérsic index). NGC3953 is a pseudobulge, but the galaxy is very gas poor, in fact the CO(1-0) bulge flux is not measurable, that is it is an upperlimit. NGC 3486 is a very low surface brightness galaxy, which is also relatively gas poor. These galaxies preferentially occupy the low star formation - low gas density region of the correlation between gas and star formation rate density. Using the corrected star formation rates these galaxies are not outliers in the relationship, and have a similar average depletion time () as the rest of the sample. However using uncorrected star formation rates, they have depletion times that are significantly shorter.
3.6. Molecular Gas Masses
As we state above our sample is the combination of 3 recent interferometric surveys of CO(1-0) emission from nearby galaxies. They are the BIMA SONG, the CARMA STING and the PdBI NUGA. Here we will briefly describe observations of each survey, and then how the CO(1-0) fluxes are converted to molecular hydrogen gas masses.
BIMA SONG: For a detailed description of SONG data and data reduction see Helfer et al. (2003). The SONG maps CO(1-0) emission in 44 nearby spiral galaxies using the BIMA interferometer and the NRAO 12 m single dish telescope at Kitt Peak. The aim of SONG was to map CO(1-0) on a representative set of galaxies. The selection criteria included , declination higher than , not too highly inclined () and brighter than . Typical beam sizes of SONG maps were 6” with robust fields of view 3’ across. The data were taken in 10 km s-1 channels, with typical noise of 58 mJy beam-1. The SONG maps are publicly available in the NASA/IPAC Extragalactic Database.
CARMA STING The CARMA STING maps CO(1-0) emission from 23 nearby spiral galaxies. The CARMA STING survey aims to map the CO(1-0) emission out to one-quarter to one-half of their optical radii. The sample is composed of northern (), moderately inclined (i ¡ 75 deg) galaxies from the IRAS Revised Bright Galaxy Sample within 45 Mpc (Sanders et al., 2003). The galaxies were selected to uniformly sample 10 mass bins distributed between Mstar= and 3M⊙. The STING maps are robust over a diameter of 2’, and have typical beam sizes of 3-5 arcseconds. STING maps employ a similar velocity masking and weighting techniques as discussed in Helfer et al. (2003). The STING data are publicly available on a dedicated website 444http://www.astro.umd.edu/rareas/lma/research/alberto_bolatto/galaxies.html. The STING maps have not been merged with single dish measurements, therefore we refrain from measuring flux scales larger than 1 arcminute. The typical sensitivity of STING maps is 22 mJy beam-1 in 10 km s-1 channels. STING galaxies were consciously chosen to not have CO(1-0) maps, and therefore represents a significant increase in sample size.
PdBI NUGA The NUGA survey is described in García-Burillo et al. (2003). The survey consists of CO(1-0) maps of 12 nearby galaxies within a distance of 40 Mpc. The NUGA survey specifically targets galaxies with low-luminosity AGNs. All NUGA observations are made on the PdBI. NUGA maps have the highest resolution in the sample (0.5-1”). The sample overlaps significantly with SONG & STING, the finer resolution helps in studying the radial distribution of 12CO. The NUGA maps used in this paper have not been merged with IRAM 30 m data, therefore we refrain from measuring flux at scales greater than 45”. NUGA maps typically have sensitivities 1-5 mJy beam-1.
For each galaxy we simply integrate the CO(1-0) emission inside the region where the bulge dominates the light. For those galaxies without bulges, we integrate to 20% of the disk scale-length, which gives a comparable size of bulges, especially pseudobulges (Courteau et al., 1996; Fisher & Drory, 2008). In one galaxy, NGC 2403, the bulge diameter is smaller than the beam size of the CO map, in this galaxy we use the resolution of the 6äs the bulge radius in all calculations, so that it is resolved in CO, 24 m and FUV. Uncertainty in CO(1-0) flux is determined from a combination of the sensitivity of the map over the area being measured and the error introduced in the beam size of the image. We are able to check that our method of measuring the flux returns sensible results by measuring the flux in 1 kpc diameter apertures for the SONG sample, as this has been published in Sheth et al. (2005). Differences between our fluxes and those of Sheth et al. (2005) is typically smaller than the uncertainty in the measurements. We divide the mass in the bulge region by the area of the bulge to compute the gas surface density.
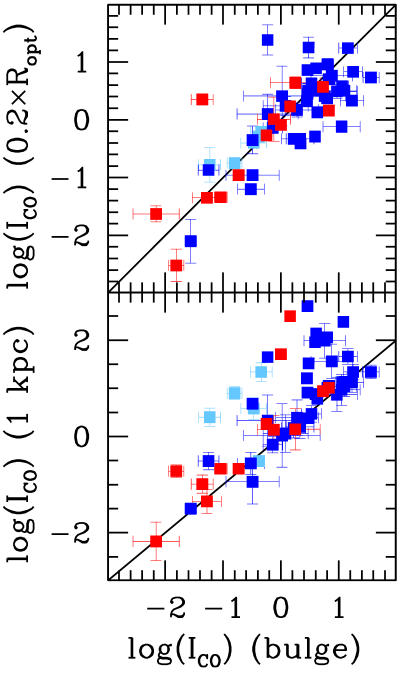
The observed difference between the size of classical bulges and pseudobulges is not enough to account for the difference in we measure CO surface brightness. In this paper we are specifically interested in the amount of gas that is inside the radius where bulges dominate the light. We therefore measure the gas mass in the same region in which the surface brightness profile of stars shows a bulges in the bulge-disk decomposition. Classical bulges are, on average, larger than pseudobulges (see discussion above, also Gadotti, 2009; Fisher & Drory, 2008, 2010), therefore it is possible that classical bulge surface density may be lower simply because we are averaging over larger regions. In Fig. 7 we make a straightforward comparison of the CO surface brightness inside of bulges to that of the central kiloparsec (bottom panel), and to that measured inside (top panel). The solid line represents the line of equality. We find that there are not significant differences between the surface density of bulges and those of other commonly used, or physically motivated regions methods of defining the galaxy center.
A common way to measure the central gas density is to choose a fixed size in parsecs in the center of galaxy (e.g. Sheth et al., 2005; Komugi et al., 2008). This has the advantage of being more homogeneous, however is less physically motivated. Recently, multiple studies (Schruba et al., 2011; Bigiel & Blitz, 2012) show that the transition between the exponential profile and the inner profile occurs roughly near 20-30% of the optical radius. (Ropt is the radius at which the band surface brightness profile reaches 25 mag arcsec-2.) Bulges are typically smaller than , the median bulge radius, in our sample, is . Only two bulges are larger than . Therefore, our measurements are inside the range were the assumption of exponential decay of gas surface brightness profiles is not valid.
In Fig. 7 a few bulges have higher CO surface brightness in the central kiloparsec than the entire bulge, but these are pseudobulges. Note that for simplicity we do not include bulges with upperlimits in this figure. Despite being larger on average, classical bulges (red points) do not show a systematic trend, they do not deviate more than pseudobulges (blue) or the centers of bulgeless galaxies (light blue). Based on these results we feel that the differences we discuss later between the surface density of classical and pseudobulges is likely real, and not an effect of the radius we choose.
Also, the slight differences in sizes of pseudobulges and classical bulges (described in the Bulge-Disk Decomposition Section ) are not large enough to account for the differences in CO surface brightness. As we state above, classical bulges are larger by a factor of 1.5-2 the size of pseudobulges (bulges in unbarred disks are larger by a similar factor, so the same argument can be applied to them). If a galaxy had all the CO flux coming from a radius , and we used the radius then the surface brightness would be lower by a factor of 4. Examination of Fig. 7 is clear that the typical difference between classical bulge and pseudobulge CO surface brightness is much higher than this, and is typically an order of magnitude. Based on this we feel that size difference alone is not likely accounting for the difference between classical bulges and pseudobulges.
Another check is simply to investigate the shape of the CO surface brightness profiles. We plot all CO surface brightness profiles in Fig. 10. We will discuss the surface brightness profiles in more detail later. Using profiles we can ask if this hypothetical case ever exists. Examination of the profiles suggests that it does not. Pseudobulge and classical bulge CO surface brightness profiles are different. Classical bulges frequently have holes in the center of the CO map (and show their peak CO surface brightness in the disk); pseudobulges are frequently peaked in the center of the galaxy. The few classical bulges that are centrally peaked all have either a strong bar or are interacting. This suggests a physical difference. We therefore take both of these results in Figs. 7 & 10 to indicate the differences we observe between the surface density of molecular gas in bulges are not simply due to classical bulges being systematically larger.
For most of our sample we are using interferometric maps that do not have single dish fluxes, to estimate the CO flux in the bulge. These maps are therefore insensitive to very slowly varying emission. However, Sheth et al. (2005) shows that in BIMA SONG galaxies the median difference for the central surface brightness measured with and with out single dish data is roughly 5%. Therefore, we expect this difference to have little effect on our results.
Next we must convert the CO(1-0) emission into molecular hydrogen masses. For review discussions of the conversion of CO(1-0) emission to molecular gas mass see Blitz et al. (2007); Kennicutt & Evans (2012).
Typical conversions of CO(1-0) fluxes to the mass in molecular hydrogen assume a constant conversion factor (), typical values are cm20 (K km s-1)-1 (Young & Scoville, 1991). However, a growing body of evidence suggests that is not completely uniform from galaxy to galaxy, or even within in a given galaxy. Solomon et al. (1997) show that the conversion factor varies as the square root of H2 density divided by the brightness temperature . Recent work has shown that XCO varies with metallicity (Leroy et al., 2011; Bolatto et al., 2011; Genzel et al., 2012). Also, naively applying typical values of to ultra-luminous IR galaxies returns molecular gas masses which exceed the virial mass (Solomon et al., 1997, e.g.). Similar results have been found in the centers of nearby galaxies Israel (2009b, a); Meier et al. (2010). A possible explanation for this phenomenon is that high densities of gas or stars- a common feature of both luminous IR galaxies and galactic centers- lead to higher temperatures in molecular clouds which then leads to a lower (Maloney & Black, 1988). For more discussion see Narayanan et al. (2011) and Tacconi et al. (2008). It is likely that results from Herschel Space Observatory, and especially the KINGFISH survey (Kennicutt et al., 2011), will prove enlightening on the radial variations of in typical spiral galaxies. Yet at this point the exact nature of the relationship between and galaxy properties is tenuously known at best.
For this work it is possible that the variety in bulge and disk
densities makes application of a single to all galaxies a
poor assumption. We therefore investigate the use two non-constant
functions for . First we use the metallicity dependent
factor from Genzel et al. (2012), and secondly we use the
metallicity and CO surface brightness dependent factor from
Narayanan et al. (2011). The purpose of this is to determine if
measurements of molecular gas mass in bulges and disks are sensitive
to the choice of CO-to-H2 conversion factor. Therefore to
calculate the molecular gas
mass we use the following 3 formulae
Constant :
| (9) |
where is the distance in and is the flux density in Jy km s-1. Metallicity dependent :
| (10) |
Where , we convert the metallicity dependance of
Genzel et al. (2012) to that of Kobulnicky & Kewley (2004) according to the
transformations in Kewley & Ellison (2008).
Metallicity and CO surface brightness dependent :
| (11) |
where is the CO surface brightness in K km s-1 and is the metallicity in solar abundance. Finally, we multiply all
molecular hydrogen masses by 1.36 to account for Helium. Therefore the final mass is .
We take metallicities from the literature and the source is given in Table 1. The most common source of available metallicity for galaxies in our sample is Moustakas et al. (2010). We use metallicities in the Kobulnicky & Kewley (2004) basis, and apply conversions based on Kewley & Ellison (2008). Many of our galaxies do not have published metalicities, for these we use metallicities determined from the stellar mass-metallicity relationship in Tremonti et al. (2004). For those galaxies in which the metallicity is based on the mass-metallicity relationship we assume that the uncertainty is increase in the molecular gas mass by 0.1 dex, which is comparable to the scatter found in Tremonti et al. (2004).
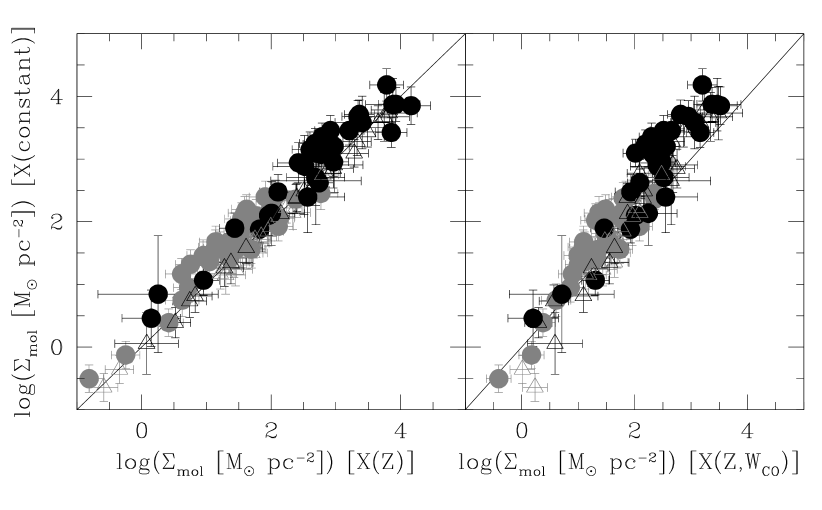
In Fig. 8 we compare the molecular gas densities determined from the metallicity dependent conversion factor (hereafter ), and the metallicity - CO surface brightness dependent conversion factor (hereafter ). We calculate the surface density of molecular gas in the bulge and outer disk. To calculate molecular gas masses of disks we use total flux measurements from FCRAO survey (Young et al., 1995), and we subtract the flux from the bulge region. The FCRAO survey uses major axis scans to obtain total fluxes. We are therefore subtracting a flux derived from a CO map from a flux derived from a scan, which may lead to slightly different values. The advantage of using (Young et al., 1995) is that it provides a single uniform data source for a very large number of galaxies. A comparison of FCRAO total fluxes to those derived from fully sampled maps has been made by Helfer et al. (2003) and also Leroy et al. (2009); both find good agreement. To calculate the surface area of the disk we use 4 times the scale-length of the outer disk (determined from the bulge-disk decomposition), which on average is similar to the optical radius.
We find very little difference between and constant , indeed the median ratio between the two is , and the scatter is comparable to the error-bar (0.3 dex). This simply reflects the fact that our metallicities are not very different than clouds of typical spirals, like the Milky Way. Contrarily, the densities based on the Narayanan et al. (2011) conversion factor, , are systematically different than the constant . The median molecular gas mass of bulges based on the Narayanan et al. (2011) factor is 40% that of the constant values. The constant and metallicity only conversion factors yield gas surface densities that are very high, reaching . However, the most extreme values of the Narayanan et al. (2011) conversion factor are as much as an order-of-magnitude lower than those determined with the constant . There is less of an effect on disk averaged values. The median disk mass measured with is 75% that measured with a constant and . We do not find a systematic difference between the galaxies with measured metallicity and those with inferred metallicity. For the remainder of the paper we shall report all results for both and .
4. Results
4.1. Profiles
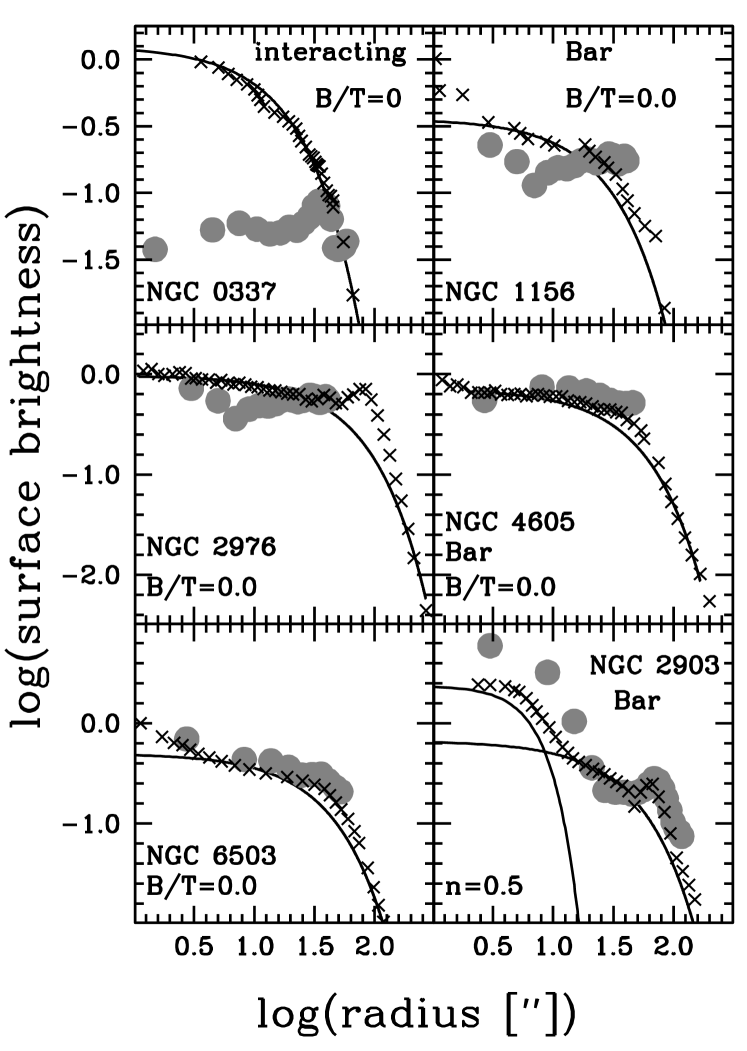
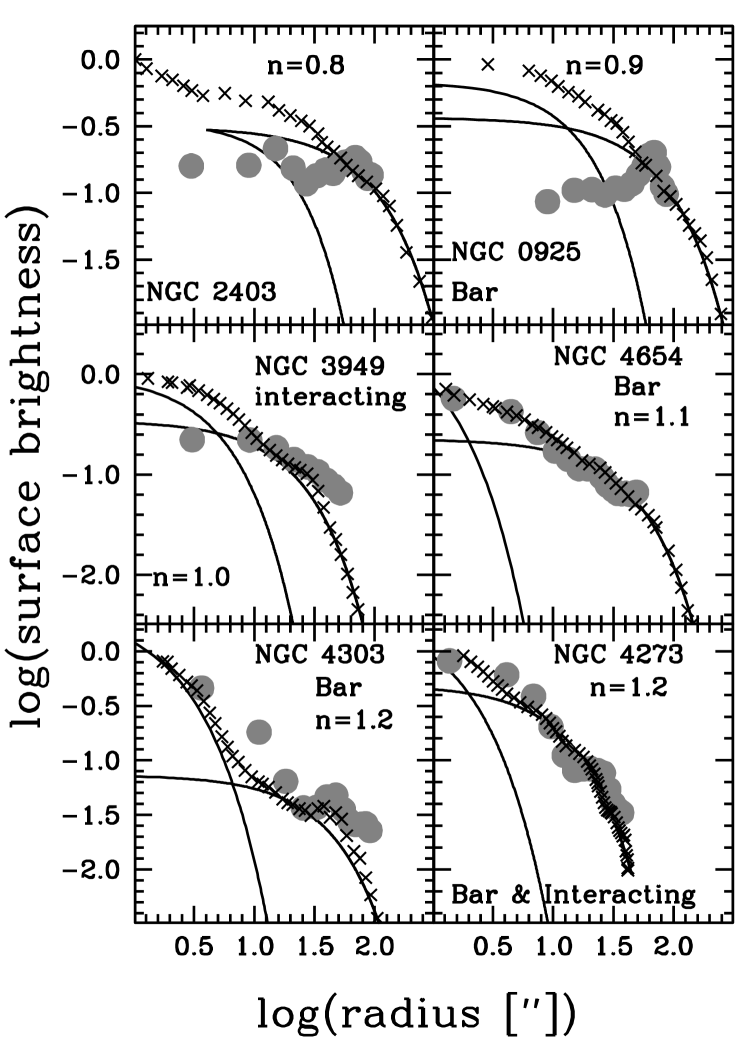
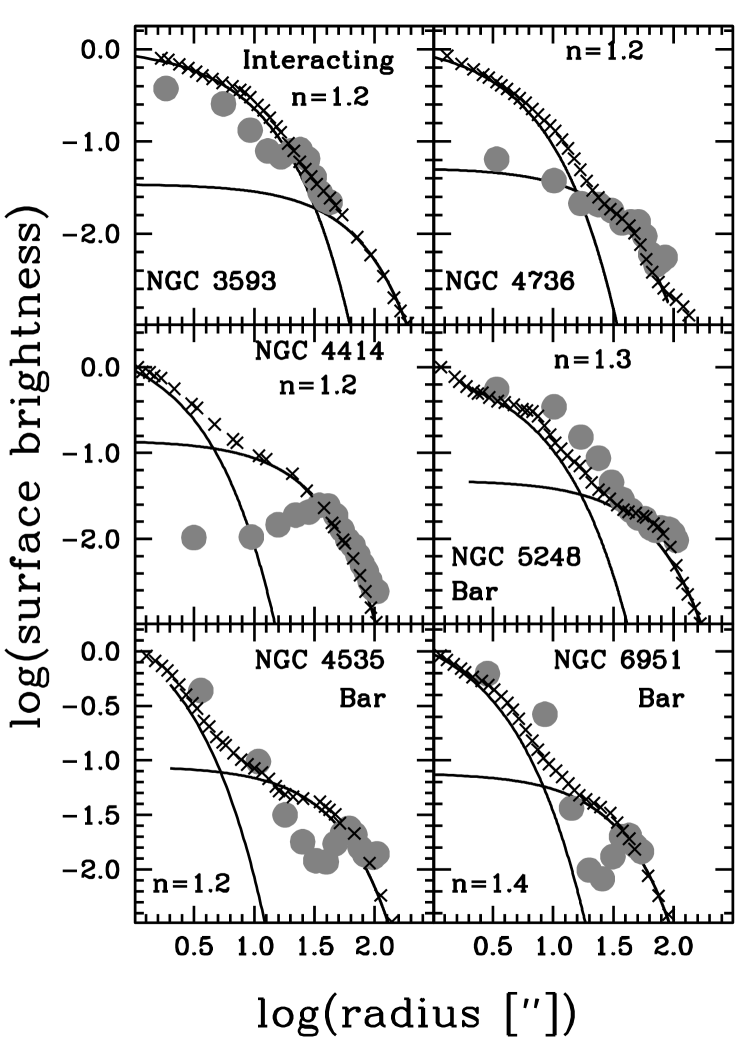
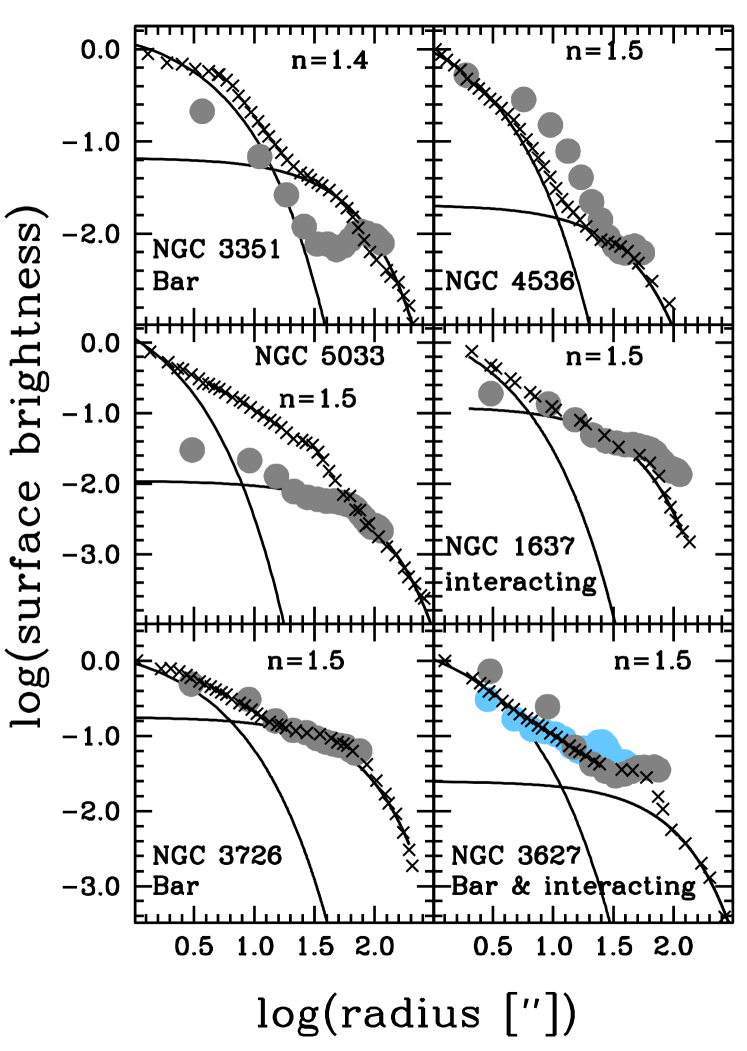
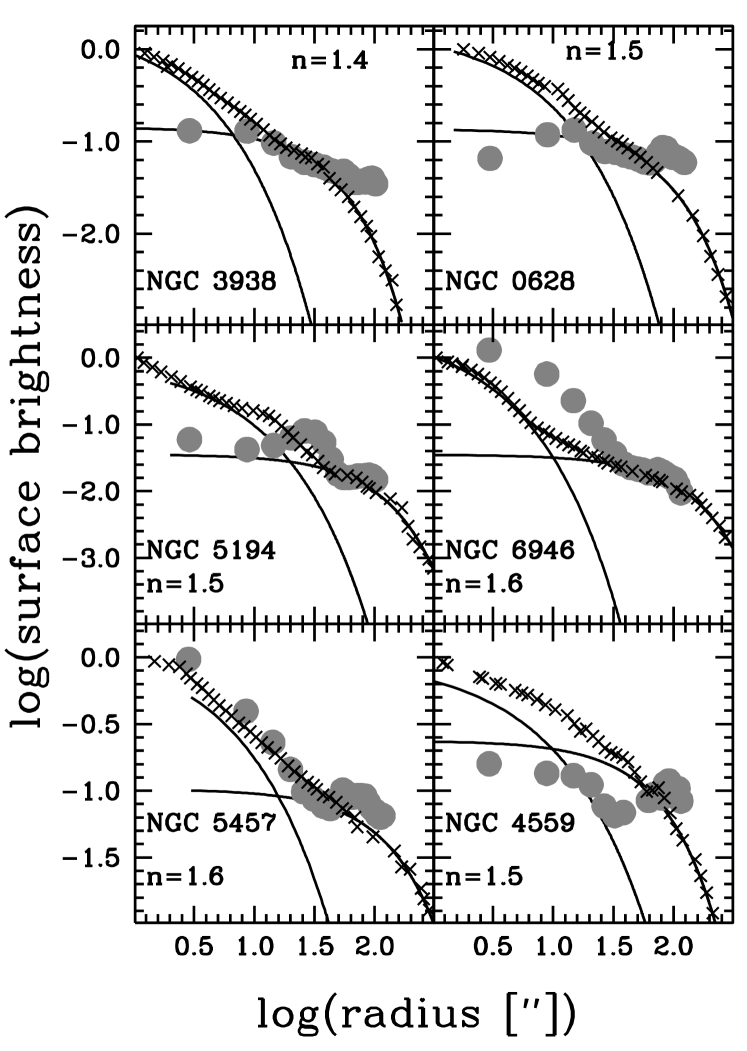
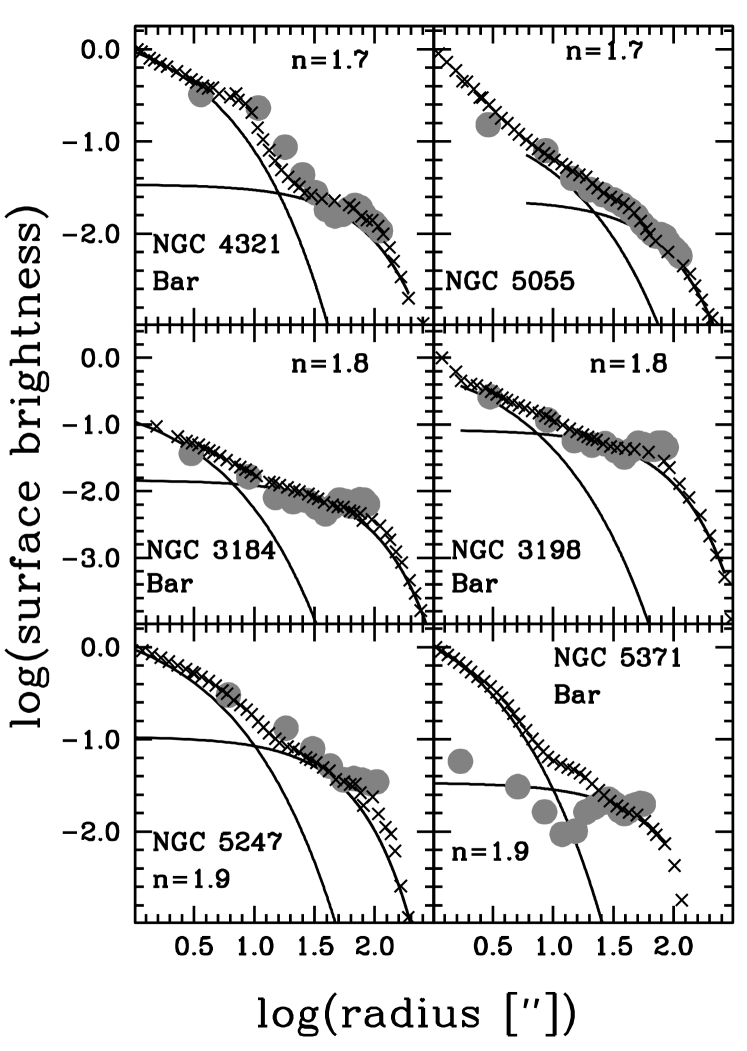
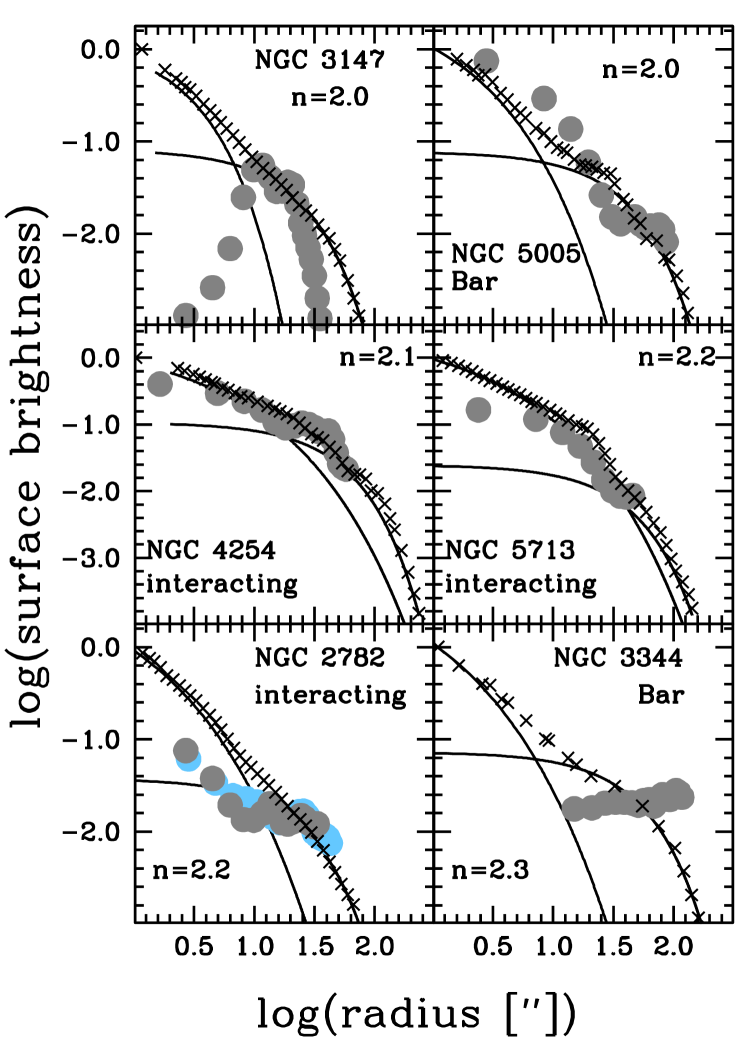
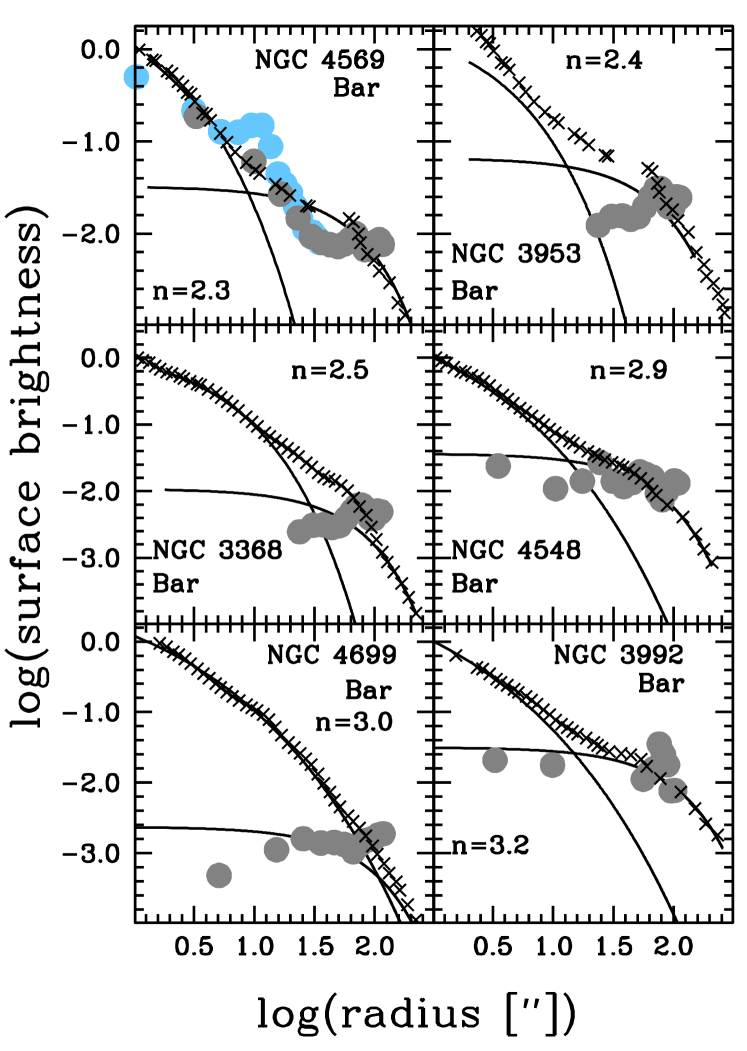
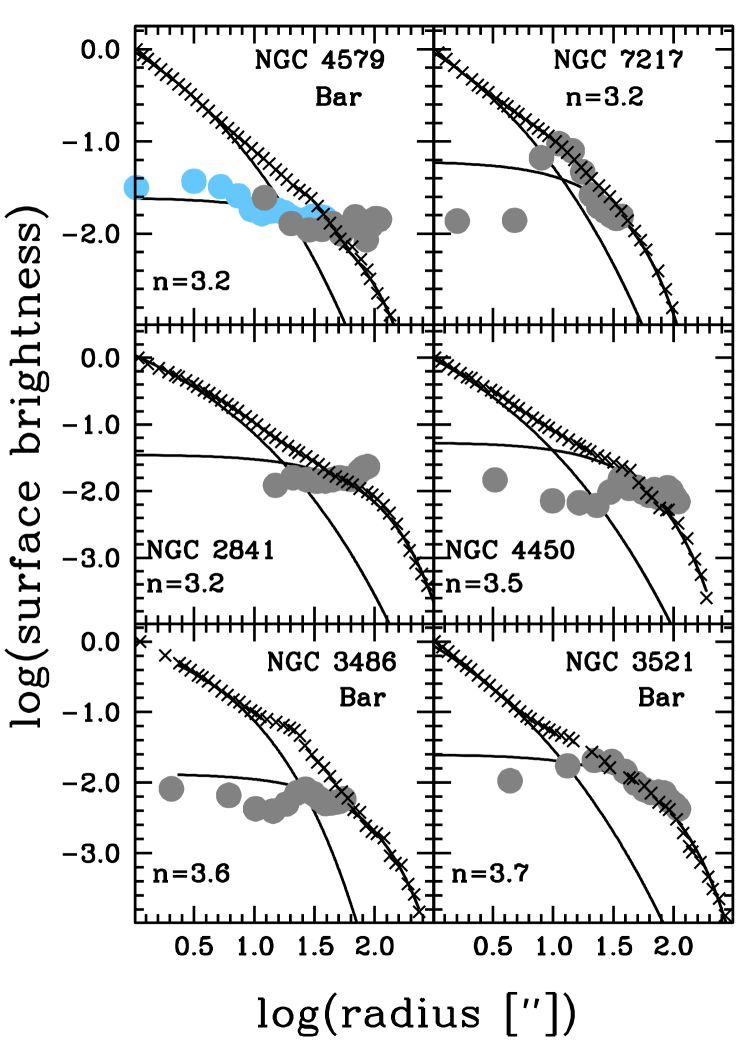
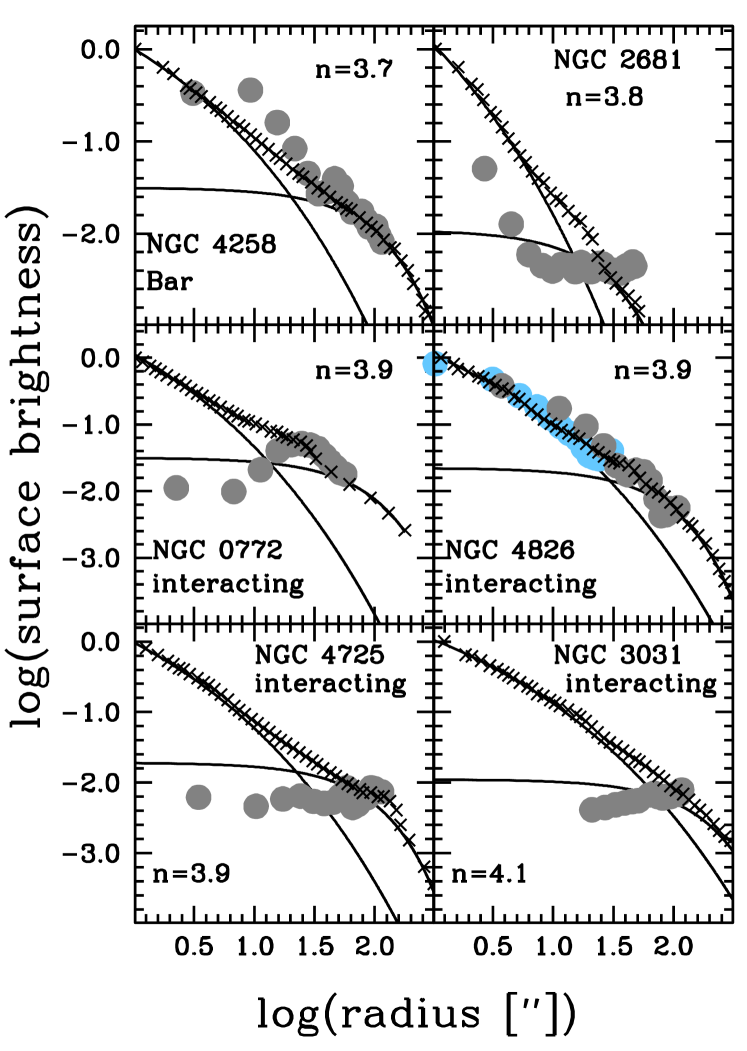
In Fig. 10 we show the first direct comparison of a large number bulge-disk decompositions of stellar light to CO(1-0) surface brightness profiles. The galaxies are arranged in order of increasing Sérsic index. Bulgeless galaxies are first. We label each panel with the galaxy identifier and the Sérsic index. If the galaxy is barred and/or interacting we also include that information in the panel. (Note, if a galaxy is not barred and/or not interacting, then nothing is mentioned to this effect.). The x’s represent the H-band surface brightness profile, and the lines represent the bulge and disk that have been fit to that profile. For ease of comparison we have normalize all stellar surface brightness profiles (and fits) by the surface brightness at 1 ″. The large circles represent the CO(1-0) surface brightness profile. In a the few cases where multiple CO data sets exists from our samples, we plot the higher resolution data set as light blue circles.
The CO(1-0) surface brightness profiles are calculated simply by computing the mean surface brightness in ellipses set to match the center, axial ratio and position angle of the H-band light. The CO(1-0) surface brightness profile is computed in increments of the beam size for each map. Because we are principally interested in the illustrating the relative result, we have shifted the CO profile to match the stellar profile in the outer disk. For the interferometric only data from NUGA & STING we refrain from measuring the surface brightness profiles at scales larger that 45″and 60″respectively, as the data becomes less sensitive to structures larger than this, due to the lack of zero-spacing data.
We classify our CO profiles into the following four categories: (1) profiles in which the CO emission peaks at radii larger than the bulge, (2) profiles in which the CO surface brightness profile follows the exponential profile, (3) profiles in which the CO emission traces the bulge or is brighter than the bulge, and (4) profiles in which the CO emission is between (2) & (3). We strongly caution the reader that in a few cases this classification hinges on a single CO(1-0) beam, and therefore should be taken with a certain degree of skepticism. The classification is given in Table 2.
We first note that 4 of 5 bulgeless galaxies have surface brightness profiles that seem to follow the exponential disk. We find that 55% of our sample galaxies have CO(1-0) surface brightness profiles that are at least as concentrated as the star light, and 40% have CO(1-0) surface brightness profiles that are as steeply concentrated as the corresponding surface brightness profile of stars. This confirms the initial result by Regan et al. (2001) on a much larger sample.
Galaxies with more concentrated CO emission are more likely to be barred. Roughly 70% have bars, only half of the galaxies in our sample with out central concentrations of gas have bars. We find no preference for interacting galaxies to have steeper or less steep CO(1-0) surface brightness profiles. Though this may simply be an artifact of our sample. The majority of galaxies with CO emission that is more concentrated than the near-IR light have bulges with low Sérsic index, roughly 80% have . Conversely, few than half of the galaxies with shallow central surface brightnesses of CO also have bulges with low Sérsic.
The general trend that emerges from examining Fig. 10, that the concentration of CO emission is commonly as concentrated as the star light. This connection between stellar and molecular surface brightness is more common in barred galaxies, however many unbarred disks also show this connection. The direct comparison of CO flux density profiles to bulge-disk decompositions illustrates that as a rule bulges are not gas poor. Quite the contrary, bulges are frequently more than and order of magnitude higher in CO surface brightness than that of the surrounding disk.
The highest ratio of X(Z,W) in the center of the galaxy, versus that averaged over the disk is . In the centrally concentrated galaxies, the central CO surface brightnesses are often more than an order of magnitude greater than the disk. This implies that indeed at least some fraction of pseudobulges are presently increasing the bulge-to-total ratio of their stellar mass. It will be interesting to revisit this result in the future as methods of converting CO(1-0) to molecular hydrogen become more robust.
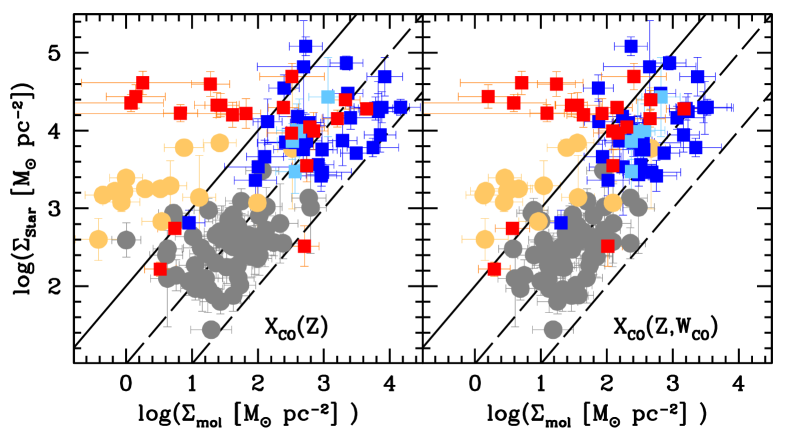
4.2. Gas Density of Bulges
In Fig. 11 we show the stellar mass surface density of pseudobulges (blue squares), classical bulges (red squares), the centers of bulgeless disks (light blue squares), disks beyond the radius of the bulge (grey circles) and elliptical galaxies (gold circles) plotted against gas mass surface density. To construct the list of elliptical galaxies we begin with the sample of Young et al. (2011), which lists all early-type galaxies in the ATLAS3D sample with CO(1-0) detections. We then carry out surface photometry to the stellar light profile, if the bulge-to-total ratio of the stars is greater than 2/3, the galaxy is included in our figure.
In Fig. 11 we wish to compare the total gas density within a given structure to the total stellar density. The boundaries of structures are thus defined by the size in the stellar mass, as follows: bulge sizes are the radius at which the bulge surface brightness equals that of the disk in a bulge-disk decomposition (), disk sizes are defined as an annulus beginning at the bulge radius and extending to 4 times the scale-length of the disk ( in most disks this is very close to the optical radius), and the size of early-type galaxies is twice the half-light radius of the stars. The left panel shows the gas density calculated with X(Z) and the right panel shows the gas density calculated with X(Z,W). The lines represent constant proportionality of 0.01,0.10,1.00 respectively.
In Fig. 11 it is clear that there is not a single behavior that can describe the gas density of all bulges. Some bulges are gas rich, and thus star forming; others have low gas density, relative to both their own stellar density, but also the gas density of disks.
Almost all bulges with low Sersic index have higher gas densities than is typically found in disks. The typical gas density observed in the pseudobulges in this sample is as high and often higher than that typically observed in molecular clouds Bolatto et al. (2008). The average molecular gas density for bulges with Sérsic index, in our sample is M⊙ pc-2 using X(Z) and 179 M⊙ pc-2 with . In fact, 80% of pseudobulges () have surface densities greater than 100 M⊙ pc-2. Pseudobulges appear to extend a relationship between surface density of gas and stars of disks, to higher surface densities, which is to say pseudobulges have similar gas fractions to disks.
Conversely classical bulges seem to have no correlation between gas density and stellar density. This behavior is similar to what is observed in early type galaxies. Crocker et al. (2011) discusses the properties of molecular gas in early type galaxies (see also Young, 2002, 2005; Combes et al., 2007). The high Sérsic bulges span a larger range of gas densities than is observed in pseudobulges. In our sample for we find M⊙ pc-2 using X(Z) and 24 M⊙ pc-2 with . The choice of conversion factor has a stronger impact on the distribution of gas densities in classical bulges. We find using or constant , that 50% of classical bulges have 100 M⊙ pc-2, and only 10% (2 of 19) have that surface density when using .
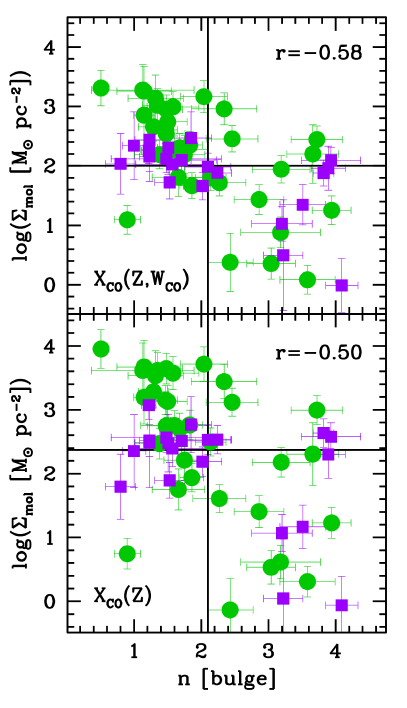
4.3. Correlation of Bulge Molecular Gas Density with Bars and Sérsic Index
Central concentrations of molecular gas are associated with barred disks (Sakamoto et al., 1999; Sheth et al., 2005; Jogee et al., 2005), and bulges with low Sérsic index are associated with high specific star formation rates (Fisher & Drory, 2010). In Fig. 12 we show the dependence of gas density while simultaneous controlling for bar/unbarred disk and the Sérsic index. Gas densities of bulges calculated with X(Z,WCO) are shown in the top panel and X(Z) in the bottom panel. We show bulges in barred galaxies as green circles and bulges in unbarred galaxies as purple squares. In each panel we also plot horizontal and vertical lines. The vertical line corresponds to . The horizontal line corresponds to the median in each panel.
For the total sample we observe a rough correlation between bulge Sérsic index and bulge molecular gas surface density such that bulges with higher Sérsic index have lower gas surface densities. The Pearson’s correlation coefficient is with X(Z,WCO) and with X(Z). There is significant scatter, especially for intermediate Sérsic indices. It may be more accurate to describe the relationship between Sérsic index and molecular gas density of bulges as two separate distributions one scattering around low Sérsic index and high gas density, the other scattering around high Sérsic index and low gas density.
We use multiple methods to identify barred disks. First, we employ visual inspection of -band 2MASS images. We also use the ellipticity profile of the galaxy(described in Jogee et al., 2004; Marinova & Jogee, 2007). In this methods, bars are identified by sharp transitions in the ellipticity profile. We compare our bar identifications to those published in de Vaucouleurs et al. (1991), Sandage & Bedke (1994), Laurikainen et al. (2004), and consider the preponderance of information when categorizing barred galaxies. Laurikainen et al. (2004) differs from de Vaucouleurs et al. (1991) and Sandage & Bedke (1994) in that the former uses bar-induced perturbation strengths to identify bars, whereas de Vaucouleurs et al. (1991); Sandage & Bedke (1994) use visual classification. Also, in comparing our and Laurikainen et al. (2004) classifications to the others, we take into account the known result that bars are more easily identified in the near-IR (e.g. Eskridge et al., 2000, 2002). For the purposes of this exercise we classify ovaled disks (described in Kormendy & Kennicutt, 2004) in the same category as bars. Also, we do not take into account the difference between bars in early- and late-type galaxies (Combes & Elmegreen, 1993).
We find that the ranking from highest to lowest average gas surface density is as follows: the highest gas densities are in bulges with low Sérsic index that reside in barred disks; followed by bulges with in unbarred disks; then bulges with in barred disks; finally the lowest gas density bulges are in those with in disks with no bar. The largest range in gas density exists in those bulges with high Sérsic index residing in barred disks. Not all barred galaxies necessarily have high central densities of gas, and secondly not all bulges with high Sérsic index contain low surface densities of gas.
It is difficult to do statistics of the gas density of classical bulges; this work does not represent a robust sample covering the full range of classical bulge properties. As we discussed in the sample selection, the criteria for the sub-samples in this paper favor IR bright, or blue galaxies, and though adequate for studying the range of gas densities, would be inadequate for presenting a statistical analysis. Fisher & Drory (2011) present a complete sample of bulge-disk galaxies in the local Universe (assuming bulges do not exists in galaxies with total stellar mass lower than 109 M⊙. They find that roughly 15% of bulges with high Sérsic index also have enhanced star formation ( M⊙ yr-1 kpc-2. Their sample, however, only contains 18 galaxies with classical bulges, and therefore also may suffer from poor statistics. At this point, we cannot say how common classical bulges with high densities of gas are, nonetheless it is clear that several disk galaxies contain bulges in which both evidence for a pseudobulge (high gas density) and classical bulge (high Sérsic index) are present and these bulges preferentially are in barred disks.
4.4. Bulge Molecular Gas Density of Interacting Galaxies
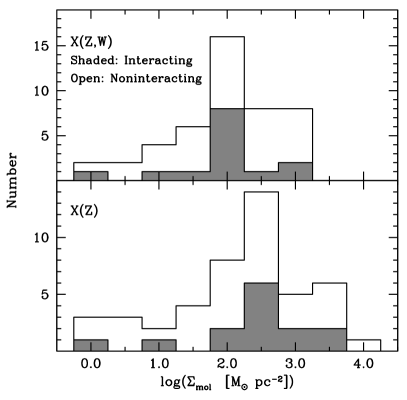
An alternative means of torquing gas in disks is through interactions with other galaxies. For example, Kannappan et al. (2004) show that galaxies with nearby companions are more likely to have blue, star forming centers. In Fig. 13 we show the distribution of bulge molecular gas densities of interacting galaxies (shaded region) in our sample, and those of galaxies that do not show signs of interaction (unshaded region). We classify galaxies as interacting if they show lopsided, or asymmetric features, or if the galaxy has a nearby companion. Our sample selection excludes advanced major mergers. Therefore, the asymmetries in these galaxies will be representative of minor mergers, be they weak-distant gravitational interactions with nearby galaxies in groups or cluster environments or accretion of companions (e.g. M 51). Jogee et al. (2009) finds that the low-z minor merger rate is under 10% per gigayear. We classify 15 of 61 galaxies as interacting. Given that our sample has a slight bias to IR bright galaxies, which are more likely to be interacting, the frequency of interactions in our sample is in agreement with other published minor merger rates.
We find no significant difference between the bulge molecular gas density of interacting galaxies in our sample and those that are not interacting. The average molecular gas density of bulges in interacting galaxies is M⊙ pc-2 using X(Z) and M⊙ pc-2 using X(Z,WCO). These are very similar to both the average for all bulges in the sample, and those bulges that are not interacting.
We re-iterate that our sample likely under represents disk galaxies that are low in gas surface density. However, we can see that the extreme high end of bulge gas surface density does not require that a galaxy be interacting. Of the 10 bulges with the highest molecular gas density only 3 show clear signs of interaction. Conversely, all 10 of the bulges with the highest surface density of molecular gas have bars, independent of whether they are interacting or not.
This result should not be taken to imply that these galaxies have not experienced any minor mergers. Cox et al. (2008) show that the effect on star formation history is a strong function of the parameters of the merger (like galaxy mass ratio). Also, Bournaud & Combes (2002) show that accretion events can incite bar driven secular evolution. Therefore, its possible that a minor merger could relax before the enhanced bulge gas density subsides. We simply point out that high bulge gas densities do not require that the galaxy show clear signs of ongoing interaction.
4.5. Total Gas Fraction
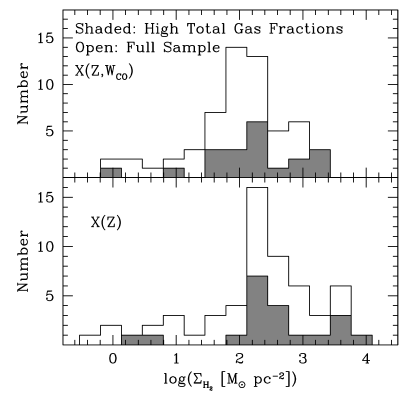
It seems reasonable that the total gas content of a galaxy should affect the gas density in the center. Simply put, independent of what process drives gas to the center of a galaxy if the galaxy has more gas, it will more easily fill the central regions. For total gas masses we use fluxes from Young et al. (1995), such that . In Fig. 14 we overplot the distribution of bulge gas densities for those galaxies with highest 1/3 of gas fractions (shaded region) over the total distribution for all bulge gas densities for our sample (open region).
The mean bulge gas density for galaxies in the highest 1/3 of gas fractions is indeed higher than those with lower total gas fractions. The mean bulge gas density of those galaxies in the 1/3 most gas rich galaxies in our sample is roughly 4-6, for X(Z,WCO) and X(Z) respectively, the mean bulge gas density for galaxies in the 1/3 of our sample with the lowest gas fractions.
It is clear from the histograms in Fig. 14 that having a higher gas fraction makes a galaxy more likely to have a higher bulge molecular gas density. However, galaxies like NGC 4258 can have low total gas fractions, but still have high central gas densities. Furthermore, galaxies with very high gas fractions can also have low central densities of molecular gas. It thus appears that the link between total gas fraction and bulge gas density is not very precise, and certainly not a tight one-to-one correlation. The correlation coefficient between and is for both conversion factors.
4.6. Relationship Between Star Formation and Gas in Bulges
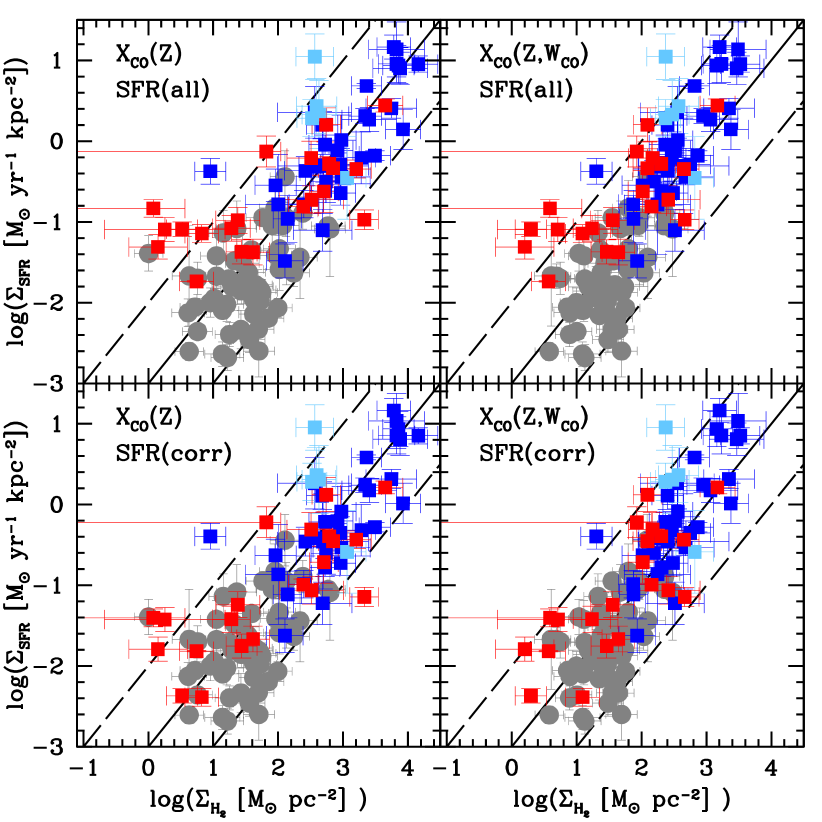
Finally we turn the relationship between bulge star formation rate surface density and gas surface density. Given that the densities of gas in bulges are frequently much higher than what is typical of outer disks we wish to determine if the processing of gas into stars proceeds analogously in bulges as it does in disks.In disks, increasing the molecular gas increases the star formation rate density, roughly linearly (Leroy et al., 2008; Bigiel et al., 2008; Rahman et al., 2012). We can determine if the same is true for bulges, and if the type of bulge has any impact on the rate at which a bulge will consume its gas.
In Fig. 15 we plot the star formation rate density against the molecular gas density for pseudobulges (dark blue squares), classical bulges (red squares), the centers of late-type galaxies (light blue squares) and the outer disks of the galaxies in our sample (grey circles). In the left panels we show molecular gas densities determined with metallicity dependent conversion factor, and in the right panels we plot molecular gas densities with a CO-to-H2 conversion factor that depends upon both gas surface brightness and metallicity. The top panels use the total flux within the bulge to calculate the star formation rate. The bottom panels use the 24 m and fluxes that have been corrected for diffuse emission and old stellar populations to calculate bulge star formation rates. The lines indicate gas consumption times of 0.1,1, and 10 Gyr.
Kennicutt (1998) and also Kormendy & Kennicutt (2004) show the star formation law of nuclear rings in nearby disk galaxies. The overall nature of those star formation laws is similar what is observed in Fig. 15. For the most part, the star formation law of bulges appears to extend the behavior of disks to higher gas densities. Also the way in which bulges make stars does not seem to depend upon the type of bulge in which the gas resides. Pseudobulges, classical bulges and the centers of late-type galaxies all seem to reside on roughly the same correlation. The median gas depletion time, the ratio , for bulges is yr, depending upon the method used (uncorrected star formation rates and the Narayanan et al., 2011 conversion factor yield smaller depletion times). The median depletion times in disks in our sample are similar to those in disks, differing by only 10-15% when using the full flux to calculate the star formation rate, and differing by 20-30% when using the flux that has been corrected for diffuse emission.
The adoption of both the more complex CO-to-H2 conversion factor and diffuse emission correction to the star formation rate appears to reduce the scatter in these plots. This is easy to see by examining the systems with low gas and star formation rate surface density. Moving from the top left to the lower right panels, it is clear that the data has less scatter. We find that the scatter around a median value of the depletion time decreases by a factor of 2.5 depending upon the conversion factor used, where using the conversion factor published in Narayanan et al. (2011) results in lower spread in the depletion times of bulges and disks. It is possible that the nonlinearity in the Narayanan et al. (2011) conversion factor dampens the CO scatter, and thus the reduced scatter is by design.
When averaged over the whole sample the correction for diffuse emission has little impact on the scatter about the correlation between gas and star formation rate densities. However, as we have shown in Fig. 6, the diffuse emission correction systematically affects high stellar mass density - low star forming bulges significantly more, that is to say classical bulges. The diffuse emission correction results in a factor of 3 reduction in the scatter of classical bulges. Furthermore, Fig. 15 shows that correcting for diffuse emission brings classical bulges into better agreement with the correlation for galactic disks.
A power-law fit the entire sample recovers a roughly linear relationship between and that is consistent with the results of Bigiel et al. (2008), also recently Rahman et al. (2012). However, there appears to be a tendency for slightly smaller gas depletion times (or more efficient star formation) in bulges with higher surface density of star formation. The average depletion time, and standard deviation, for the entire sample of bulges and disks in our sample is almost exactly 1 Gyr. When we average only the 10 bulges with the higher star formation rate density we find that the depletion time is smaller by a factor of 2.3 using the Genzel et al. (2012) conversion factor and 4.4 using the Narayanan et al. (2011) conversion factor. Therefore, this result is not large compared to the uncertainty in the measurements of gas mass and star formation rate, and also depends on the conversion factor used. Also, after corrections are applied, we find little-to-no difference in the depletion times of pseudobulges and classical bulges, and only minor differences between bulges and disks.
5. Summary & Discussion
5.1. Summary
In this paper we show that bulges (where bulge is defined as the high density component of the surface brightness profile) are commonly found to have gas densities that span ranges from 1 - 1000 M⊙ pc-2. Fig. 10 shows that in the majority of our sample, when the H-band surface brightness profile transitions from an exponential disk to a steeper bulge, the CO(1-0) surface brightness profile exhibits a similar transition to be more centrally concentrated.
We find that the surface density of gas in bulges is linked to properties of the galaxy, especially the Sérsic index. As shown in Fig. 12, bulges with lower Sérsic index are much more likely to have high surface densities of molecular gas.
Most pseudobulges and a few classical bulges have star formation rate densities in excess of 0.1 M⊙ yr-1 kpc-2. Even after correcting the star formation rate indicator for diffuse emission and the CO-to-H2 conversion factor for CO surface brightness, Fig. 15 shows that some bulges, and a large fraction of our sample, continue to evolve at redshift zero. We find, when using more nuanced metrics of the star formation rate and gas mass, that the ratio of gas-to-star formation rate density of bulges is similar to that of disks (Fig. 15). This result implies that the timescale for processing gas into stars in bulges is not significantly different than that of disks, when measured on the scale of the entire bulge. Therefore, the regulating step in low redshift bulge growth appears to be how the bulge obtains its gas.
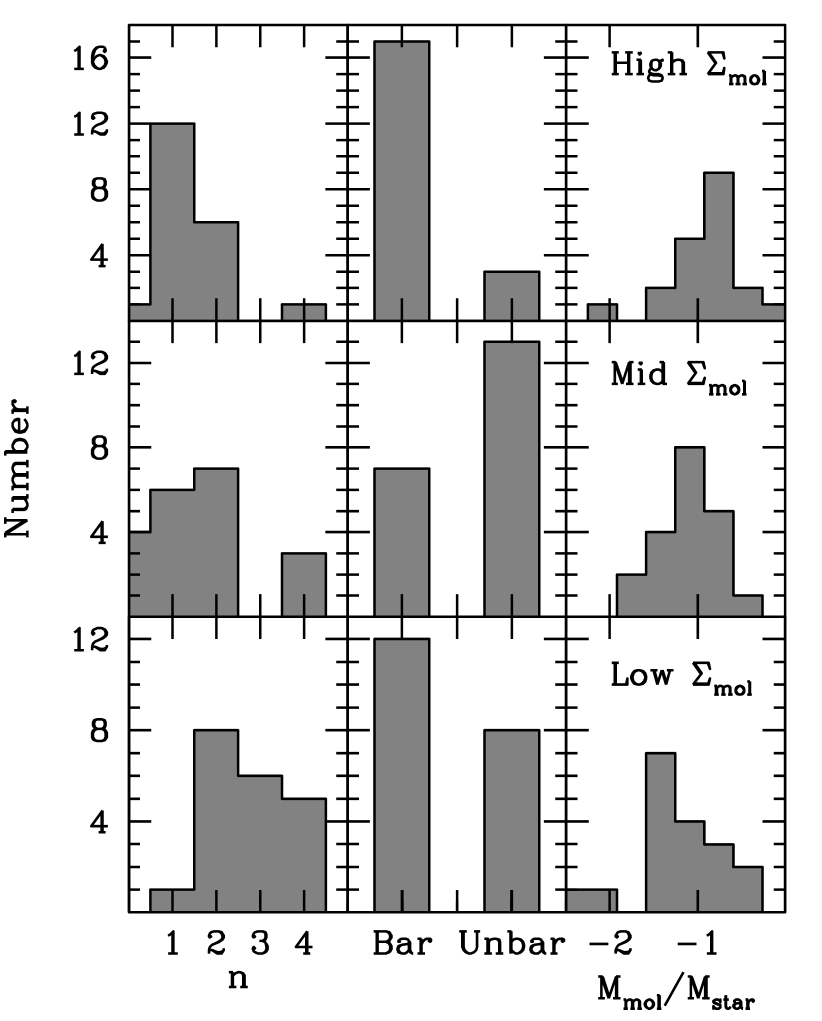
In Fig. 16 we divide the sample into 3 sets of 20 galaxies ranked by gas density of the bulge. From top to bottom, we show the 20 galaxies with highest bulge molecular gas surface density, the 20 galaxies with bulge gas surface densities closest to the median value, and the 20 galaxies with the lowest surface density of gas in the bulge. For each set we show (from left to right) the distribution of Sérsic indices of the bulge, the distribution of barred and unbarred disks, and the distribution of total galaxy molecular gas fractions. For the purposes of this figure, we use the CO-to-molecular gas conversion factor of Narayanan et al. (2011), and we set the Sérsic index of those galaxies with no bulge . The results here change very little based on the CO-to-H2 conversion factor.
Bulges with High Molecular Gas Density: In our sample, galaxies with high molecular gas densities in their bulges almost always have both low Sérsic index () and reside within barred disks. Only 2 of our sample galaxies have high gas surface densities in their bulges and also have high Sérsic indices. Similarly, only 2 galaxies that do not have bars have high surface densities of gas in their centers. There is also a tendency for bulges with high central gas density to be in galaxies with larger total gas fraction.
Bulges with Intermediate Molecular Gas Density: The main difference between galaxies in our sample with intermediate range of bulge gas densities and those with the highest densities of gas in their bulges is the presence of a bar. Galaxies with high densities of gas are far more likely to have a bar than those of intermediate gas density of the bulge. Both high and intermediate gas density bins are predominately low Sérsic index. Both have similar distribution of gas fraction.
Bulges with Low Molecular Gas Density: Contrary to naive assumptions, in our sample the majority (12 of 20) of bulges with low surface density of molecular gas are in barred disks. This number is lower than the bar fraction in general. Our sample is not sufficient to determine the frequency of gas-poor bulges in barred galaxies. However we can show that a barred disk alone does not rule out the possibility that a galaxy will have a gas-poor classical bulge. In Fig. 16 we show that along with higher Sérsic index bulges with low gas surface density typically are in galaxies with lower total molecular gas fractions. A simple argument is that if the galaxy has less gas over all even if a bar is present, it will have less gas to send toward the center. Also, it is possible that the presence of a bulge with a steep density profile (as indicated by larger Sérsic index) would stabilize the gas in the disk, and prevents high central densities of molecular gas. It is also possible that the phenomenon that creates bulges with large Sérsic index also leaves the galaxy with a less molecular gas, and any of new gas that enters through accretion is stabilized against inflow.
5.2. Implications for Bulge Evolution
The results of Fig. 10 shows, as was shown by Regan et al. (2001), that clearly presence of a bulge is not mutually exclusive with dense molecular gas. Bulges are not uniformly old, non-starforming systems. Our sample is a much larger and we include, for the first time, bulge-disk decompositions to star light. Furthermore, it is clear from Fig. 11 that gas mass is not a trivial fraction of the total baryonic mass of bulges. Many bulges are building mass at low redshift. This result is similar to that of (Fisher et al., 2009), who shows that the timescales of pseudobulge growth (based on M) are plausible for secular evolution, but those timescales are orders of magnitude too long for classical bulges. Since bulges have similar depletion times as disks (Fig. 15), the key to understanding low redshift bulge growth is to understand how the gas is driven into the center of a bulge-disk galaxy.
In broad terms there are a few mechanisms that are commonly proposed to explain the bulge-to-total ratios observed in disk galaxies. Those mechanisms include major mergers followed by disk regrowth (e.g. Hammer et al., 2005), direct accretion of satellite galaxies (e.g. Aguerri et al., 2001), internal -or secular- evolution of galactic disks (e.g. Kormendy & Kennicutt, 2004; Athanassoula, 2005), and clump instabilities in gas rich-high redshift-disk galaxies (e.g. Noguchi, 1999). Given the dichotomous nature of bulge properties and the connection of the bulge dichotomy to the galaxy bimodality (Drory & Fisher, 2007), it is reasonable that no one of these theories will explain all bulge mass in all galaxies. Any relevant theory intended to describe the formation of all intermediate type galaxies should account for the observations that many bulges have high densities of gas.
The idea that bulges are a result of the merging process is quite old (Toomre, 1977). Merging as a means to increase is often proposed because galaxy-galaxy interactions occur frequently in both the observed Universe and galaxy evolution models (White & Rees, 1978; Cole et al., 1994; Hammer et al., 2005; Baugh, 2006). In this scenario, the bulge we observe today is formed during the most recent major merger event, and the remaining gas settles around the merger remnant to form the outer disk. Fisher & Drory (2011) find that high star formation rate densities in bulges are much more common than the number of galaxies that experience mergers in a gigayear (roughly 10%, Jogee et al., 2009). Therefore, major mergers on their own (absent subsequent accretion or secular evolution of gas) are not likely to account for the gas in all bulges. However, if we isolate only classical bulges the similarity of classical bulges to elliptical galaxies is striking (Fisher & Drory, 2010). Modern simulations of binary mergers reproduce the details of elliptical galaxies with great detail (e.g. Cox et al., 2006; Naab et al., 2006). In Fig. 11 we show that in terms of gas density, similarities also exist between classical bulges and elliptical galaxies. All bulges with very low surface densities of gas are classical bulges (based on Sérsic index). Furthermore, as we show in Fig. 16 bulges with the lowest gas density have lower than average total molecular gas fractions. Both observations are consistent with the end products of galaxy-galaxy mergers. The intense star formation during a merger could leave a galaxy with a lower gas fraction, providing less gas to fill the center of the galaxy. Furthermore, major mergers tend to increase the cuspiness of the bulge (Hopkins et al., 2009b), which in turn is likely to stabilize a disk. Therefore, after the star formation induced by the merger subsides the bulge would have low gas density, as we observe in classical bulges.
Mergers that result in bulge-disk galaxies are far more likely to occur if the progenitor galaxies have unequal masses Bournaud et al. (2004). Also, Aguerri et al. (2001) outlines how minor mergers can build bulges. Indeed, in modern CDM simulations most disk galaxies acquire stellar mass through minor mergers (e.g. Parry et al., 2009). Those models of galaxy evolution in which the bulge-to-total stellar mass ratio of a galaxy is a function of both mass-ratio and gas-fraction in the merger are well matched to observations (Hopkins et al., 2009c). Cox et al. (2008) show that minor mergers do not experience as dramatic increases in star formation rate, this may leave the galaxy with enough gas to match our observations. Eliche-Moral et al. (2011) shows that minor mergers can produce bulges with disky morphology. However, it remains to be shown that low mass ratio, gas-rich mergers produce bulges with the properties quantitatively similar to observations of pseudobulges (low Sérsic index, scaling relations like those in Fisher & Drory, 2010, realistic gas and star formation rate densities). The kinematics of merger remnants in the simulations of minor mergers in Bournaud et al. (2005) apear more like that expected for classical bulges. Recently Martig et al. (2012) show in simulations of a large sample of disk galaxies, using a “zoom-in resimulation technique,” that more violent merging history results in more prominent bulges. Pseudobulges can be 1/3 of the galaxy mass (Fisher & Drory, 2008), and successive accretion heats and eventually destroys a galactic disk (Kazantzidis et al., 2009; Bournaud et al., 2007).
Elmegreen et al. (2008) finds that end products in clump instability simulations tend to have high Sérsic index. Conversely Inoue & Saitoh (2012) simulates bulges that appear similar to pseudobulges, with low star formation rate at redshift zero. It may be that on its own the clump instability is incapable of forming a low redshift bulge with high densities of gas, however, at this point it is difficult to say.
Simulations show that disk processes are quite capable of driving gas toward the centers of galactic disks (e.g. Simkin et al., 1980; Combes & Gerin, 1985; Athanassoula, 1992; Heller et al., 2007), see also reviews Kormendy & Kennicutt (2004); Athanassoula (2005); Combes (2009). The connection between high central density of gas and bars adds significant credibility to this idea (Sakamoto et al., 1999; Sheth et al., 2005; Jogee et al., 2005, and present work). Our results show that pseudobulges are preferentially gas rich compared to classical bulges. Kormendy & Kennicutt (2004) argues that the similarity between pseudobulge properties to the properties of outer disks are likely due to pseudobulges forming secular evolution. Indeed, in Fig. 11 we show that not only are pseudobulges the mix of stars and ISM are similar in pseudobulges and disks. A possible scenario is that if a gas-rich galaxy forms a bar, and there is no stabilizing bulge with large Sérsic index, the galaxy will then efficiently drive gas toward the center of the disk. The gas then forms stars in a cold-thin disk in the center of the galaxy. Since the gas is at higher densities than the inward extrapolation of the exponential disk (as shown in Fig. 10), the resulting surface density of stars is higher than the exponential disk. Therefore, when we carry out bulge-disk decomposition then the system is found to have a “bulge” in the light profile. Fabricius et al. (2012) show that bulges with low Sérsic index have colder stellar kinematics; also Fisher & Drory (2008) show that bulges with lower Sérsic index are more likely to be flatter. In this work we have shown that bulges with low Sérsic index have higher gas densities. The observations we present here, therefore, do not contradict with the idea that the light that is frequently called bulge light includes a significant component of cold stars that formed though internal star formation, that frequently remains ongoing at .
It is likely that the total mass of a particular bulge could result from multiple phenomena. For example, a galaxy could form a small bulge though a very gas rich merger (as described in Springel & Hernquist, 2005; Hopkins et al., 2009a) or via direct accretion, and then secular evolution could add mass to the pre-existing bulge. Indeed, Bournaud & Combes (2002) shows a simulation in which accretion of a small-gas rich satellite instigates bar formation in a spiral disk, and then would subsequently lead to increased gas density in the center of a disk. Fisher & Drory (2010) finds a sample of bulges that are consistent with systems expectations of mixed systems.
Once the gas is in bulges, from our data, it appears to form stars with similar efficiency as in the main body of the disk. It is possible that multiple effects due to high pressure cancel out at these spatial scales. For example, the intense pressure in bulges could increase the efficiency of star formation inside of molecular clouds in bulges, but also this intense pressure could also generate more molecular gas in diffuse form, outside of molecular clouds (Blitz et al., 2007). Higher resolution observations than we present here are necessary to understand the star formation in bulges at the scale of molecular clouds. Nonetheless, at the scale of bulges (a few kpc) our results suggest that the flow of gas into the center of the galaxy is the main regulating factor for star formation in galaxy centers.
References
- Aguerri et al. (2001) Aguerri, J. A. L., Balcells, M., & Peletier, R. F. 2001, A&A, 367, 428
- Athanassoula (1992) Athanassoula, E. 1992, MNRAS, 259, 345
- Athanassoula (2005) —. 2005, MNRAS, 358, 1477
- Baugh (2006) Baugh, C. M. 2006, Reports on Progress in Physics, 69, 3101
- Bender & Moellenhoff (1987) Bender, R., & Moellenhoff, C. 1987, A&A, 177, 71
- Bertin & Arnouts (1996) Bertin, E., & Arnouts, S. 1996, A&AS, 117, 393
- Bigiel & Blitz (2012) Bigiel, F., & Blitz, L. 2012, ApJ, 756, 183
- Bigiel et al. (2008) Bigiel, F., Leroy, A., Walter, F., Brinks, E., de Blok, W. J. G., Madore, B., & Thornley, M. D. 2008, AJ, 136, 2846
- Blitz et al. (2007) Blitz, L., Fukui, Y., Kawamura, A., Leroy, A., Mizuno, N., & Rosolowsky, E. 2007, Protostars and Planets V, 81
- Bolatto et al. (2011) Bolatto, A. D., Leroy, A. K., Jameson, K., Ostriker, E., Gordon, K., Lawton, B., Stanimirović, S., Israel, F. P., Madden, S. C., Hony, S., Sandstrom, K. M., Bot, C., Rubio, M., Winkler, P. F., Roman-Duval, J., van Loon, J. T., Oliveira, J. M., & Indebetouw, R. 2011, ApJ, 741, 12
- Bolatto et al. (2008) Bolatto, A. D., Leroy, A. K., Rosolowsky, E., Walter, F., & Blitz, L. 2008, ApJ, 686, 948
- Bournaud & Combes (2002) Bournaud, F., & Combes, F. 2002, A&A, 392, 83
- Bournaud et al. (2004) Bournaud, F., Combes, F., & Jog, C. J. 2004, A&A, 418, L27
- Bournaud et al. (2005) Bournaud, F., Jog, C. J., & Combes, F. 2005, A&A, 437, 69
- Bournaud et al. (2007) —. 2007, A&A, 476, 1179
- Braine et al. (1993) Braine, J., Combes, F., Casoli, F., Dupraz, C., Gerin, M., Klein, U., Wielebinski, R., & Brouillet, N. 1993, A&AS, 97, 887
- Bruzual & Charlot (2003) Bruzual, G., & Charlot, S. 2003, MNRAS, 344, 1000
- Buat et al. (2002) Buat, V., Boselli, A., Gavazzi, G., & Bonfanti, C. 2002, A&A, 383, 801
- Calzetti et al. (1995) Calzetti, D., Bohlin, R. C., Kinney, A. L., Storchi-Bergmann, T., & Heckman, T. M. 1995, ApJ, 443, 136
- Calzetti et al. (2007) Calzetti, D., Kennicutt, R. C., Engelbracht, C. W., Leitherer, C., Draine, B. T., Kewley, L., Moustakas, J., Sosey, M., Dale, D. A., Gordon, K. D., Helou, G. X., Hollenbach, D. J., Armus, L., Bendo, G., Bot, C., Buckalew, B., Jarrett, T., Li, A., Meyer, M., Murphy, E. J., Prescott, M., Regan, M. W., Rieke, G. H., Roussel, H., Sheth, K., Smith, J. D. T., Thornley, M. D., & Walter, F. 2007, ApJ, 666, 870
- Caon et al. (1994) Caon, N., Capaccioli, M., & D’Onofrio, M. 1994, A&AS, 106, 199
- Cardelli et al. (1989) Cardelli, J. A., Clayton, G. C., & Mathis, J. S. 1989, ApJ, 345, 245
- Carollo et al. (1997) Carollo, C. M., Stiavelli, M., de Zeeuw, P. T., & Mack, J. 1997, AJ, 114, 2366
- Cole et al. (1994) Cole, S., Aragon-Salamanca, A., Frenk, C. S., Navarro, J. F., & Zepf, S. E. 1994, MNRAS, 271, 781
- Combes (2009) Combes, F. 2009, ArXiv e-prints
- Combes & Elmegreen (1993) Combes, F., & Elmegreen, B. G. 1993, A&A, 271, 391
- Combes & Gerin (1985) Combes, F., & Gerin, M. 1985, A&A, 150, 327
- Combes et al. (1994) Combes, F., Prugniel, P., Rampazzo, R., & Sulentic, J. W. 1994, A&A, 281, 725
- Combes et al. (2007) Combes, F., Young, L. M., & Bureau, M. 2007, MNRAS, 377, 1795
- Courteau et al. (1996) Courteau, S., de Jong, R. S., & Broeils, A. H. 1996, ApJ, 457, L73+
- Cox et al. (2006) Cox, T. J., Jonsson, P., Primack, J. R., & Somerville, R. S. 2006, MNRAS, 373, 1013
- Cox et al. (2008) Cox, T. J., Jonsson, P., Somerville, R. S., Primack, J. R., & Dekel, A. 2008, MNRAS, 384, 386
- Crocker et al. (2011) Crocker, A. F., Bureau, M., Young, L. M., & Combes, F. 2011, MNRAS, 410, 1197
- de Vaucouleurs et al. (1991) de Vaucouleurs, G., de Vaucouleurs, A., Corwin, Jr., H. G., Buta, R. J., Paturel, G., & Fouque, P. 1991, Third Reference Catalogue of Bright Galaxies (Volume 1-3, XII, 2069 pp. 7 figs.. Springer-Verlag Berlin Heidelberg New York)
- Denicoló et al. (2002) Denicoló, G., Terlevich, R., & Terlevich, E. 2002, MNRAS, 330, 69
- Drory et al. (2004) Drory, N., Bender, R., & Hopp, U. 2004, ApJ, 616, L103
- Drory & Fisher (2007) Drory, N., & Fisher, D. B. 2007, ApJ, 664, 640
- Elfhag et al. (1996) Elfhag, T., Booth, R. S., Hoeglund, B., Johansson, L. E. B., & Sandqvist, A. 1996, A&AS, 115, 439
- Eliche-Moral et al. (2011) Eliche-Moral, M. C., González-García, A. C., Balcells, M., Aguerri, J. A. L., Gallego, J., Zamorano, J., & Prieto, M. 2011, A&A, 533, A104
- Elmegreen et al. (2008) Elmegreen, B. G., Bournaud, F., & Elmegreen, D. M. 2008, ApJ, 688, 67
- Engelbracht et al. (2008) Engelbracht, C. W., Rieke, G. H., Gordon, K. D., Smith, J.-D. T., Werner, M. W., Moustakas, J., Willmer, C. N. A., & Vanzi, L. 2008, ApJ, 678, 804
- Erwin et al. (2005) Erwin, P., Beckman, J. E., & Pohlen, M. 2005, ApJ, 626, L81
- Eskridge et al. (2002) Eskridge, P. B., Frogel, J. A., Pogge, R. W., Quillen, A. C., Berlind, A. A., Davies, R. L., DePoy, D. L., Gilbert, K. M., Houdashelt, M. L., Kuchinski, L. E., Ramírez, S. V., Sellgren, K., Stutz, A., Terndrup, D. M., & Tiede, G. P. 2002, ApJS, 143, 73
- Eskridge et al. (2000) Eskridge, P. B., Frogel, J. A., Pogge, R. W., Quillen, A. C., Davies, R. L., DePoy, D. L., Houdashelt, M. L., Kuchinski, L. E., Ramírez, S. V., Sellgren, K., Terndrup, D. M., & Tiede, G. P. 2000, AJ, 119, 536
- Espada et al. (2010) Espada, D., Martin, S., Hsieh, P.-Y., Ho, P. T. P., Matsushita, S., Verdes-Montenegro, L., Sabater, J., Verley, S., Krips, M., & Espigares, V. 2010, in Galaxies and their Masks, ed. D. L. Block, K. C. Freeman, & I. Puerari, 97
- Fabricius et al. (2012) Fabricius, M. H., Saglia, R. P., Fisher, D. B., Drory, N., Bender, R., & Hopp, U. 2012, ApJ, 754, 67
- Fisher (2006) Fisher, D. B. 2006, ApJ, 642, L17
- Fisher & Drory (2008) Fisher, D. B., & Drory, N. 2008, AJ, 136, 773
- Fisher & Drory (2010) —. 2010, ApJ, 716, 942
- Fisher & Drory (2011) —. 2011, ApJ, 733, L47
- Fisher et al. (2009) Fisher, D. B., Drory, N., & Fabricius, M. H. 2009, ApJ, 697, 630
- Friedli (1999) Friedli, D. 1999, in Astronomical Society of the Pacific Conference Series, Vol. 187, The Evolution of Galaxies on Cosmological Timescales, ed. J. E. Beckman & T. J. Mahoney, 88–99
- Gadotti (2008) Gadotti, D. A. 2008, in IAU Symposium, Vol. 245, IAU Symposium, ed. M. Bureau, E. Athanassoula, & B. Barbuy, 117–120
- Gadotti (2009) Gadotti, D. A. 2009, MNRAS, 393, 1531
- Gadotti & dos Anjos (2001) Gadotti, D. A., & dos Anjos, S. 2001, AJ, 122, 1298
- Ganda et al. (2007) Ganda, K., Peletier, R. F., McDermid, R. M., Falcón-Barroso, J., de Zeeuw, P. T., Bacon, R., Cappellari, M., Davies, R. L., Emsellem, E., Krajnović, D., Kuntschner, H., Sarzi, M., & van de Ven, G. 2007, MNRAS, 380, 506
- García-Burillo et al. (2003) García-Burillo, S., Combes, F., Eckart, A., Tacconi, L. J., Hunt, L. K., Leon, S., Baker, A. J., Englmaier, P. P., Boone, F., Schinnerer, E., & Neri, R. 2003, in Astronomical Society of the Pacific Conference Series, Vol. 290, Active Galactic Nuclei: From Central Engine to Host Galaxy, ed. S. Collin, F. Combes, & I. Shlosman, 423
- García-Burillo et al. (1999) García-Burillo, S., Combes, F., & Neri, R. 1999, A&A, 343, 740
- García-Burillo et al. (2005) García-Burillo, S., Combes, F., Schinnerer, E., Boone, F., & Hunt, L. K. 2005, A&A, 441, 1011
- Garnett (2002) Garnett, D. R. 2002, ApJ, 581, 1019
- Genzel et al. (2012) Genzel, R., Tacconi, L. J., Combes, F., Bolatto, A., Neri, R., Sternberg, A., Cooper, M. C., Bouché, N., Bournaud, F., Burkert, A., Comerford, J., Cox, P., Davis, M., Förster Schreiber, N. M., Garcia-Burillo, S., Gracia-Carpio, J., Lutz, D., Naab, T., Newman, S., Saintonge, A., Shapiro, K., Shapley, A., & Weiner, B. 2012, ApJ, 746, 69
- Gil de Paz et al. (2007) Gil de Paz, A., Boissier, S., Madore, B. F., Seibert, M., Joe, Y. H., Boselli, A., Wyder, T. K., Thilker, D., Bianchi, L., Rey, S.-C., Rich, R. M., Barlow, T. A., Conrow, T., Forster, K., Friedman, P. G., Martin, D. C., Morrissey, P., Neff, S. G., Schiminovich, D., Small, T., Donas, J., Heckman, T. M., Lee, Y.-W., Milliard, B., Szalay, A. S., & Yi, S. 2007, ApJS, 173, 185
- Graham & Driver (2005) Graham, A. W., & Driver, S. P. 2005, Publications of the Astronomical Society of Australia, 22, 118
- Groves et al. (2012) Groves, B., Krause, O., Sandstrom, K., Schmiedeke, A., Leroy, A., Linz, H., Kapala, M., Rix, H.-W., Schinnerer, E., Tabatabaei, F., Walter, F., & da Cunha, E. 2012, ArXiv e-prints
- Haan et al. (2009) Haan, S., Schinnerer, E., Emsellem, E., García-Burillo, S., Combes, F., Mundell, C. G., & Rix, H.-W. 2009, ApJ, 692, 1623
- Hammer et al. (2005) Hammer, F., Flores, H., Elbaz, D., Zheng, X. Z., Liang, Y. C., & Cesarsky, C. 2005, A&A, 430, 115
- Helfer et al. (2003) Helfer, T. T., Thornley, M. D., Regan, M. W., Wong, T., Sheth, K., Vogel, S. N., Blitz, L., & Bock, D. C.-J. 2003, ApJS, 145, 259
- Heller et al. (2007) Heller, C. H., Shlosman, I., & Athanassoula, E. 2007, ApJ, 671, 226
- Hopkins et al. (2009a) Hopkins, P. F., Cox, T. J., Younger, J. D., & Hernquist, L. 2009a, ApJ, 691, 1168
- Hopkins et al. (2009b) Hopkins, P. F., Hernquist, L., Cox, T. J., Keres, D., & Wuyts, S. 2009b, ApJ, 691, 1424
- Hopkins et al. (2009c) Hopkins, P. F., Somerville, R. S., Cox, T. J., Hernquist, L., Jogee, S., Kereš, D., Ma, C., Robertson, B., & Stewart, K. 2009c, MNRAS, 397, 802
- Hunt et al. (2008) Hunt, L. K., Combes, F., García-Burillo, S., Schinnerer, E., Krips, M., Baker, A. J., Boone, F., Eckart, A., Léon, S., Neri, R., & Tacconi, L. J. 2008, A&A, 482, 133
- Inoue & Saitoh (2012) Inoue, S., & Saitoh, T. R. 2012, MNRAS, 2819
- Israel (2009a) Israel, F. P. 2009a, A&A, 493, 525
- Israel (2009b) —. 2009b, A&A, 506, 689
- Jarrett et al. (2003) Jarrett, T. H., Chester, T., Cutri, R., Schneider, S. E., & Huchra, J. P. 2003, AJ, 125, 525
- Jogee et al. (2004) Jogee, S., Barazza, F. D., Rix, H.-W., Shlosman, I., Barden, M., Wolf, C., Davies, J., Heyer, I., Beckwith, S. V. W., Bell, E. F., Borch, A., Caldwell, J. A. R., Conselice, C. J., Dahlen, T., Häussler, B., Heymans, C., Jahnke, K., Knapen, J. H., Laine, S., Lubell, G. M., Mobasher, B., McIntosh, D. H., Meisenheimer, K., Peng, C. Y., Ravindranath, S., Sanchez, S. F., Somerville, R. S., & Wisotzki, L. 2004, ApJ, 615, L105
- Jogee et al. (2005) Jogee, S., Scoville, N., & Kenney, J. D. P. 2005, ApJ, 630, 837
- Jogee et al. (2009) Jogee et al. 2009, ApJ, 697, 1971
- Kannappan et al. (2004) Kannappan, S. J., Jansen, R. A., & Barton, E. J. 2004, AJ, 127, 1371
- Kazantzidis et al. (2009) Kazantzidis, S., Zentner, A. R., Kravtsov, A. V., Bullock, J. S., & Debattista, V. P. 2009, ApJ, 700, 1896
- Kennicutt (1998) Kennicutt, R. C. 1998, ApJ, 498, 541
- Kennicutt et al. (2003) Kennicutt, R. C., Armus, L., Bendo, G., Calzetti, D., Dale, D. A., Draine, B. T., Engelbracht, C. W., Gordon, K. D., Grauer, A. D., Helou, G., Hollenbach, D. J., Jarrett, T. H., Kewley, L. J., Leitherer, C., Li, A., Malhotra, S., Regan, M. W., Rieke, G. H., Rieke, M. J., Roussel, H., Smith, J.-D. T., Thornley, M. D., & Walter, F. 2003, PASP, 115, 928
- Kennicutt et al. (2011) Kennicutt, R. C., Calzetti, D., Aniano, G., Appleton, P., Armus, L., Beirão, P., Bolatto, A. D., Brandl, B., Crocker, A., Croxall, K., Dale, D. A., Meyer, J. D., Draine, B. T., Engelbracht, C. W., Galametz, M., Gordon, K. D., Groves, B., Hao, C.-N., Helou, G., Hinz, J., Hunt, L. K., Johnson, B., Koda, J., Krause, O., Leroy, A. K., Li, Y., Meidt, S., Montiel, E., Murphy, E. J., Rahman, N., Rix, H.-W., Roussel, H., Sandstrom, K., Sauvage, M., Schinnerer, E., Skibba, R., Smith, J. D. T., Srinivasan, S., Vigroux, L., Walter, F., Wilson, C. D., Wolfire, M., & Zibetti, S. 2011, PASP, 123, 1347
- Kennicutt et al. (2009) Kennicutt, R. C., Hao, C., Calzetti, D., Moustakas, J., Dale, D. A., Bendo, G., Engelbracht, C. W., Johnson, B. D., & Lee, J. C. 2009, ApJ, 703, 1672
- Kennicutt & Evans (2012) Kennicutt, Jr., R. C., & Evans, II, N. J. 2012, ArXiv e-prints
- Kewley & Ellison (2008) Kewley, L. J., & Ellison, S. L. 2008, ApJ, 681, 1183
- Kobulnicky & Kewley (2004) Kobulnicky, H. A., & Kewley, L. J. 2004, ApJ, 617, 240
- Komugi et al. (2008) Komugi, S., Sofue, Y., Kohno, K., Nakanishi, H., Onodera, S., Egusa, F., & Muraoka, K. 2008, ApJS, 178, 225
- Kormendy (1982) Kormendy, J. 1982, in Saas-Fee Advanced Course 12: Morphology and Dynamics of GalaxiesSaas-Fee Vol. 12: Morphology and Dynamics of Galaxies, 113–288
- Kormendy (1993) Kormendy, J. 1993, in IAU Symp. 153: Galactic Bulges, 209–+
- Kormendy et al. (2009) Kormendy, J., Fisher, D. B., Cornell, M. E., & Bender, R. 2009, ApJS, 182, 216
- Kormendy & Kennicutt (2004) Kormendy, J., & Kennicutt, R. C. 2004, ARA&A, 42, 603
- Laurikainen et al. (2004) Laurikainen, E., Salo, H., Buta, R., & Vasylyev, S. 2004, MNRAS, 355, 1251
- Leroy et al. (2005) Leroy, A., Bolatto, A. D., Simon, J. D., & Blitz, L. 2005, ApJ, 625, 763
- Leroy et al. (2012) Leroy, A. K., Bigiel, F., de Blok, W. J. G., Boissier, S., Bolatto, A., Brinks, E., Madore, B., Munoz-Mateos, J.-C., Murphy, E., Sandstrom, K., Schruba, A., & Walter, F. 2012, ArXiv e-prints
- Leroy et al. (2011) Leroy, A. K., Bolatto, A., Gordon, K., Sandstrom, K., Gratier, P., Rosolowsky, E., Engelbracht, C. W., Mizuno, N., Corbelli, E., Fukui, Y., & Kawamura, A. 2011, ApJ, 737, 12
- Leroy et al. (2009) Leroy, A. K., Walter, F., Bigiel, F., Usero, A., Weiss, A., Brinks, E., de Blok, W. J. G., Kennicutt, R. C., Schuster, K.-F., Kramer, C., Wiesemeyer, H. W., & Roussel, H. 2009, AJ, 137, 4670
- Leroy et al. (2008) Leroy, A. K., Walter, F., Brinks, E., Bigiel, F., de Blok, W. J. G., Madore, B., & Thornley, M. D. 2008, AJ, 136, 2782
- MacArthur et al. (2003) MacArthur, L. A., Courteau, S., & Holtzman, J. A. 2003, ApJ, 582, 689
- MacArthur et al. (2009) MacArthur, L. A., González, J. J., & Courteau, S. 2009, MNRAS, 395, 28
- Maloney & Black (1988) Maloney, P., & Black, J. H. 1988, ApJ, 325, 389
- Marinova & Jogee (2007) Marinova, I., & Jogee, S. 2007, ApJ, 659, 1176
- Martig et al. (2012) Martig, M., Bournaud, F., Croton, D. J., Dekel, A., & Teyssier, R. 2012, ArXiv e-prints
- Meier et al. (2010) Meier, D. S., Turner, J. L., Beck, S. C., Gorjian, V., Tsai, C.-W., & Van Dyk, S. D. 2010, AJ, 140, 1294
- Moustakas et al. (2010) Moustakas, J., Kennicutt, Jr., R. C., Tremonti, C. A., Dale, D. A., Smith, J.-D. T., & Calzetti, D. 2010, ApJS, 190, 233
- Naab et al. (2006) Naab, T., Khochfar, S., & Burkert, A. 2006, ApJ, 636, L81
- Narayanan et al. (2011) Narayanan, D., Krumholz, M., Ostriker, E. C., & Hernquist, L. 2011, MNRAS, 418, 664
- Noguchi (1999) Noguchi, M. 1999, ApJ, 514, 77
- Oh et al. (2012) Oh, S., Oh, K., & Yi, S. K. 2012, ApJS, 198, 4
- Parry et al. (2009) Parry, O. H., Eke, V. R., & Frenk, C. S. 2009, MNRAS, 396, 1972
- Peletier & Balcells (1996) Peletier, R. F., & Balcells, M. 1996, AJ, 111, 2238
- Pilyugin et al. (2006) Pilyugin, L. S., Thuan, T. X., & Vílchez, J. M. 2006, MNRAS, 367, 1139
- Prieto et al. (2008) Prieto, J. L., Stanek, K. Z., & Beacom, J. F. 2008, ApJ, 673, 999
- Rahman et al. (2012) Rahman, N., Bolatto, A. D., Xue, R., Wong, T., Leroy, A. K., Walter, F., Bigiel, F., Rosolowsky, E., Fisher, D. B., Vogel, S. N., Blitz, L., West, A. A., & Ott, J. 2012, ApJ, 745, 183
- Regan et al. (2001) Regan, M. W., Thornley, M. D., Helfer, T. T., Sheth, K., Wong, T., Vogel, S. N., Blitz, L., & Bock, D. C.-J. 2001, ApJ, 561, 218
- Regan et al. (1997) Regan, M. W., Vogel, S. N., & Teuben, P. J. 1997, ApJ, 482, L143+
- Saglia et al. (2010) Saglia, R. P., Fabricius, M., Bender, R., Montalto, M., Lee, C.-H., Riffeser, A., Seitz, S., Morganti, L., Gerhard, O., & Hopp, U. 2010, A&A, 509, A61
- Sakamoto et al. (1999) Sakamoto, K., Okumura, S. K., Ishizuki, S., & Scoville, N. Z. 1999, ApJ, 525, 691
- Salim et al. (2007) Salim, S., Rich, R. M., Charlot, S., Brinchmann, J., Johnson, B. D., Schiminovich, D., Seibert, M., Mallery, R., Heckman, T. M., Forster, K., Friedman, P. G., Martin, D. C., Morrissey, P., Neff, S. G., Small, T., Wyder, T. K., Bianchi, L., Donas, J., Lee, Y.-W., Madore, B. F., Milliard, B., Szalay, A. S., Welsh, B. Y., & Yi, S. K. 2007, ApJS, 173, 267
- Sandage & Bedke (1994) Sandage, A., & Bedke, J. 1994, The Carnegie atlas of galaxies (Washington, DC: Carnegie Institution of Washington with The Flintridge Foundation, —c1994)
- Sanders et al. (2003) Sanders, D. B., Mazzarella, J. M., Kim, D.-C., Surace, J. A., & Soifer, B. T. 2003, AJ, 126, 1607
- Schlegel et al. (1998) Schlegel, D. J., Finkbeiner, D. P., & Davis, M. 1998, ApJ, 500, 525
- Schruba et al. (2011) Schruba, A., Leroy, A. K., Walter, F., Bigiel, F., Brinks, E., de Blok, W. J. G., Dumas, G., Kramer, C., Rosolowsky, E., Sandstrom, K., Schuster, K., Usero, A., Weiss, A., & Wiesemeyer, H. 2011, AJ, 142, 37
- Shen & Sellwood (2004) Shen, J., & Sellwood, J. A. 2004, ApJ, 604, 614
- Sheth et al. (2005) Sheth, K., Vogel, S. N., Regan, M. W., Thornley, M. D., & Teuben, P. J. 2005, ApJ, 632, 217
- Simien & de Vaucouleurs (1986) Simien, F., & de Vaucouleurs, G. 1986, ApJ, 302, 564
- Simkin et al. (1980) Simkin, S. M., Su, H. J., & Schwarz, M. P. 1980, ApJ, 237, 404
- Solomon et al. (1997) Solomon, P. M., Downes, D., Radford, S. J. E., & Barrett, J. W. 1997, ApJ, 478, 144
- Springel & Hernquist (2005) Springel, V., & Hernquist, L. 2005, ApJ, 622, L9
- Tacconi et al. (2008) Tacconi, L. J., Genzel, R., Smail, I., Neri, R., Chapman, S. C., Ivison, R. J., Blain, A., Cox, P., Omont, A., Bertoldi, F., Greve, T., Förster Schreiber, N. M., Genel, S., Lutz, D., Swinbank, A. M., Shapley, A. E., Erb, D. K., Cimatti, A., Daddi, E., & Baker, A. J. 2008, ApJ, 680, 246
- Toomre (1977) Toomre, A. 1977, in Evolution of Galaxies and Stellar Populations, ed. B. M. Tinsley & R. B. Larson, 401–+
- Tremonti et al. (2004) Tremonti, C. A., Heckman, T. M., Kauffmann, G., Brinchmann, J., Charlot, S., White, S. D. M., Seibert, M., Peng, E. W., Schlegel, D. J., Uomoto, A., Fukugita, M., & Brinkmann, J. 2004, ApJ, 613, 898
- van der Kruit & Searle (1981) van der Kruit, P. C., & Searle, L. 1981, A&A, 95, 105
- Wang et al. (2012) Wang, J., Kauffmann, G., Overzier, R., Tacconi, L. J., Kong, X., Saintonge, A., Catinella, B., Schiminovich, D., Moran, S. M., & Johnson, B. 2012, MNRAS, 423, 3486
- Welch et al. (1996) Welch, W. J., Thornton, D. D., Plambeck, R. L., Wright, M. C. H., Lugten, J., Urry, L., Fleming, M., Hoffman, W., Hudson, J., Lum, W. T., Forster, J. . R., Thatte, N., Zhang, X., Zivanovic, S., Snyder, L., Crutcher, R., Lo, K. Y., Wakker, B., Stupar, M., Sault, R., Miao, Y., Rao, R., Wan, K., Dickel, H. R., Blitz, L., Vogel, S. N., Mundy, L., Erickson, W., Teuben, P. J., Morgan, J., Helfer, T., Looney, L., de Gues, E., Grossman, A., Howe, J. E., Pound, M., & Regan, M. 1996, PASP, 108, 93
- White & Rees (1978) White, S. D. M., & Rees, M. J. 1978, MNRAS, 183, 341
- Young & Scoville (1991) Young, J. S., & Scoville, N. Z. 1991, ARA&A, 29, 581
- Young et al. (1995) Young, J. S., Xie, S., Tacconi, L., Knezek, P., Viscuso, P., Tacconi-Garman, L., Scoville, N., Schneider, S., Schloerb, F. P., Lord, S., Lesser, A., Kenney, J., Huang, Y.-L., Devereux, N., Claussen, M., Case, J., Carpenter, J., Berry, M., & Allen, L. 1995, ApJS, 98, 219
- Young (2002) Young, L. M. 2002, AJ, 124, 788
- Young (2005) —. 2005, ApJ, 634, 258
- Young et al. (2011) Young, L. M., Bureau, M., Davis, T. A., Combes, F., McDermid, R. M., Alatalo, K., Blitz, L., Bois, M., Bournaud, F., Cappellari, M., Davies, R. L., de Zeeuw, P. T., Emsellem, E., Khochfar, S., Krajnović, D., Kuntschner, H., Lablanche, P.-Y., Morganti, R., Naab, T., Oosterloo, T., Sarzi, M., Scott, N., Serra, P., & Weijmans, A.-M. 2011, MNRAS, 414, 940
- Zhang (1999) Zhang, X. 1999, ApJ, 518, 613
| Galaxy | Survey | Distance | 12+log(O/H) | MH | MH | SCO | SCO(b)(b)Total SCO Reference: (8) Braine et al. (1993); (9) Elfhag et al. (1996); (10) Leroy et al. (2005); (11) Leroy et al. (2008); (12) Sheth et al. (2005); (13) This work; (14) Young et al. (1995) | log(LFUV) | log(LFUV) | log(L24) | log(L24) |
|---|---|---|---|---|---|---|---|---|---|---|---|
| Name | (Mpc) | (a)(a)Metallicity adjusted to Kobulnicky & Kewley (2004). Reference: (1) Denicoló et al. (2002); (2) Engelbracht et al. (2008); (3) Garnett (2002); (4) Moustakas et al. (2010); (5) Pilyugin et al. (2006); (6) Prieto et al. (2008); (7) Metallicity derived from Mass-Metallicity relationship in Tremonti et al. (2004). | (mag) | (mag) | (Jy km s-1) | (Jy km s-1) | (erg s-1) | (erg s-1) | (erg s-1) | (erg s-1) | |
| Bulge | Total | Bulge | Total | Bulge | Total | Bulge | Total | ||||
| NGC0337 | STING | 20.3 | 9.01 (4) | -19.0 0.2 | -22.2 0.2 | 2.3 1.2 | 55.46 14.38 (9) | 41.67 0.16 | 42.91 0.17 | 42.07 0.05 | 43.14 0.05 |
| NGC0628 | SONG | 8.2 | 9.01 (4) | -20.0 0.2 | -22.7 0.2 | 69.0 26.7 | 2160 700 (14) | 41.16 0.06 | 43.00 0.06 | 40.76 0.06 | 42.63 0.06 |
| NGC0772 | STING | 27.1 | 8.63 (7) | -22.6 0.6 | -25.3 1.3 | 36.7 24.6 | 1610 310 (14) | 41.89 0.16 | 43.69 0.16 | 43.24 0.47 | 44.29 0.48 |
| NGC0925 | SONG | 8.6 | 8.64 (7) | -17.6 0.2 | -21.6 0.2 | 0.7 0.2 | 900 480 (11) | 41.80 0.05 | 42.95 0.05 | 41.07 0.06 | 42.49 0.06 |
| NGC1156 | STING | 7.8 | 9.17 (4) | -17.3 0.2 | -20.1 0.1 | 1.5 0.7 | 24.957 5.25 (10) | 41.28 0.12 | 42.42 0.13 | 42.54 0.06 | 43.03 0.06 |
| NGC1637 | STING | 9.9 | 8.59 (2) | -18.8 0.9 | -21.7 0.2 | 66.6 13.1 | 68.3 3.678 (8) | — | — | 42.24 0.07 | 42.71 0.07 |
| NGC2403 | SONG | 3.6 | 9.00 (4) | -15.3 0.3 | -21.6 0.2 | 1.6 1.7 | 540 180 (14) | 39.65 0.31 | 42.88 0.33 | 39.69 0.25 | 42.45 0.26 |
| NGC2681 | STING | 17.2 | 8.61 (7) | -22.6 0.3 | -23.4 0.4 | 82.8 2.4 | 210 40 (14) | 41.97 0.11 | 42.32 0.11 | 42.74 0.05 | 42.86 0.05 |
| NGC2782 | STING | 37.3 | 8.51 (7) | -22.6 0.3 | -24.0 0.3 | 35.6 1.4 | 230 40 (14) | 43.09 0.12 | 43.49 0.12 | 43.73 0.05 | 43.90 0.05 |
| NGC2841 | SONG | 13.7 | 9.03 (4) | -22.6 0.3 | -24.7 0.2 | 1.2 2.6 | 5160 600 (14) | 41.79 0.05 | 43.02 0.05 | 41.62 0.07 | 42.86 0.07 |
| NGC2903 | SONG | 9.4 | 8.84 (4) | -20.5 0.1 | -23.2 0.1 | 236.6 110.7 | 2740 910 (14) | 41.28 0.09 | 43.07 0.09 | 42.94 0.08 | 43.37 0.09 |
| NGC2976 | SONG | 3.6 | 8.86 (3) | -17.5 0.3 | -20.4 0.1 | 43.0 9.5 | 610 140 (14) | 41.17 0.11 | 41.99 0.11 | 41.70 0.06 | 42.68 0.06 |
| NGC3031 | SONG | 3.7 | 8.67 (7) | -22.5 0.3 | -23.9 0.3 | 9.0 8.3 | 6138 600 (12) | 41.12 0.05 | 42.10 0.05 | 41.77 0.05 | 42.45 0.05 |
| NGC3147 | NUGA | 43.1 | 8.96 (4) | -24.2 0.47 | -25.6 0.2 | 20.7 3.1 | 1360 300 (14) | 42.14 0.13 | 43.72 0.13 | 42.88 0.06 | 43.93 0.06 |
| NGC3184 | SONG | 11.5 | 9.13 (4) | -18.8 0.4 | -22.9 0.1 | 31.1 17.1 | 1120 320 (14) | 41.25 0.06 | 43.13 0.07 | 41.73 0.09 | 42.85 0.09 |
| NGC3198 | STING | 14.5 | 8.57 (7) | -19.5 0.5 | -23.1 0.1 | 54.3 7.6 | 900 100 (11) | 40.68 0.15 | 43.61 0.16 | 42.38 0.05 | 43.04 0.05 |
| NGC3344 | SONG | 6.1 | 9.20 (4) | -18.4 0.5 | -21.5 0.2 | ¡3.1 | 520 130 (14) | 40.98 0.06 | 42.52 0.07 | 41.48 0.08 | 42.32 0.08 |
| NGC3351 | SONG | 9.8 | 8.69 (7) | -21.2 0.3 | -23.3 0.5 | 278.4 53.5 | 700 190 (14) | 42.01 0.05 | 42.66 0.05 | 42.86 0.12 | 43.05 0.12 |
| NGC3368 | SONG | 10.9 | 8.75 (3) | -22.5 0.2 | -23.3 0.2 | 631.9 10.3 | 733 200 (13) | 41.25 0.05 | 42.65 0.05 | 42.16 0.06 | 42.52 0.06 |
| NGC3486 | STING | 13.7 | 8.66 (7) | -21.3 0.7 | -22.3 0.6 | 8.9 3.6 | 480 240 (14) | 41.96 0.18 | 43.76 0.19 | 41.69 0.06 | 42.84 0.06 |
| NGC3521 | SONG | 12.2 | 8.91 (3) | -22.1 0.7 | -24.4 0.3 | 56.4 56.4 | 4920 1400 (14) | 40.87 0.07 | 43.09 0.07 | 41.80 0.08 | 43.59 0.09 |
| NGC3593 | STING | 5.5 | 8.67 (7) | -20.3 0.1 | -21.3 0.3 | 434.7 19.8 | 910 160 (14) | 40.79 0.10 | 41.22 0.10 | 42.33 0.09 | 42.39 0.09 |
| NGC3627 | SONG | 10.1 | 8.43 (5) | -21.6 0.3 | -23.7 0.2 | 327.2 83.2 | 4660 1540 (14) | 42.46 0.10 | 44.17 0.10 | 42.40 0.06 | 43.42 0.07 |
| NGC3726 | SONG | 15.6 | 9.15 (4) | -19.2 0.4 | -22.9 0.2 | 16.3 8.0 | 720 180 (14) | 41.66 0.05 | 43.25 0.05 | 41.79 0.11 | 42.81 0.11 |
| NGC3938 | SONG | 17.9 | 8.59 (7) | -20.2 0.2 | -23.4 0.1 | 19.6 17.5 | 1750 450 (14) | 41.21 0.05 | 43.56 0.05 | 41.30 0.13 | 43.23 0.14 |
| NGC3949 | STING | 18.5 | 8.53 (7) | -19.7 0.2 | -22.5 0.3 | 3.5 4.2 | 220 40 (14) | 41.84 0.27 | 43.65 0.28 | 42.49 0.36 | 43.87 0.38 |
| NGC3953 | SONG | 17.3 | 8.54 (7) | -22.0 0.9 | -24.3 0.4 | ¡0.2 | 1790 450 (14) | — | — | 41.59 0.06 | 43.10 0.07 |
| NGC3992 | SONG | 24.9 | 8.68 (6) | -22.6 0.7 | -25.2 0.6 | 0.8 0.2 | 232 20 (12) | — | — | 41.60 0.05 | 42.97 0.05 |
| NGC4254 | STING | 14.4 | 8.81 (4) | -21.8 0.5 | -23.6 0.5 | 351.2 46.5 | 3000 850 (14) | 42.03 0.10 | 43.59 0.11 | 42.56 0.05 | 43.61 0.05 |
| NGC4258 | SONG | 7.5 | 9.19 (4) | -21.2 0.5 | -24.0 0.3 | 635.2 87.9 | 1240 230 (14) | 41.97 0.05 | 42.95 0.05 | 42.07 0.05 | 42.79 0.05 |
| NGC4273 | STING | 33.7 | 8.68 (7) | -20.7 1.6 | -23.3 0.3 | 22.3 18.6 | 390 70 (14) | 42.34 0.15 | 43.47 0.15 | 42.86 0.05 | 43.80 0.05 |
| NGC4303 | SONG | 10.6 | 9.21 (4) | -20.4 0.3 | -22.9 0.2 | 135.8 110.4 | 2280 470 (14) | 41.68 0.08 | 43.17 0.09 | 42.31 0.10 | 43.12 0.10 |
| NGC4321 | SONG | 15.8 | 8.99 (4) | -21.8 0.3 | -24.2 0.3 | 545.4 119.7 | 3340 920 (14) | 42.46 0.05 | 43.31 0.05 | 43.00 0.06 | 43.55 0.06 |
| NGC4414 | SONG | 18.3 | 8.65 (7) | -20.9 0.3 | -24.1 0.1 | 6.6 10.0 | 2740 500 (14) | 40.67 0.19 | 43.01 0.20 | 41.89 0.29 | 43.58 0.30 |
| NGC4450 | SONG | 16.5 | 9.18 (4) | -21.7 0.5 | -24.0 0.2 | 1.4 0.8 | 450 90 (14) | 41.15 0.07 | 42.53 0.08 | 41.69 0.06 | 42.38 0.06 |
| NGC4535 | SONG | 15.9 | 8.19 (2) | -19.8 1.0 | -23.1 0.2 | 96.1 71.6 | 1570 157 (14) | 41.47 0.09 | 42.58 0.10 | 42.62 0.08 | 43.16 0.08 |
| NGC4536 | STING | 14.9 | 8.69 (7) | -21.5 0.3 | -22.9 0.2 | 325.7 56.5 | 740 130 (14) | 42.09 0.12 | 42.77 0.12 | 43.34 0.05 | 43.61 0.05 |
| NGC4548 | SONG | 16.2 | 9.14 (4) | -21.6 0.5 | -24.0 0.4 | 5.4 1.3 | 540 140 (14) | 40.76 0.05 | 42.52 0.05 | 41.68 0.06 | 42.66 0.06 |
| NGC4559 | SONG | 7.9 | 8.68 (7) | -17.9 0.3 | -22.2 0.4 | 5.7 3.1 | 284 28 (12) | 41.04 0.09 | 43.20 0.09 | 41.26 0.05 | 42.51 0.05 |
| NGC4569 | SONG | 9.6 | 8.64 (7) | -20.8 0.8 | -23.3 0.3 | 158.6 75.6 | 1500 260 (14) | 41.50 0.06 | 42.24 0.06 | 42.37 0.05 | 42.83 0.05 |
| NGC4579 | SONG | 19.6 | 8.68 (7) | -23.2 0.6 | -24.8 0.5 | 49.4 5.0 | 910 200 (14) | 41.76 0.05 | 42.80 0.05 | 42.57 0.05 | 43.02 0.05 |
| NGC4605 | STING | 4.7 | 8.54 (6) | -17.9 0.1 | -20.7 0.1 | 6.9 2.1 | 190 60 (14) | 41.66 0.11 | 42.39 0.11 | 40.85 0.05 | 41.98 0.05 |
| NGC4654 | STING | 14.1 | 9.02 (4) | -18.3 0.9 | -22.8 0.1 | 11.9 10.0 | 730 150 (14) | 40.67 0.31 | 42.84 0.33 | 42.29 0.05 | 43.99 0.05 |
| NGC4699 | SONG | 23.7 | 9.05 (4) | -24.0 0.5 | -25.4 2.6 | 40.5 11.5 | — | 43.15 0.05 | 43.19 0.05 | 43.16 0.05 | 43.24 0.05 |
| NGC4725 | SONG | 13.2 | 8.64 (7) | -22.3 0.3 | -24.2 0.2 | 22.2 4.9 | 1950 700 (14) | 41.32 0.05 | 42.44 0.05 | 41.73 0.05 | 42.71 0.06 |
| NGC4736 | SONG | 5.0 | 8.69 (6) | -21.8 0.2 | -23.0 0.4 | 242.0 62.2 | 2560 690 (14) | 41.26 0.06 | 42.58 0.06 | 42.12 0.06 | 42.71 0.06 |
| NGC4826 | SONG | 5.4 | 8.63 (7) | -21.6 0.5 | -23.2 0.3 | 1240.3 122.9 | 2170 380 (14) | 41.58 0.05 | 42.08 0.06 | 42.39 0.05 | 42.57 0.05 |
| NGC5005 | SONG | 15.3 | 8.79 (4) | -22.1 0.4 | -24.3 0.3 | 278.5 101.0 | 1260 280 (14) | 40.91 0.28 | 42.77 0.29 | 42.60 0.06 | 43.29 0.06 |
| NGC5033 | SONG | 17.8 | 8.65 (7) | -23.2 0.8 | -24.1 0.3 | 342.4 38.0 | 1640 460 (14) | 42.02 0.05 | 43.36 0.06 | 43.15 0.05 | 43.51 0.05 |
| NGC5055 | SONG | 9.0 | 8.67 (7) | -21.9 0.7 | -24.1 0.4 | 499.9 76.3 | 5670 1890 (14) | 41.23 0.05 | 43.00 0.06 | 42.24 0.06 | 43.37 0.06 |
| NGC5194 | SONG | 8.0 | 8.66 (7) | -21.5 0.8 | -23.9 0.4 | 379.6 147.5 | 9210 3000 (14) | 41.88 0.05 | 43.39 0.06 | 42.33 0.06 | 43.65 0.07 |
| NGC5247 | SONG | 22.2 | 8.90 (4) | -21.0 0.4 | -23.7 0.2 | 65.6 56.6 | 1130 230 (14) | 42.10 0.09 | 43.51 0.10 | 42.58 0.08 | 43.56 0.08 |
| NGC5248 | SONG | 12.7 | 8.98 (4) | -21.5 0.3 | -23.1 0.3 | 484.4 107.3 | 1190 350 (14) | 41.77 0.07 | 42.77 0.07 | 42.78 0.06 | 43.28 0.06 |
| NGC5371 | STING | 35.3 | 8.65 (7) | -22.6 0.3 | -25.4 0.4 | 11.4 0.4 | — | 41.24 0.17 | 43.66 0.18 | 42.56 0.19 | 44.38 0.20 |
| NGC5457 | SONG | 7.2 | 8.71 (6) | -19.5 0.6 | -23.7 0.2 | 159.5 26.0 | 2357 236 (12) | 41.46 0.05 | 43.89 0.05 | 41.67 0.06 | 43.24 0.06 |
| NGC5713 | STING | 30.4 | 9.10 (4) | -23.2 0.3 | -23.6 0.9 | 1752.2 97.5 | 680 160 (14) | 43.04 0.10 | 43.10 0.10 | 43.97 0.05 | 44.04 0.05 |
| NGC6503 | STING | 5.3 | 8.97 (4) | -18.3 0.2 | -21.3 0.2 | 13.8 6.0 | 1030 340 (14) | 40.41 0.16 | 42.24 0.16 | 40.60 0.05 | 42.07 0.05 |
| NGC6946 | SONG | 6.5 | 8.81 (4) | -19.5 0.7 | -23.4 0.2 | 1124.0 353.2 | 12370 4120 (14) | — | — | 42.93 0.05 | 43.46 0.05 |
| NGC6951 | STING | 22.6 | 8.32 (1) | -22.1 0.3 | -24.2 0.3 | 300.8 112.7 | 1440 300 (14) | 41.16 0.15 | 42.30 0.16 | 43.88 0.05 | 44.41 0.05 |
| NGC7217 | NUGA | 17.2 | 8.68 (7) | -22.5 0.6 | -24.2 0.5 | 2.0 0.9 | 440 90 (14) | 41.21 0.11 | 42.73 0.12 | 41.90 0.05 | 42.89 0.05 |
| Galaxy | Sérsic | log() | log() | log() | log() | log() | log(M/LH) | Method | CO Profile | rb=d |
|---|---|---|---|---|---|---|---|---|---|---|
| Name | Index | M⊙ yr-1 kpc-2 | M⊙ yr-1 kpc-2 | M⊙ pc-2 | M⊙ pc-2 | M⊙ kpc-2 | Type | “ | ||
| All Flux | Adjusted | X(Z) | X(Z,W) | (b)(b)I – interacting; N – Not interacting | (c)(c) The bulge radius used to measure fluxes. | |||||
| NGC0337 | — | 0.11 0.34 | 0.04 0.11 | 2.27 0.31 | 2.25 0.31 | 3.68 0.10 | -0.55 | NUV-J | e | 6.2 |
| NGC0628 | 1.5 0.2 | -1.80 0.21 | -1.94 0.23 | 1.79 0.28 | 1.62 0.28 | 3.35 0.30 | -0.30 | NUV-J | e | 16.8 |
| NGC0772 | 3.9 0.3 | -0.52 0.21 | -0.62 0.25 | 2.20 0.37 | 1.86 0.37 | 3.66 0.59 | -0.29 | NUV-J | n | 13.4 |
| NGC0925 | 0.9 0.2 | -0.69 0.16 | -0.71 0.16 | 0.64 0.24 | 0.98 0.24 | 2.49 0.29 | -0.77 | NUV-J | e | 13.6 |
| NGC1156 | — | 0.73 0.28 | 0.64 0.24 | 2.25 0.29 | 2.05 0.29 | 3.15 0.10 | -0.65 | NUV-J | e | 9.6 |
| NGC1637 | 1.5 0.2 | 0.61 0.22 | 0.61 0.22 | 3.53 0.24 | 2.84 0.24 | 3.62 0.79 | -0.34 | B-V | b | 6.3 |
| NGC2403 | 0.8 0.2 | -1.11 0.62 | -1.19 0.67 | 1.69 0.51 | 1.93 0.51 | 3.21 0.37 | -0.58 | NUV-J | e | 4.0 |
| NGC2681 | 3.8 0.2 | -0.65 0.24 | -0.77 0.28 | 2.53 0.22 | 1.77 0.22 | 3.68 0.35 | -0.61 | SED | b | 14.7 |
| NGC2782 | 2.2 0.2 | -0.11 0.21 | -0.20 0.37 | 2.43 0.22 | 1.78 0.22 | 3.23 0.34 | -0.59 | SED | b | 10.2 |
| NGC2841 | 3.2 0.3 | -1.41 0.15 | -1.73 0.18 | -0.05 0.93 | 0.40 0.93 | 4.30 0.37 | -0.08 | SED | n | 17.5 |
| NGC2903 | 0.5 0.1 | 0.63 0.10 | 0.53 0.08 | 3.84 0.30 | 3.21 0.30 | 3.99 0.18 | -0.59 | SED | s | 8.4 |
| NGC2976 | — | -0.04 0.23 | -0.04 0.23 | 2.21 0.23 | 2.05 0.23 | 3.55 0.10 | -0.41 | SED | e | 20.7 |
| NGC3031 | 4.1 0.2 | -1.63 0.15 | -2.11 0.19 | -0.17 0.45 | -0.12 0.45 | 4.12 0.35 | -0.10 | SED | n | 72.0 |
| NGC3147 | 2.0 0.3 | -1.10 0.17 | -1.30 0.20 | 2.08 0.23 | 1.56 0.23 | 4.23 0.48 | -0.11 | NUV-J | n | 10.2 |
| NGC3184 | 1.8 0.3 | -0.68 0.18 | -0.76 0.20 | 2.11 0.32 | 2.09 0.32 | 3.54 0.44 | -0.17 | SED | s | 6.6 |
| NGC3198 | 1.8 0.2 | -0.30 0.31 | -0.40 0.41 | 2.66 0.23 | 2.25 0.23 | 3.44 0.51 | -0.37 | SED | s | 7.4 |
| NGC3344 | 2.3 0.4 | -0.45 0.19 | -0.53 0.23 | ¡1.5 | ¡1.6 | 3.91 0.53 | -0.11 | SED | n | 7.2 |
| NGC3351 | 1.4 0.4 | -0.11 0.17 | -0.20 0.32 | 2.37 0.24 | 2.09 0.24 | 3.70 0.34 | -0.46 | SED | s | 14.4 |
| NGC3368 | 1.6 0.2 | -1.48 0.12 | -1.66 0.13 | 2.81 0.22 | 2.15 0.22 | 3.89 0.40 | -0.16 | SED | n | 29.2 |
| NGC3486 | 1.8 0.5 | -0.53 0.09 | -1.81 0.30 | 1.09 0.24 | 0.86 0.24 | 2.78 0.56 | -0.62 | SED | e | 24.9 |
| NGC3521 | 3.7 0.4 | -1.05 0.17 | -1.39 0.22 | 2.20 0.49 | 2.09 0.49 | 4.38 0.70 | -0.28 | NUV-J | e | 12.1 |
| NGC3593 | 1.2 0.1 | -0.54 0.32 | -0.64 0.38 | 2.95 0.22 | 2.14 0.22 | 3.54 0.21 | -0.39 | SED | s 32.2 | |
| NGC3627 | 1.5 0.3 | 0.00 0.09 | -0.07 1.35 | 3.03 0.25 | 2.64 0.25 | 4.56 0.34 | -0.08 | SED | s | 11.7 |
| NGC3726 | 1.5 0.3 | -0.61 0.20 | -0.68 0.22 | 2.64 0.31 | 2.42 0.31 | 3.09 0.39 | -0.71 | SED | s | 6.4 |
| NGC3938 | 1.5 0.2 | -1.42 0.26 | -1.55 0.28 | 2.37 0.45 | 2.19 0.45 | 3.43 0.23 | -0.42 | SED | e | 6.8 |
| NGC3949 | 1.0 0.2 | 0.03 0.32 | -0.05 -0.50 | 2.25 0.57 | 2.23 0.57 | 3.52 0.26 | -0.54 | SED | e | 5.0 |
| NGC3953 | 1.6 0.6 | -0.95 0.11 | -1.52 0.18 | ¡0.1 | ¡0.5 | 4.24 0.48 | -0.01 | SED | n | 13.1 |
| NGC3992 | 3.2 0.6 | -1.47 0.11 | -2.71 0.20 | 0.50 0.26 | 0.77 0.26 | 3.90 0.68 | -0.07 | SED | e | 14.8 |
| NGC4254 | 2.1 0.3 | -0.82 0.26 | -0.92 0.29 | 2.42 0.23 | 1.88 0.23 | 3.55 0.46 | -0.41 | SED | s | 19.2 |
| NGC4258 | 3.7 0.4 | -0.66 0.11 | -0.75 0.12 | 2.89 0.23 | 2.34 0.23 | 3.84 0.49 | -0.38 | NUV-J | s | 20.2 |
| NGC4273 | 1.2 0.4 | 0.57 0.20 | 0.49 0.17 | 3.55 0.42 | 3.14 0.42 | 3.97 1.38 | -0.61 | SED | s | 4.0 |
| NGC4303 | 1.1 0.2 | -0.04 0.15 | -0.14 0.47 | 3.09 0.42 | 2.75 0.42 | 3.85 0.32 | -0.59 | SED | s | 6.6 |
| NGC4321 | 1.7 0.2 | -0.43 0.03 | -0.52 0.04 | 2.60 0.24 | 2.20 0.24 | 3.25 0.31 | -0.63 | SED | s | 16.0 |
| NGC4414 | 1.2 0.2 | -0.64 0.59 | -0.79 0.73 | 2.37 0.70 | 2.32 0.70 | 4.50 0.32 | -0.03 | SED | n | 4.6 |
| NGC4450 | 3.5 0.3 | -1.30 0.16 | -1.56 0.19 | 1.06 0.34 | 1.24 0.34 | 4.01 0.49 | -0.28 | SED | n | 9.9 |
| NGC4535 | 1.3 0.4 | 0.08 0.12 | -0.01 -0.02 | 3.42 0.39 | 3.02 0.39 | 3.46 0.89 | -0.60 | SED | s | 5.3 |
| NGC4536 | 1.5 0.2 | 0.36 0.03 | 0.26 0.02 | 3.03 0.23 | 2.49 0.23 | 4.15 0.35 | -0.15 | SED | s | 11.0 |
| NGC4548 | 2.9 0.4 | -1.69 0.16 | -1.98 0.19 | 1.30 0.25 | 1.33 0.25 | 3.89 0.48 | -0.05 | SED | e | 13.6 |
| NGC4559 | 1.7 0.4 | -0.86 0.20 | -0.94 0.22 | 1.65 0.32 | 1.71 0.32 | 3.05 0.33 | -0.53 | SED | e | 9.8 |
| NGC4569 | 1.8 0.4 | 0.26 0.08 | 0.03 0.01 | 3.47 0.27 | 2.99 0.27 | 4.10 0.74 | -0.63 | SED | s | 8.9 |
| NGC4579 | 3.2 0.4 | -1.13 0.07 | -1.31 0.08 | 2.07 0.23 | 1.84 0.23 | 3.98 0.58 | -0.26 | SED | e | 19.1 |
| NGC4605 | 0.02 0.42 | 0.00 0.00 | 2.31 0.26 | 2.16 0.26 | 3.67 0.10 | -0.56 | SED | e | 15.1 | |
| NGC4654 | 1.1 0.8 | 0.81 0.34 | 0.71 0.30 | 3.51 0.43 | 3.17 0.43 | 3.98 0.86 | -0.57 | SED | s | 4.0 |
| NGC4699 | 3.0 0.4 | -2.06 0.01 | -2.14 0.01 | 0.42 0.26 | 0.24 0.26 | 2.42 0.54 | -0.41 | SED | e | 107.5 |
| NGC4725 | 3.9 0.3 | -1.70 0.15 | -2.08 0.18 | 1.11 0.24 | 1.14 0.24 | 4.00 0.37 | -0.10 | SED | e | 22.3 |
| NGC4736 | 1.2 0.1 | -0.36 0.12 | -0.52 0.17 | 2.42 0.25 | 2.05 0.25 | 4.77 0.26 | -0.13 | NUV-J | e | 15.6 |
| NGC4826 | 3.9 0.4 | -0.60 0.09 | -0.72 0.11 | 2.46 0.22 | 1.98 0.22 | 3.73 0.52 | -0.57 | NUV-J | s | 29.7 |
| NGC5005 | 1.8 0.3 | -0.27 0.25 | -0.30 0.28 | 3.61 0.27 | 3.06 0.27 | 4.38 0.42 | -0.38 | SED | s | 8.4 |
| NGC5033 | 1.5 0.8 | -0.62 0.02 | -0.73 0.02 | 2.46 0.23 | 2.02 0.23 | 3.79 0.77 | -0.37 | SED | b | 29.5 |
| NGC5055 | 1.8 0.5 | -0.94 0.11 | -1.10 0.13 | 2.40 0.23 | 1.99 0.23 | 3.78 0.64 | -0.48 | SED | s | 22.1 |
| NGC5194 | 1.6 0.5 | -0.64 0.10 | -0.74 0.12 | 2.28 0.28 | 1.92 0.28 | 3.86 0.72 | -0.34 | NUV-J | e | 20.0 |
| NGC5247 | 1.9 0.3 | -0.77 0.10 | -0.85 0.11 | 2.65 0.44 | 2.36 0.44 | 3.14 0.39 | -0.49 | NUV-J | s | 10.0 |
| NGC5248 | 1.3 0.2 | -0.50 0.06 | -0.60 0.07 | 3.17 0.24 | 2.55 0.24 | 3.40 0.37 | -0.59 | SED | s | 17.0 |
| NGC5371 | 1.9 0.2 | -1.28 0.29 | -1.43 0.32 | 1.83 0.22 | 1.56 0.22 | 3.80 0.31 | -0.09 | SED | e | 10.1 |
| NGC5457 | 1.6 0.5 | -0.96 0.15 | -1.03 0.16 | 2.66 0.23 | 2.17 0.23 | 3.12 0.58 | -0.57 | SED | s | 15.7 |
| NGC5713 | 2.1 0.2 | -0.94 0.26 | -1.03 0.29 | 2.39 0.22 | 1.70 0.22 | 2.20 0.31 | -0.83 | SED | s | 41.6 |
| NGC6503 | — | -0.77 0.51 | -0.90 0.60 | 2.75 0.29 | 2.51 0.29 | 4.12 0.10 | -0.38 | NUV-J | e | 12.0 |
| NGC6946 | 1.6 0.4 | 0.84 0.15 | 0.85 0.15 | 3.46 0.26 | 2.88 0.26 | 3.96 0.63 | -0.20 | NUV-J | s | 10.0 |
| NGC6951 | 1.4 0.2 | 0.64 0.23 | 0.54 0.19 | 3.50 0.28 | 2.91 0.28 | 3.93 0.35 | -0.37 | NUV-J | s | 8.3 |
| NGC7217 | 3.2 0.5 | -1.39 0.16 | -1.73 0.20 | 0.97 0.29 | 0.92 0.29 | 4.28 0.55 | -0.05 | NUV-J | n | 11.9 |
| Galaxy | log(h) | log() | log() | log() | log() | log() | log(M/LH) | M/L | Disk | Environment |
|---|---|---|---|---|---|---|---|---|---|---|
| Name | pc | M⊙ yr-1 kpc-2 | M⊙ yr-1 kpc-2 | M⊙ pc-2 | M⊙ pc-2 | M⊙ kpc-2 | Method | Type | (b)(b)I – interacting; N – Not interacting | |
| All Flux | Adjusted | X(Z) | X(Z,W) | log(M/LH) | Method | (a)(a)s – CO profile is as steep as stellar surface brightness profile. b – CO profile is steeper than exponential, but not as steep as stars. e – CO follows exponential profile. n – CO profile drops in bulge. | ||||
| NGC0337 | 3.18 0.02 | -1.07 0.34 | -1.05 0.34 | 1.41 0.31 | 1.71 0.31 | 2.66 0.12 | -0.56 | NUV-J | U | I |
| NGC0628 | 3.42 0.02 | -2.30 0.21 | -1.03 0.21 | 0.99 0.26 | 0.89 0.26 | 1.88 0.23 | -0.50 | NUV-J | U | N |
| NGC0772 | 3.96 0.27 | -1.92 0.21 | -1.18 0.21 | 1.39 0.24 | 1.16 0.24 | 2.10 0.60 | -0.44 | NUV-J | U | I |
| NGC0925 | 3.48 0.03 | -1.71 0.16 | -1.68 0.16 | 1.59 0.31 | 1.41 0.31 | 1.92 0.22 | -0.69 | NUV-J | B | N |
| NGC1156 | 2.96 0.02 | -1.22 0.28 | -2.28 0.28 | 1.02 0.22 | 1.18 0.22 | 1.78 0.11 | -0.63 | NUV-J | B | N |
| NGC1637 | 3.14 0.03 | -1.37 0.22 | -1.14 0.22 | 1.21 0.22 | 1.04 0.22 | 2.43 0.71 | -0.34 | B-V | B | I |
| NGC2403 | 3.19 0.03 | -1.94 0.62 | -1.52 0.62 | 0.41 0.26 | 0.40 0.26 | 1.83 0.29 | -0.64 | NUV-J | U | N |
| NGC2681 | 3.30 0.05 | -1.99 0.24 | -1.98 0.24 | 1.50 0.24 | 1.53 0.24 | 2.68 0.30 | -0.42 | SED | U | N |
| NGC2782 | 3.57 0.04 | -1.68 0.21 | -1.38 0.21 | 1.52 0.23 | 1.51 0.23 | 2.08 0.28 | -0.51 | SED | U | I |
| NGC2841 | 3.60 0.02 | -2.27 0.15 | -1.71 0.15 | 1.53 0.23 | 1.39 0.23 | 2.88 0.30 | -0.23 | SED | U | N |
| NGC2903 | 3.20 0.01 | -0.97 0.10 | -1.03 0.10 | 2.80 0.26 | 2.37 0.26 | 3.10 0.13 | -0.41 | SED | B | N |
| NGC2976 | 2.96 0.02 | -2.09 0.23 | -1.92 0.23 | 1.00 0.24 | 1.05 0.24 | 2.18 0.10 | -0.52 | SED | U | N |
| NGC3031 | 3.38 0.03 | -2.47 0.15 | -1.56 0.15 | 1.14 0.22 | 0.78 0.22 | 3.00 0.29 | -0.21 | SED | U | I |
| NGC3147 | 3.72 0.03 | -1.91 0.17 | -1.37 0.17 | 1.99 0.24 | 1.79 0.24 | 2.56 0.40 | -0.36 | NUV-J | U | N |
| NGC3184 | 3.48 0.01 | -2.27 0.18 | -2.14 0.18 | 0.73 0.25 | 0.78 0.25 | 1.79 0.36 | -0.55 | SED | B | N |
| NGC3198 | 3.58 0.02 | -1.84 0.31 | -2.16 0.31 | 1.17 0.22 | 1.04 0.22 | 1.84 0.42 | -0.62 | SED | B | N |
| NGC3344 | 3.07 0.03 | -2.01 0.19 | -2.45 0.19 | 1.13 0.25 | 1.09 0.25 | 2.08 0.45 | -0.55 | SED | B | N |
| NGC3351 | 3.37 0.04 | -2.05 0.17 | -2.20 0.17 | 0.63 0.25 | 0.76 0.25 | 2.23 0.31 | -0.56 | SED | B | N |
| NGC3368 | 3.43 0.02 | -2.35 0.12 | -1.40 0.12 | 1.39 0.27 | 1.17 0.27 | 2.54 0.84 | -0.29 | SED | B | N |
| NGC3486 | 3.54 0.06 | -1.89 0.09 | -1.87 0.09 | 1.07 0.31 | 0.96 0.31 | 1.37 0.60 | -0.63 | SED | B | N |
| NGC3521 | 3.47 0.03 | -1.41 0.17 | -1.14 0.17 | 1.99 0.25 | 1.77 0.25 | 2.91 0.62 | -0.47 | NUV-J | B | N |
| NGC3593 | 3.15 0.04 | -1.70 0.32 | -0.64 0.32 | 2.10 0.24 | 1.88 0.24 | 2.55 0.19 | -0.55 | SED | U | I |
| NGC3627 | 3.51 0.00 | -1.01 0.09 | -2.32 0.09 | 1.77 0.26 | 1.54 0.26 | 2.66 0.26 | -0.39 | SED | B | I |
| NGC3726 | 3.57 0.03 | -2.10 0.20 | -1.92 0.20 | 1.54 0.25 | 1.38 0.25 | 1.74 0.32 | -0.71 | SED | B | N |
| NGC3938 | 3.48 0.02 | -1.88 0.26 | -1.92 0.26 | 1.78 0.25 | 1.56 0.25 | 2.12 0.17 | -0.42 | SED | U | N |
| NGC3949 | 3.18 0.03 | -0.58 0.32 | -1.52 0.32 | 2.02 0.23 | 2.00 0.23 | 2.46 0.21 | -0.62 | SED | U | I |
| NGC3953 | 3.71 0.07 | -1.97 0.11 | -1.81 0.11 | 1.76 0.25 | 1.51 0.25 | 2.57 0.40 | -0.27 | SED | B | N |
| NGC3992 | 3.97 0.11 | -2.74 0.11 | -2.14 0.11 | 0.52 0.22 | 0.48 0.22 | 2.37 0.62 | -0.17 | SED | B | N |
| NGC4254 | 3.39 0.04 | -1.15 0.26 | -2.32 0.26 | 1.88 0.25 | 1.79 0.25 | 2.45 0.42 | -0.67 | SED | U | I |
| NGC4258 | 3.51 0.04 | -2.11 0.11 | -1.51 0.11 | 0.95 0.23 | 0.87 0.23 | 2.84 0.41 | -0.21 | NUV-J | B | N |
| NGC4273 | 3.27 0.03 | -1.11 0.20 | -1.35 0.20 | 2.19 0.23 | 2.16 0.23 | 2.33 1.28 | -0.62 | SED | B | I |
| NGC4303 | 3.25 0.02 | -1.65 0.15 | -1.51 0.15 | 1.76 0.24 | 1.57 0.24 | 2.37 0.25 | -0.44 | SED | B | N |
| NGC4321 | 3.73 0.04 | -2.24 0.03 | -1.30 0.03 | 1.02 0.25 | 0.92 0.25 | 1.88 0.25 | -0.53 | SED | B | N |
| NGC4414 | 3.27 0.01 | -1.30 0.59 | -1.60 0.59 | 2.63 0.24 | 2.31 0.24 | 2.87 0.25 | -0.51 | SED | U | N |
| NGC4450 | 3.47 0.03 | -2.59 0.16 | -1.86 0.16 | 1.42 0.24 | 1.36 0.24 | 2.72 0.41 | -0.27 | SED | U | N |
| NGC4535 | 3.48 0.02 | -2.18 0.12 | -2.31 0.12 | 1.83 0.22 | 1.58 0.22 | 2.13 0.80 | -0.39 | SED | B | N |
| NGC4536 | 3.37 0.02 | -1.28 0.03 | -1.98 0.03 | 1.52 0.23 | 1.56 0.23 | 2.36 0.28 | -0.56 | SED | B | N |
| NGC4548 | 3.63 0.05 | -2.91 0.16 | -1.62 0.16 | 1.01 0.25 | 0.92 0.25 | 2.25 0.42 | -0.28 | SED | B | N |
| NGC4559 | 3.43 0.04 | -1.75 0.20 | -1.21 0.20 | 0.76 0.22 | 0.75 0.22 | 2.09 0.29 | -0.53 | SED | B | N |
| NGC4569 | 3.43 0.03 | -1.86 0.08 | -2.01 0.08 | 2.04 0.24 | 1.79 0.24 | 2.78 0.66 | -0.48 | SED | B | N |
| NGC4579 | 3.63 0.05 | -2.35 0.07 | -2.50 0.07 | 1.62 0.24 | 1.46 0.24 | 2.76 0.52 | -0.32 | SED | B | N |
| NGC4605 | 2.94 0.01 | -1.48 0.42 | -1.76 0.42 | 1.49 0.26 | 1.47 0.26 | 2.60 0.10 | -0.47 | SED | B | N |
| NGC4654 | 3.37 0.01 | -0.93 0.34 | -2.13 0.34 | 1.89 0.24 | 1.74 0.24 | 2.38 0.77 | -0.51 | SED | B | N |
| NGC4699 | 3.88 0.48 | -2.66 0.01 | -1.77 0.01 | — | — | 2.41 0.93 | -0.32 | SED | B | N |
| NGC4725 | 3.67 0.02 | -2.74 0.15 | -1.78 0.15 | 1.05 0.27 | 1.00 0.27 | 2.48 0.30 | -0.31 | SED | B | I |
| NGC4736 | 2.81 0.06 | -1.26 0.12 | -2.35 0.12 | 1.86 0.25 | 1.73 0.25 | 3.46 0.24 | -0.25 | NUV-J | U | N |
| NGC4826 | 3.25 0.04 | -2.16 0.09 | -2.06 0.09 | 0.99 0.23 | 0.97 0.23 | 2.73 0.45 | -0.43 | NUV-J | U | I |
| NGC5005 | 3.37 0.03 | -1.64 0.25 | -2.20 0.25 | 2.16 0.24 | 1.94 0.24 | 2.98 0.36 | -0.48 | SED | B | N |
| NGC5033 | 3.73 0.03 | -1.53 0.02 | -1.98 0.02 | 1.77 0.25 | 1.67 0.25 | 2.61 0.69 | -0.56 | SED | U | N |
| NGC5055 | 3.48 0.03 | -1.77 0.11 | -3.05 0.11 | 1.47 0.26 | 1.29 0.26 | 2.59 0.57 | -0.47 | SED | U | N |
| NGC5194 | 3.48 0.04 | -1.55 0.10 | -2.76 0.10 | 1.45 0.26 | 1.23 0.26 | 2.39 0.64 | -0.50 | NUV-J | U | I |
| NGC5247 | 3.66 0.02 | -2.10 0.10 | -2.93 0.10 | 1.51 0.24 | 1.30 0.24 | 1.75 0.32 | -0.55 | NUV-J | U | N |
| NGC5248 | 3.43 0.04 | -1.83 0.06 | -1.75 0.06 | 1.73 0.26 | 1.52 0.26 | 2.45 0.31 | -0.28 | SED | B/O | N |
| NGC5371 | 3.99 0.09 | -2.11 0.29 | -2.19 0.29 | — | — | 1.88 0.25 | -0.42 | SED | B | N |
| NGC5457 | 3.67 0.03 | -1.89 0.15 | -2.97 0.15 | 0.91 0.22 | 0.53 0.22 | 1.75 0.50 | -0.64 | SED | B | N |
| NGC5713 | 3.61 0.07 | -1.69 0.26 | -2.38 0.26 | 1.24 0.24 | 1.30 0.24 | 2.01 0.43 | -0.37 | SED | B | I |
| NGC6503 | 2.89 0.02 | -1.50 0.51 | -2.03 0.51 | 2.32 0.27 | 2.08 0.27 | 2.78 0.12 | -0.53 | NUV-J | U | N |
| NGC6946 | 3.48 0.03 | -1.93 0.15 | -2.79 0.15 | 1.47 0.26 | 1.13 0.26 | 2.26 0.55 | -0.37 | NUV-J | B | N |
| NGC6951 | 3.50 0.04 | -1.04 0.23 | -1.91 0.23 | 2.03 0.24 | 1.81 0.24 | 2.54 0.29 | -0.37 | NUV-J | B | N |
| NGC7217 | 3.34 0.06 | -2.12 0.16 | -2.72 0.16 | 1.53 0.24 | 1.48 0.24 | 2.97 0.49 | -0.21 | NUV-J | U | N |
| (a)(a)footnotetext: B – Barred Disk; U – Unbarred Disk; B/O – Ovaled disk |