Millimeter Emission Structure in the first ALMA Image of the AU Mic Debris Disk
Abstract
We present 1.3 millimeter ALMA Cycle 0 observations of the edge-on debris disk around the nearby, 10 Myr-old, M-type star AU Mic. These observations obtain (6 AU) resolution and reveal two distinct emission components: (1) the previously known dust belt that extends to a radius of AU, and (2) a newly recognized central peak that remains unresolved. The cold dust belt of mass is resolved in the radial direction with a rising emission profile that peaks sharply at the location of the outer edge of the “birth ring” of planetesimals hypothesized to explain the midplane scattered light gradients. No significant asymmetries are discerned in the structure or position of this dust belt. The central peak identified in the ALMA image is times brighter than the stellar photosphere, which indicates an additional emission process in the inner regions of the system. Emission from a stellar corona or activity may contribute, but the observations show no signs of temporal variations characteristic of radio-wave flares. We suggest that this central component may be dominated by dust emission from an inner planetesimal belt of mass , consistent with a lack of emission shortward of 25 m and a location 3 AU from the star. Future millimeter observations can test this assertion, as an inner dust belt should be readily separated from the central star at higher angular resolution.
1 Introduction
Debris disks are created by the collisional erosion of planetesimals, the building blocks of planetary systems. These collisions continuously generate dust grains with a range of sizes that are detected with astronomical measurements from optical to radio wavelengths. Resolved observations of nearby debris disks are instrumental in advancing our understanding of these systems. At a distance of pc (van Leeuwen, 2007), the M1 star AU Mic hosts one of the closest and best studied debris disks. The detection of submillimeter emission (Liu et al., 2004) from this 10 Myr-old system in the Pic moving group (Zuckerman et al., 2001) was followed quickly by the discovery of an edge-on disk seen in scattered starlight (Kalas et al., 2004). Subsequent work has characterized the scattered light in great detail, exploiting its proximity to constrain its radial and vertical structure (Liu, 2004; Krist et al., 2005; Metchev et al., 2005; Graham et al., 2007; Fitzgerald et al., 2007).
Observations of dust emission at (sub)millimeter wavelengths provide important, complementary information about debris disk structures. Unlike the small grains probed at optical and near-infrared wavelengths that react strongly to stellar radiation and wind forces, the large grains that dominate the millimeter-wave emission have dynamics more like the parent planetesimals. As a result, long-wavelength images trace best the location and distribution of the larger colliding bodies (Wyatt, 2006), and potentially also the signatures of planets that interact with them (Ertel et al., 2012). These size-dependent dust dynamics manifest beautifully in the edge-on AU Mic disk. Resolved millimeter-wave observations show an emission belt within the extended optical disk that peaks near a radius of AU, where the midplane scattered light profile steepens dramatically (Wilner et al., 2012). These features are elegantly explained by the presence of a “birth ring” of planetesimals at that location, where small grains released in a collisional cascade are launched into an extended halo (Strubbe & Chiang, 2006; Augereau & Beust, 2006).
With the advent of the Atacama Large Millimeter Array (ALMA), the millimeter emission in nearby debris disks can be imaged in much greater detail (e.g., Boley et al., 2012). In this Letter, we present new, sub-arcsecond resolution ALMA Cycle 0 observations of AU Mic at mm. The ALMA data provide substantially improved constraints on the locations of colliding planetesimals in the AU Mic disk and help shed light on the processes that may be shaping the planetesimal distribution. They also reveal a previously unknown, centrally located emission feature.
2 Observations
AU Mic was observed by ALMA with its Band 6 receivers over four 2 hour-long “scheduling blocks” (SBs) in 2012 Apr and Jun. Table 1 summarizes the observations. The 16-20 operational 12-m antennas were arranged to span baseline lengths of 21–402 m (corresponding to a maximum resolution of 06). The correlator was configured to optimize continuum sensitivity, processing two polarizations in four 2 GHz-wide basebands, each with 128 spectral channels, centered at 226, 228, 242, and 244 GHz. In each SB, we interleaved observations of AU Mic (pointing center , , J2000, within 1″ of the star position at all epochs) with the nearby quasar J2101295.
The data from each SB were calibrated independently within the CASA software package. After applying system temperature measurements and phase corrections from the water vapor radiometers, the data were flagged and averaged into 6.048 s integrations. A calibration of the spectral response of the system was determined from observations of J1924292, and complex gain variations induced by atmospheric and instrumental effects were corrected using observations of J2101295. The absolute flux calibration was derived from observations of Neptune: a mean calibration was applied to all basebands, with a systematic uncertainty of 10% (see §3.3). To generate an image at the mean frequency, 235 GHz (1.28 mm), we Fourier inverted the calibrated visibilities with natural weighting and performed a multi-frequency synthesis deconvolution with the CLEAN algorithm. The visibilities were further reduced by spectrally averaging over the central 112 channels in each baseband and re-weighted by the observed scatter.
3 Results and Analysis
3.1 Image of 1.3 mm Dust Continuum Emission
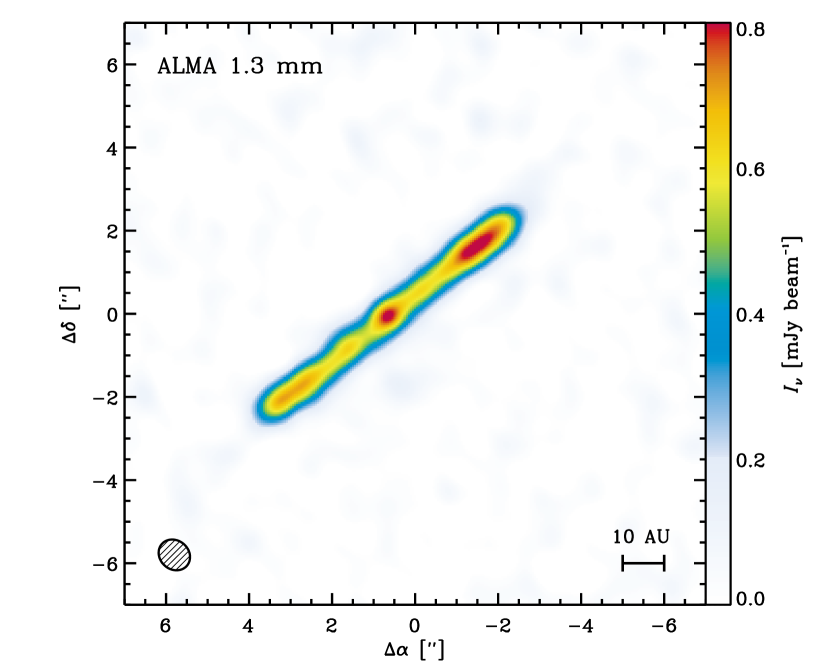
Figure 1 shows an image of the mm emission from SB-4 (with the most antennas and best weather conditions), with synthesized beam ( AU), p.a. 49°, and rms of 30 Jy beam-1. An image constructed from all 4 SBs is consistent but noisier, which we attribute to systematic calibration issues resulting from the poorer weather conditions of the earlier observations. The emission is confined to a narrow band with aspect ratio 10:1, with an orientation consistent with the scattered light disk. The emission is not resolved in the direction perpendicular to the elongation. There are clear peaks near both extrema and in the middle of the structure (detected at all four epochs). The emission is marginally brighter at the northwest end than the southeast end, and shows small undulations along its length, though none of these variations are significant. We interpret the observed structure as a superposition of two components: (1) the nearly edge-on dust belt with limb-brightened ansae, and (2) a new, distinct, and compact feature located at the center of the belt.
3.2 Modeling Formalism
Building on the phenomenological methodology of Wilner et al. (2011, 2012) to analyze resolved millimeter emission from debris disks, we construct a parametric model to quantify the observed properties of the AU Mic emission. We consider two model components: a vertically thin, axisymmetric “outer” belt, and an additional source to account for the central peak. The belt component is informed by models of the scattered light that show the disk midplane within 50 AU is remarkably straight, 05 from edge-on, and thin (FWHM 03). We assume the belt is viewed at an inclination of 895. The belt is characterized as an annulus with (unprojected) radial intensity for , with a normalization defined by , a center determined by offsets (relative to the pointing center) {, }, and an orientation described by a position angle (PA). We treat the central component as a circular Gaussian with mean , variance (half width at half maximum ), and flux density . The mean is defined as a radial shift from the belt center in the plane of the belt. We also include power-law spectral scalings between the 4 basebands for each component, denoted and , where .
For a given parameter set, we compute four synthetic visibility sets sampled at the same spatial frequencies observed by ALMA, corresponding to the spectrally averaged basebands (at 226, 228, 242, and 244 GHz). By fitting the visibility data directly, we are not sensitive to the non-linear effects of deconvolution, and take advantage of the full range of available spatial frequencies. The fit quality is quantified by a likelihood metric, , determined from the values summed over the real and imaginary components at all spatial frequencies (). A Monte Carlo Markov Chain (MCMC) approach was utilized to characterize the multi-dimensional parameter space of this model and determine the posterior probability distribution functions for each parameter. We used the affine-invariant ensemble sampler proposed by Goodman & Weare (2010), in a locally-modified version of the parallelized implementation described by Foreman-Mackey et al. (2012), to compute likelihood values for 106 MCMC trials. Uniform priors were assumed for all parameters, with bounds imposed to ensure that the model was well-defined: {, , , and .
3.3 Results of Model Fits
The best-fit parameter values and their 68% uncertainties determined from the marginalized posterior probability distributions are listed in Table 2. The data and best-fit model are compared in the image plane in Figure 3.3; there are no significant residuals. The best-fit model has a reduced (905,920 independent datapoints, 12 free parameters). The modeling procedure was performed on each SB individually and the full dataset (all 4 SBs together). The results were entirely consistent, although the parameter uncertainties were notably smaller from the superior SB-4 dataset alone, and we focus on those results.
![[Uncaptioned image]](/html/1211.5148/assets/x2.png)
(left) The observed 1.3 mm emission from AU Mic, (center) the best-fit model (see §3.3), and (right) the imaged residuals. Contours are drawn at 4 (120 Jy beam-1) intervals.
Most parameters are determined with high precision. We find good agreement of the outer belt parameters {, , } with the less well-constrained fits of Wilner et al. (2012), and on the disk PA from measurements of scattered starlight (e.g., Krist et al., 2005). We measure a flat spectrum for the outer belt () across the 4 basebands, which corresponds to the difference between the spectral slopes of AU Mic and Neptune (), consistent with data from 350 m to 1.3 mm (Wilner et al., 2012).
The central emission peak is detected with high confidence at Jy (10 brighter than the outer belt at that location). It is unresolved, with AU (3 ), and positionally coincident with the outer belt center: AU (3 ). Regarding the outer belt, the most notable result is that the models strongly favor rising emission profiles with large, positive gradients: . Models with the standard assumption of produce significant residuals, under-predicting the intensities at 1-2″ from the belt center. Because of the steep increase in the emission profile, there is only a weak constraint on the inner edge of the outer belt. The best-fit deviates from 0 at the 2 level: the 3 limit is AU.
4 Discussion
We have presented new, sub-arcsecond resolution ALMA observations of 1.3 mm emission from the AU Mic debris disk and analyzed the data with a simple parametric model. This emission is resolved into two distinct components: (1) an edge-on outer belt with an emission profile that rises with radius out to 40 AU, and (2) an unresolved peak at the center of the outer belt. This distribution is more complex than the single, narrow ring often assumed for debris disks. However, it has some similarities to other nearby resolved systems, like Eri (Backman et al., 2009) or HR 8799 (Su et al., 2009), that show an inner component inferred from excess infrared emission, separate from an extended and colder outer belt.
4.1 The Central Emission Peak
The stellar photosphere is much fainter than the central peak noted in Figure 1. A NextGen stellar model (Hauschildt et al., 1999) with K, L⊙, and M⊙ (e.g., Metchev et al., 2005; Chen et al., 2005) that matches the AU Mic photometry from 0.4–25 m contributes only Jy at 1.3 mm, 6 fainter than observed. However, AU Mic is an active star that exhibits radio-wave bursts. In quiescence, observations find 120 Jy at 3.6 cm (White et al., 1994), and the contribution at 1.3 mm from hot coronal plasma seen in X-rays is unlikely to be significant (though better spectral constraints are desirable, see Leto et al., 2000). Flares are detected from AU Mic at 200-1200 Jy at 6 cm (Bower et al., 2009), but this non-thermal emission is much weaker at 1.3 mm. While the unknown variability makes any extrapolation to 1.3 mm problematic, the temporal properties of the ALMA emission provide additional information. Radio-wave flares have fast decay times, of order an hour (Kundu et al., 1987); but, the mm-wave peak persists at a consistent intensity in all four ALMA observations, within uncertainties that are typically larger than for SB-4, spanning timescales from 1 hour (within SB-4) to 2 months (SB-1 to SB-4). Unfortunately, the spectral index () constraints are not good enough to be diagnostic. We suspect that stellar emission is too weak and too ephemeral to be responsible for the 1.3 mm peak, but the available data does not allow for a firm determination of its contribution.
Alternatively, the central emission peak could be produced by dust in a distinct (unresolved) planetesimal belt located close to the star. In §3.3, we constrained the extent of this peak to AU (3 ), inside the inner working angle ( AU) of all previous high resolution imaging of scattered light (Krist et al., 2005; Fitzgerald et al., 2007). Rough models of the spectral energy distribution (SED) from the ALMA central peak can help assess the feasibility that it originates in an inner dust belt. In this context, the most salient feature of the AU Mic SED is the absence of emission excess at m (e.g., Liu et al., 2004; Chen et al., 2005). We assume the central peak represents the combined emission from the star and dust, such that mJy at 1.3 mm. Optically thin dust emission at a temperature, , has , where is the opacity spectrum, the Planck function, the mass, and pc. For a given dust population characterized by , we computed the maximum (and minimum ) consistent with both the observed millimeter flux density and the infrared SED. We calculated various for dust with the Weingartner & Draine (2001) “astrosilicate” composition and a power-law size distribution between m (the blow-out size; Strubbe & Chiang, 2006) and values from 1 m to 1 cm. For m, models of the central peak over-predict the observed 60-70 m emission if K. However, larger grains with mm at temperatures up to K can be accommodated without producing an excess at m. These maximum values are comparable to the expected dust temperatures a few AU from the star, compatible with the emission size constraints (). The corresponding minimum is g, about 1% of the lunar mass. These calculations show that the central emission peak is consistent with a cool dust belt located 3 AU from the central star, with a total mass comparable to the asteroid belt in our Solar System. If this interpretation is correct, then ALMA observations at higher resolution can determine its properties. Interestingly, the temperature of this putative inner belt is colder than the K found to apply systematically to inner belts around F5-K0 stars by Morales et al. (2011).
4.2 The Outer Dust Belt
Our modeling of the ALMA data locates the far edge of the outer emission belt with high precision, AU, which matches closely the outer edge of the hypothesized “birth ring” of colliding planetesimals. This analysis does not define the shape of the edge below the AU resolution limit, but the truncation is reminiscent of the outer edge of the classical Kuiper Belt ( AU; Trujillo & Brown, 2001). The origins of such sharp edges remain unclear: they could be from dynamical interactions (Ida et al., 2000; Boley et al., 2012), or they may simply represent the initial conditions, where planetesimal formation was efficient and successful in the primordial disk. Adopting the opacity used in §4.1 ( = 2.7 cm2 g-1), and assuming K (for 35-45 AU), the dust mass of this outer belt is g (consistent with previous estimates; Liu et al., 2004), 100 more massive than the hypothesized inner belt; the Kuiper Belt and asteroid belt have a similar mass ratio.
The mm-wave emission morphologies of cold belts of dusty debris reflect the dynamical processes that shape the underlying planetesimal distributions. For AU Mic, our modeling suggests that its outer emission belt can be described by an increasing emission profile with a positive radial power-law index . If we assume the emitting dust is in radiative equilibrium with a temperature profile , this implies a rising surface density profile, , strongly peaked near 40 AU. A broad parent body ring with constant surface density would produce a radial intensity profile with , a value ruled out with high confidence (). A rising behavior is predicted for “self-stirred” disks with ongoing planet formation (Kenyon & Bromley, 2002); in particular, the models of Kennedy & Wyatt (2010) suggest . However, the timescale required to assemble Pluto-sized bodies at 40 AU to initiate a collisional cascade around a low-mass star like AU Mic is much longer than its 10 Myr age (Kenyon & Bromley, 2008). Moreover, this scenario does not naturally accommodate the presence of a separate, interior planetesimal belt. Of course, the still modest resolution of the data is compatible with more complex scenarios, such as multiple closely-spaced belts of different brightnesses that mimic a smooth gradient. Scattered light observations of the AU Mic disk show asymmetries on both large and small scales, with several peaks and depressions projected against the broad ansae in Figure 1, at radii beyond the millimeter undulations (features A-E; see Fitzgerald et al., 2007). With such a steep emission gradient in this outer belt, the data do not strongly constrain its width, or the location of its inner edge. Our modeling indicates substantial emission from mm-sized grains interior to 40 AU, in the 20-40 AU zone inferred to be highly depleted of m-sized grains from polarized scattered light (Graham et al., 2007).
The ALMA data show no clear evidence for asymmetries or substructure that would signal planet-disk interactions. The hints of modulating millimeter brightness along the belt in Figure 1 are insignificant in the residuals from subtracting a symmetric parametric model (see Figure 3.3). This rules out substructure brighter than 90 Jy beam-1 (3 ), corresponding to dust clumps % of the lunar mass (for the dust properties adopted above). Those limits argue against over-densities of dust-producing planetesimals trapped in mean motion resonances (Kuchner & Holman, 2003), as might arise from the outward migration of planets (Wyatt, 2003). Given the young age of the system, the broad and smooth character of the outer belt in the AU Mic disk may resemble the Kuiper Belt prior to the epoch of Neptune’s migration (Malhotra, 1995). It is interesting that none of the claims of millimeter emission clumps in debris disks have survived scrutiny at higher sensitivity (Piétu et al., 2011; Hughes et al., 2011, 2012). It may be that any such features are effectively erased by collisions (Kuchner & Stark, 2010). We also find no significant centroid offset between the outer belt and central peak, as might result from the secular perturbations of a planet in an eccentric orbit (Wyatt et al., 1999). The limit on the displacement, AU (3 ), corresponds approximately to a limit on , where is the semi-major axis and is the eccentricity. This limit can still accommodate a wide-orbit planet with modest eccentricity, similar to Uranus. Such a planet could be responsible for stirring the disk to 40 AU in 10 Myr (e.g. for AU and , see eqn. 15 of Mustill & Wyatt, 2009). Limits from high contrast direct imaging admit Saturn-mass planets at these separations (Delorme et al., 2012).
4.3 Concluding Remarks
The basic architecture of the AU Mic debris disk appears remarkably similar to the Solar System, with a potential analog to the asteroid belt at a few AU, and a colder, more massive, and apparently truncated counterpart of the Kuiper Belt extending to 40 AU. Future observations are needed to determine if stellar processes could be responsible for emission attributed to the asteroid belt, and to determine if the Solar System analogy extends to include a planetary system like our own.
| ID | Date (UT) | Antennas | PWV (mm) |
|---|---|---|---|
| SB-1 | 2012 Apr 23 07:30 – 09:26 | 17 | 1.7 |
| SB-2 | 2012 Apr 23 09:39 – 11:03 | 16 | 1.7 |
| SB-3 | 2012 Apr 24 09:09 – 11:19 | 18 | 3.0 |
| SB-4 | 2012 Jun 16 05:48 – 08:02 | 20 | 0.7 |
| Parameter | Description | Best-Fit | 68% Confidence Interval |
|---|---|---|---|
| belt flux density (mJy) | 7.14 | +0.12, -0.25 | |
| belt radial power law index | 2.32 | +0.21, -0.31 | |
| belt inner radius (AU) | 8.8 | +11.0, -1.0 | |
| belt outer radius (AU) | 40.3 | +0.4, -0.4 | |
| PA | belt position angle (°) | 128.41 | +0.12, -0.13 |
| belt spectral index | -0.15 | +0.40, -0.58 | |
| Gaussian flux density (mJy) | 0.32 | +0.06, -0.06 | |
| Gaussian offset (AU) | 0.71 | +0.35, -0.51 | |
| Gaussian variance (AU2) | 5.9 | (3 limit) | |
| Gaussian spectral index | -0.35 | +2.1, -4.5 | |
| R.A. offset of belt center (″) | 0.61 | +0.02, -0.02 | |
| Dec. offset of belt center (″) | -0.03 | +0.02, -0.02 |
References
- Augereau & Beust (2006) Augereau, J.-C., & Beust, H. 2006, A&A, 455, 987
- Backman et al. (2009) Backman, D., Marengo, M., Stapelfeldt, K., et al. 2009, ApJ, 690, 1522
- Boley et al. (2012) Boley, A. C., Payne, M. J., Corder, S., et al. 2012, ApJ, 750, L21
- Bower et al. (2009) Bower, G. C., Bolatto, A., Ford, E. B., & Kalas, P. 2009, ApJ, 701, 1922
- Chen et al. (2005) Chen, C. H., Patten, B. M., Werner, M. W., et al. 2005, ApJ, 634, 1372
- Delorme et al. (2012) Delorme, P., et al. 2012, A&A, 539, 72
- Ertel et al. (2012) Ertel, S., Wolf, S., & Rodmann, J. 2012, A&A, 544, A61
- Fitzgerald et al. (2007) Fitzgerald, M. P., Kalas, P. G., Duchêne, G., Pinte, C., & Graham, J. R. 2007, ApJ, 670, 536
- Foreman-Mackey et al. (2012) Foreman-Mackey, D., Hogg, D. W., Lang, D., & Goodman, J. 2012, arXiv:1202.3665
- Goodman & Weare (2010) Goodman, J., & Weare, J. 2010, Comm. App. Math. Comp. Sci., 5, 65
- Graham et al. (2007) Graham, J. R., Kalas, P. G., & Matthews, B. C. 2007, ApJ, 654, 595
- Hauschildt et al. (1999) Hauschildt, P. H., Allard, F., & Baron, E. 1999, ApJ, 512, 377
- Hughes et al. (2011) Hughes, A. M., Wilner, D. J., Andrews, S. M., et al. 2011, ApJ, 740, 38
- Hughes et al. (2012) Hughes, A. M., Wilner, D. J., Mason, B., et al. 2012, ApJ, 750, 82
- Ida et al. (2000) Ida, S., Larwood, J., & Burkert, A. 2000, ApJ, 528, 351
- Kalas et al. (2004) Kalas, P., Liu, M. C., & Matthews, B. C. 2004, Science, 303, 1990
- Kennedy & Wyatt (2010) Kennedy, G. M., & Wyatt, M. C. 2010, MNRAS, 405, 1253
- Kenyon & Bromley (2002) Kenyon, S. J., & Bromley, B. C. 2002, ApJ, 577, L35
- Kenyon & Bromley (2008) Kenyon, S. J., & Bromley, B. C. 2008, ApJS, 179, 451
- Krist et al. (2005) Krist, J. E., Ardila, D. R., Golimowski, D. A., et al. 2005, AJ, 129, 1008
- Kuchner & Holman (2003) Kuchner, M. J., & Holman, M. J. 2003, ApJ, 588, 1110
- Kuchner & Stark (2010) Kuchner, M. J., & Stark, C. C. 2010, AJ, 140, 1007
- Kundu et al. (1987) Kundu, M. R., Jackson, P. D., White, S. M., & Melozzi, M. 1987, ApJ, 312, 822
- Leto et al. (2000) Leto, G., Pagano, I., Linsky, J. L., Rodonò, M., & Umana, G. 2000, A&A, 359, 1035
- Liu (2004) Liu, M. C. 2004, Science, 305, 1442
- Liu et al. (2004) Liu, M. C., Matthews, B. C., Williams, J. P., & Kalas, P. G. 2004, ApJ, 608, 526
- Malhotra (1995) Malhotra, R. 1995, AJ, 110, 420
- Metchev et al. (2005) Metchev, S. A., Eisner, J. A., Hillenbrand, L. A., & Wolf, S. 2005, ApJ, 622, 451
- Morales et al. (2011) Morales, F. Y., Rieke, G. H., Werner, M. W., et al. 2011, ApJ, 730, L29
- Mustill & Wyatt (2009) Mustill, A. J., & Wyatt, M. C. 2009, MNRAS, 399, 1403
- Piétu et al. (2011) Piétu, V., di Folco, E., Guilloteau, S., Gueth, F., & Cox, P. 2011, A&A, 531, L2
- Su et al. (2009) Su, K. Y. L., Rieke, G. H., Stapelfeldt, K. R., et al. 2009, ApJ, 705, 314
- Strubbe & Chiang (2006) Strubbe, L. E., & Chiang, E. I. 2006, ApJ, 648, 652
- Trujillo & Brown (2001) Trujillo, C. A., & Brown, M. E. 2001, ApJ, 554, L95
- van Leeuwen (2007) van Leeuwen, F. 2007, A&A, 474, 653
- Weingartner & Draine (2001) Weingartner, J. C., & Draine, B. T. 2001, ApJ, 548, 296
- White et al. (1994) White, S. M., Lim, J., & Kundu, M. R. 1994, ApJ, 422, 293
- Wilner et al. (2011) Wilner, D. J., Andrews, S. M., & Hughes, A. M. 2011, ApJ, 727, L42
- Wilner et al. (2012) Wilner, D. J., Andrews, S. M., MacGregor, M. A., & Hughes, A. M. 2012, ApJ, 749, L27
- Wyatt et al. (1999) Wyatt, M. C., Dermott, S. F., Telesco, C. M., et al. 1999, ApJ, 527, 918
- Wyatt (2003) Wyatt, M. C. 2003, ApJ, 598, 1321
- Wyatt (2006) Wyatt, M. C. 2006, ApJ, 639, 1153
- Zuckerman et al. (2001) Zuckerman, B., Song, I., Bessell, M. S., & Webb, R. A. 2001, ApJ, 562, L87