10571060\Yearpublication2012\Yearsubmission2012\Month11\Volume333\Issue10\DOI10.1002/asna.201211804
2012 Dec 3
Kepler Fourier Concepts: the performance of the Kepler data pipeline.
Abstract
Given the extreme precision attainable with the Kepler Space Telescope, the mitigation of instrumental artefacts is very important. In an earlier paper (Murphy 2012), the characteristics of Kepler data were discussed in light of their effect on asteroseismology. We continue this discussion now that data processed with the new PDC-MAP pipeline are publicly available; users should use the latest data reductions available at the Mikulski Archive for Space Telescopes (MAST), not just for PDC, but also for improvements in the attached meta-data. We discuss the injection of noise in the frequency range 0-24 d-1 (up to 277 Hz) by the PDC-LS pipeline into 15 per cent of light-curves.
keywords:
methods: data analysis – stars: oscillations1 Introduction
The exquisite precision and long time-base of Kepler data make for excellent demonstrations of some fundamental concepts particular to Fourier transforms. Many of these were presented in Murphy (2012, hereafter Paper I), which addressed characteristics of data of different sampling rates, namely of the Kepler short- and long-cadence data, with 58.9-s and 29.4-min exposures, respectively.
Paper I demonstrated some basic Fourier concepts as applied to Kepler data, such as the importance of having short-cadence (SC) data for investigating Sct stars because of the aliasing generated by the low long-cadence (LC) Nyquist frequency, and also how the study of flares, for instance, can benefit from the increased time-resolution (see, e.g. Balona 2012). Furthermore, Paper I showed how SC data allow for a more precise determination of pulsation frequencies, amplitudes and phases, but do not offer greater frequency resolution, and how the observed pulsation amplitudes in LC data suffer an amplitude-reduction effect due to under-sampling. Also presented therein was the performance of the Pre-search Data Conditioning (PDC) pipeline, whose job it is to remove instrumental systematic signatures whilst preserving the astrophysics, compared to the Simple Aperture Photometry (SAP) data, which undergo only basic calibration. It was shown that the PDC data of Data Release 11 and earlier showed much lower noise than their SAP counterparts, but that spurious low-frequency peaks were evident in the LC PDC data in non-pulsating stars.
This article offers a continuation from Paper I in which we further address a newly-discovered and characterised form of noise injection in the older version of the PDC pipeline, which used least-squares algorithms to process the data, and has thus been renamed PDC-LS to alleviate confusion – this characterisation is presented in § 2. An early performance review of the newer, Maximum A Posteriori PDC pipeline (PDC-MAP) is presented in § 3. We discuss the benefits of continuous Kepler coverage in § 4. The data presented in this paper pertain to Data Release 11 (or earlier) for PDC-LS, and to Data Release 14 for PDC-MAP.
2 Noise injection by PDC-LS
At the time of writing, all Kepler quarters have now been reprocessed with the newer PDC-MAP pipeline and are available on MAST, but PDC-MAP does not yet treat SC data, meaning that SC data are only available in the least-squares format. For further reading on the pipelines, the papers of Stumpe et al. (2012) and Smith et al. (2012) are recommended, along with the Kepler Data Characteristics Handbook111available at http://keplergo.arc.nasa.gov/Documentation.shtml. In this section we provide examples of how the PDC-LS pipeline injects noise into the data, how to detect it, and the on-going efforts to handle the problem.
We demonstrate the way in which PDC noise injection can distort light curves in Fig. 1, and how this affects the Fourier transform in Fig. 2. One of the characteristic features of the injected noise is the drop-off in power around 24 d-1. Specifically, in a logarithmic plot of the power spectrum an extremely rapid reduction in power is seen (Fig. 3), and this was used to identify stars affected by the noise injection. Indeed, this power-reduction was observed in 15 per cent of the stars analysed – those with SC data available and Kepler Input Catalogue (KIC) temperatures between 5500 and 9500 K. The power-reduction is hard to detect in LC due to the low Nyquist frequency, but we stress that the LC data do show the injected noise.
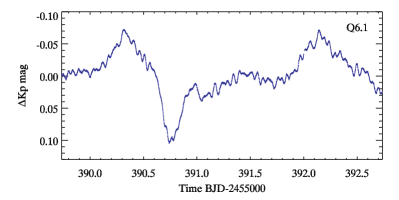
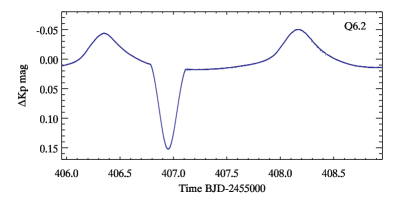


Fig. 4 shows how for the star KIC 3429637 the PDC-LS pipeline injects noise into the SC Q7 data. The noise is restricted solely to PDC-LS data and affects Q7 but not Q8 for this star. The grass level (defined in Fig. 2 caption) is higher in PDC-LS Q7 LC than in SAP Q7 LC (after pre-whitening), so the effect is present in LC too, even if the low Nyquist frequency hides the power drop.

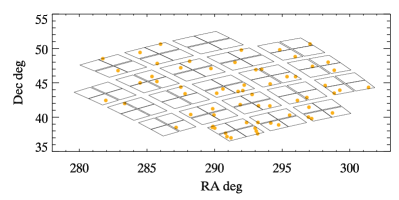
It is not known why some stars are affected while others are not, nor why, for the same star, only some quarters are affected and that these vary for different affected stars. No correlation in fraction of stars affected was seen with , nor was any correlation seen with sky/CCD position (Fig. 5).
Sometimes the pipeline fails to fit a light curve and passes the light-curve through without modification. In the lower panel of Fig. 2, it can be seen that although noise is not injected, low-frequency peaks, which are often caused by trends in the data, are not removed either. In this case, the light curve has perhaps emerged untouched by the pipeline.
3 Performance of PDC-MAP
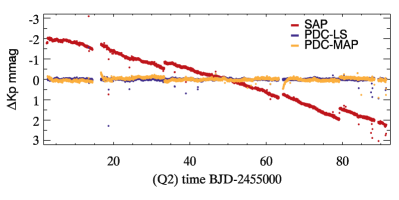
At the time of writing, PDC-MAP has only recently become available for public data. In comparing PDC-MAP with the older PDC-LS and the SAP data (Fig. 6), it is clear that PDC-MAP has strong trends (over many data points) following the gaps in the data that arise from the scheduled data downlinking events. In the older pipeline these trends were fixed quite well. Such teething problems might be expected with new software, somewhat similarly to how the Copernican model of the solar system initially struggled to out-perform the Ptolmiac model because of the substantially larger amount of time invested in improving the latter. PDC-MAP identifies systematic behaviour common to many stars to create a fit to subtract from the data, but there appears to be a great variation between the response of different pixels to the thermal effects that cause the trends, and this effect is convolved with differential velocity aberration, making the light-curves particularly hard to treat.
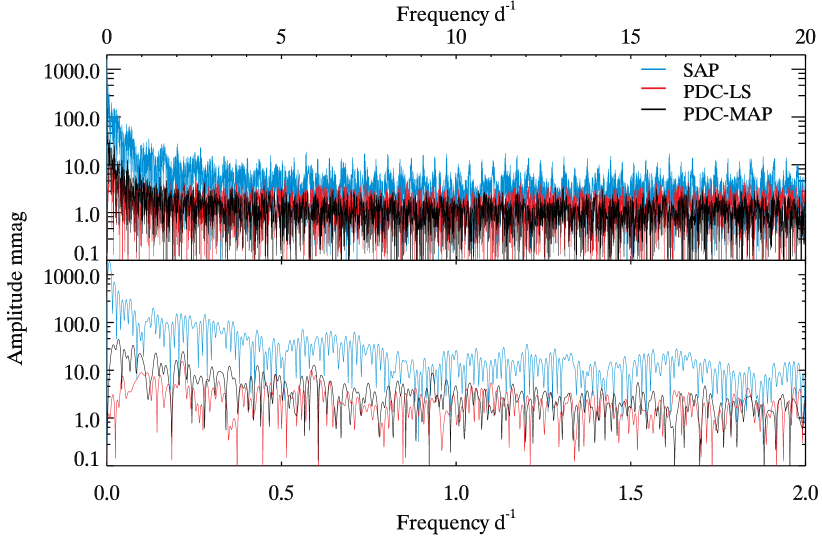
Paper I investigated the difference between SAP and PDC-LS data in Fourier space, noting that the noise in the latter was reduced by factors of 10-100 over the former. Here, we extend that comparison to also include the PDC-MAP data (Fig. 7). It appears that although PDC-MAP is noisier at very low frequency due to the remaining thermal and focussing effects, at higher frequency (above 2 d-1) it out-performs PDC-LS, and has the added reassurance that it preserves stellar variability more satisfactorily than PDC-LS. From Quarter 13 onwards, a cubic fit will also be calculated and subtracted from the data in a pipeline version called ‘multi-scale’ MAP. It is therein assumed that long-term trends on the scale of around one month are systematic and are thus removed.
4 The benefits of continuous Kepler coverage of Sct stars
Kepler SC slots are oversubscribed, such that even though some SC data are desirable (though not required – to be demonstrated in a future publication) to resolve the LC Nyquist aliasing issues, it is mostly only feasible to continuously study a star in LC. Here we shall address the benefits of doing so.
The Sct stars are not particularly stable pulsators. Their amplitudes and frequencies are subject to change, and the literature contains numerous examples such as 4 CVn (Breger 2000), whose pulsation amplitudes have been observed to change unpredictably for decades. With continuous, space-based observations of such high precision, the potential for observing such changes is great. Murphy et al. (2012) have used eight Quarters of Kepler data to investigate the pulsational amplitude growth of the Pup star KIC 3429637. Such observations may prove indispensable in understanding mode interactions and the details of the driving mechanism and damping in operation in Sct stars.
In addition, Shibahashi & Kurtz (2012) have described a method of deriving the mass function of a binary pair using the frequency-modulation (FM) technique on Fourier data, i.e. without the need of spectroscopy. Specifically, if one has continuous LC data covering at least a whole orbit, and one of those stars pulsates (preferably at high amplitude and frequency), then by using the sidelobes present in the Fourier transform one can calculate the parameters of that orbit. So far, only three ‘FM stars’ are known: the prototype in Shibahashi & Kurtz (2012, KIC 4150611), a highly non-linear Sct star with many combination frequencies (KIC 11754974; Murphy et al. 2012b, in prep), and a third star currently under study by Kurtz & Shibahashi. Telting et al. (2012) have found a pulsating sdB in a binary for which the sidelobes were only of borderline significance and thus direct application of the FM technique was ineffective. Under the right conditions, however, it is even possible to detect Jupiter-mass planets orbiting Sct stars with this technique.
Finally, continuous coverage in eclipsing binary systems, or even transiting planets is essential to precisely determine the orbital period and even allow detections of additional bodies through Transit Timing Variations (Ballard et al. 2011). For this reason, the news that the Kepler Space Mission is receiving funding for an extension is particularly exciting.
Acknowledgements
SJM acknowledges the financial support of the STFC and of the ESF, and would like to thank the Kepler Science Office for their continued efforts in improving the pipeline. In particular, he would like to thank Fergal Mullally for the bilateral discussions on the pipeline.
References
- Ballard et al. (2011) Ballard S. et al., 2011, ApJ, 743, 200
- Balona (2012) Balona L. A., 2012, MNRAS, 3069
- Breger (2000) Breger M., 2000, in Astronomical Society of the Pacific Conference Series, Vol. 203, IAU Colloq. 176: The Impact of Large-Scale Surveys on Pulsating Star Research, L. Szabados & D. Kurtz, ed., pp. 421–425
- Murphy (2012) Murphy S. J., 2012, MNRAS, 422, 665
- Murphy et al. (2012) Murphy S. J., Grigahcène A., Niemczura E., Kurtz D. W., Uytterhoeven K., 2012, MNRAS, 427, 1418
- Shibahashi & Kurtz (2012) Shibahashi H., Kurtz D. W., 2012, MNRAS, 422, 738
- Smith et al. (2012) Smith J. C. et al., 2012, PASP, 124, 1000
- Stumpe et al. (2012) Stumpe M. C. et al., 2012, PASP, 124, 985
- Telting et al. (2012) Telting J. H. et al., 2012, A&A, 544, A1